| INVESTIGATION
Evolutionary Pathways for the Generation of New
Self-Incompatibility Haplotypes in a
Nonself-Recognition System
Katarína Bod’ová,*,†,1Tadeas Priklopil,*,‡,1David L. Field,*,§Nicholas H. Barton,* and Melinda Pickup* *Institute of Science and Technology (IST) Austria, A-3400 Klosterneuburg, Austria,†Department of Mathematical Analysis and Numerical Mathematics, Faculty of Mathematics, Physics and Informatics, Comenius University, 84248 Bratislava, Slovakia,
‡Department of Ecology and Evolution, University of Lausanne, UNIL Sorge, Le Biophore, CH-1015, Switzerland, and§Department
of Botany and Biodiversity Research, University of Vienna, Faculty of Life Sciences, A-1030, Austria ORCID IDs: 0000-0002-7214-0171 (K.B.); 0000-0002-4014-8478 (D.L.F.); 0000-0002-8548-5240 (N.H.B.); 0000-0001-6118-0541 (M.P.)
ABSTRACT Self-incompatibility (SI) is a genetically based recognition system that functions to prevent self-fertilization and mating among related plants. An enduring puzzle in SI is how the high diversity observed in nature arises and is maintained. Based on the underlying recognition mechanism, SI can be classified into two main groups: self-recognition (SR) and nonself-recognition (NSR). Most work has focused on diversification within SR systems despite expected differences between the two groups in the evolutionary pathways and outcomes of diversification. Here, we use a deterministic population genetic model and stochastic simulations to investigate how novel S-haplotypes evolve in a gametophytic NSR [SRNase/S Locus F-box (SLF)] SI system. For this model, the pathways for diversification involve either the maintenance or breakdown of SI and can vary in the order of mutations of the female (SRNase) and male (SLF) components. We show analytically that diversification can occur with high inbreeding depression and self-pollination, but this varies with evolutionary pathway and level of completeness (which determines the number of potential mating partners in the population), and, in general, is more likely for lower haplotype number. The conditions for diversification are broader in stochastic simulations offinite population size. However, the number of haplotypes observed under high inbreeding and moderate-to-high self-pollination is less than that commonly observed in nature. Diversification was observed through pathways that maintain SI as well as through self-compatible intermediates. Yet the lifespan of diversified haplotypes was sensitive to their level of completeness. By examining diversification in a NSR SI system, this model extends our understanding of the evolution and maintenance of haplotype diversity observed in a recognition system common inflowering plants.
KEYWORDSself-incompatibility; diversification; balancing selection; inbreeding depression; S-locus F-Box; SRNase
T
HE origin and maintenance of the extraordinary diversity observed at loci involved in genetically based recognition systems such as major histocompatibility complex in animals (Hedrick 1998), mating types in fungi (May et al. 1999) and self-incompatibility (SI) in plants (Wright 1939; Lewis 1949) has long fascinated evolutionary biologists. In all thesesystems, balancing selection maintains genetic variation (Charlesworth 2006a; Delph and Kelly 2014). Plant SI is widespread in flowering plants (Igicet al.2008) and func-tions to prevent self-fertilization and the consequent dele-terious effects of inbreeding depression. Here, negative frequency-dependent selection (NFDS), a form of balancing selection where a rare allele has a selective advantage (Wright 1939), maintains the high diversity observed in nature (Lawrence 2000). Yet one of the most intriguing questions in the evolution of SI is how new alleles (S-haplotypes) evolve (Uyenoyama et al. 2001; Chookajorn et al. 2004; Gervais et al. 2011). This evolutionary puzzle originates from coevolution of the male and female determining com-ponents of the incompatibility reaction. A unifying feature of all SI systems (see the list of acronyms in Table 1) is
Copyright © 2018 by the Genetics Society of America doi:https://doi.org/10.1534/genetics.118.300748
Manuscript received January 23, 2018; accepted for publication April 28, 2018; published Early Online April 30, 2018.
Supplemental material available at Figshare: https://doi.org/10.25386/genetics. 6148304.
1Corresponding authors: Institute of Science and Technology Austria, Comenius University,
that the incompatibility reaction is controlled by a single polymorphic locus with low recombination between male-and female-specificities (Takayama male-and Isogai 2005). A mu-tation in one component may cause the breakdown of SI, with selection against the self-compatible (SC) individual due to inbreeding depression (Charlesworth 2006b). This raises the question of whether self-compatibility is involved in the process of S-haplotype diversification and if the evolutionary pathways involved vary between different SI systems.
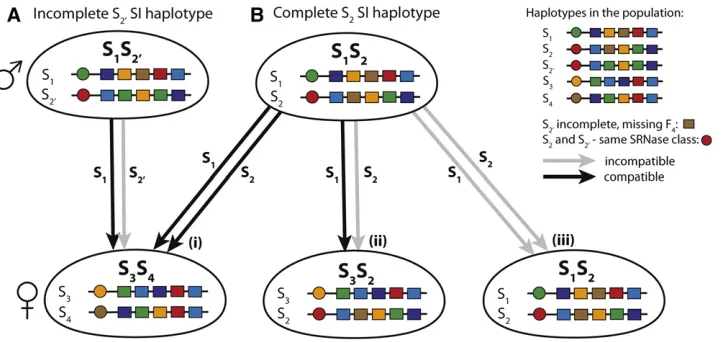
An additional complexity in understanding the evolution of SI is that very different evolutionary dynamics are expec-ted for self-recognition (SR)vs.nonself-recognition (NSR) SI (Fujii et al. 2016). Molecular characterization of the three main systems representing the Brassicaceae (pollen ligand and stigmatic receptor kinase), Papaveraceae (Ca2þ-dependent signaling) and Solanaceae type, includ-ing the Plantaginaceae and Rosaceae (Ribonuclease (SRNase) and F-Box (SLF) protein) (for reviews, see Takayama and Isogai 2005; Iwano and Takayama 2012) has revealed striking differences between SR and NSR systems, especially in the evolutionary relationships between the male- and female-determining components (Fujiiet al.2016). In the SR systems (Brassicaceae and Papveraceae), it is the recognition of self that prevents fertilization (Takayama and Isogai 2005; Iwano and Takayama 2012). This results in tight coevolution between male- and female-determining components in a single haplo-type shown by their congruent genealogies and a common evolutionary history. However, for NSR (Solanaceae type), the inability to recognize self prevents self-fertilization but al-lows fertilization by pollen from genetically distinct individuals (Takayama and Isogai 2005; Kuboet al.2010). Here, the male-determining components (SLF) have coevolved to recognize and detoxify the female-determining SRNases from all haplo-types other than their own (Figure 1). High polymorphism and sequence divergence among SRNase genes, compared to high sequence conservation of SLF genes from different haplotypes reflects the different patterns of coevolution in NSR systems (Fujiiet al.2016). These inherent differences between SR and NSR systems could result in distinct pathways for the evolution of novel S-haplotypes. Moreover, a unique property of NSR systems is the degree of completeness and incompleteness, which will determinefitness and mate availability (see Figure 1). A complete haplotype has all the SLFs required to detoxify all other SRNases in the population, while an incomplete hap-lotype can vary in the number of missing SLFs (degree of in-completeness). Including this information is essential to fully characterize the NSR system and to understand how incom-pleteness can influence diversification dynamics.
Recent theory has provided a basis for understanding the evolution of novel incompatibility types in both SR and NSR systems. Based on the evolutionary dynamics of SR systems, Uyenoyamaet al.(2001) and Gervaiset al.(2011) present a two-step model for the evolution of novel S-haplotypes where first there is a mutation in the male specificity, fol-lowed by a corresponding mutation in the female specificity.
Under conditions of strong inbreeding depression and lower selfing rate, Uyenoyamaet al.(2001) found that new speci-ficities arise via evolutionary pathways that include a loss of SI (i.e., a self compatible intermediate). However, the novel S-haplotype was often found to replace the ancestral haplo-type, so that diversification—an increase in haplotype numbers— was limited. Moreover, in this model, diversification through the pathway that involved an initial female (pistil) mutation followed by a mutation in the male (pollen) component was thought to be impossible (Uyenoyama et al. 2001). This model was analyzed further by Gervais et al.(2011), who found that diversification was possible under conditions of high inbreeding depression and a moderate-to-high rate of self-pollination. Furthermore, the rate of diversification was higher with fewer S-haplotypes in the population (Gervais et al. 2011) since there is stronger selection when there are fewer S-haplotypes.
For NSR systems, Fujiiet al.(2016) recently presented a conceptual two-step model for novel S-haplotype evolution. In this model, a mutation to generate a new SLF occursfirst on some haplotype, which, given there is no associatedfitness cost, increases in frequency via drift. Once the new SLF is common enough, a novel self-incompatible haplotype can be generated by a corresponding mutation in the SRNase in another haplotype (i.e., the two mutations occur on different haplotypes). Fujiiet al. (2016) then provide simulations to support this model that suggest diversification via this path-way is possible, but that genetic exchange among S-haplotypes is important for new haplotype evolution (Fujiiet al.2016). Although this model provides a useful basis for investigating the evolution of novel S-haplotypes in NSR systems, there are questions regarding its plausibility as the driving force in generating novel SI haplotypes. First, we observe that, for the newly generated SI haplotype to be able to invade, the novel SLF gene created in the first step must increase to a high frequency as otherwise the fertilization of the new SI haplotype will be unlikely. This implies that the new SLF gene should ideally occur in many haplotypes, and therefore either recurrent mutations must happen on different haplotypes, or genetic exchange must be common. Second, even if the new SLF spreads to reach a sufficient frequency, the newly created incomplete haplotype is still rejected by at least two haplo-types—itself and the ancestral type—and is thus at a selective disadvantage due to mate limitation. Finally, their model only considers the evolution of new incomplete haplotypes through a pathway that maintains SI. Consequently, it remains unclear to what extent the path proposed by Fujiiet al.(2016) is re-sponsible for the diversification of SI haplotypes in NSR sys-tems. Further theory is therefore required to examine all potential evolutionary pathways, including those with SC in-termediates, and examine how the evolutionary outcomes vary with parameters such as inbreeding depression, selfing rate, number of haplotypes and with mate availability medi-ated by incompleteness.
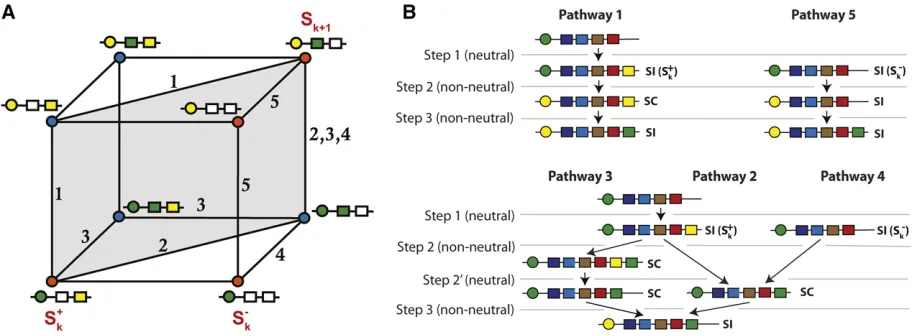
mutation for diversification in a NSR SI system. First, we propose an explicit population genetic model for the evolution of novel S-haplotypes for NSR systems that includes path-ways with a maximum of two selected (non-neutral) muta-tions on a single haplotype (Figure 2). In this model, there are five potential evolutionary pathways, all starting from an ancestral SI haplotype, which we arbitrarily label Sk: The
S-haplotype may be in two states, with either the presence (Sþk) or absence (S2k) of the novel SLF, so that a single neutral mutation separates the two states. Following this, the first non-neutral mutation may be a change in the SRNase (female specificity) gene (pathway 1 fromSþk or pathway 5 fromS2k), the simultaneous loss and gain of an SLF (male specificity) gene (pathway 2), or gain of an SLF gene (pathway 3 fromSþk or pathway 4 fromS2k) (Figure 2, A and B). The second non-neutral mutation then involves either the gain of the novel SRNase (pathways 2, 3, and 4; notice that pathway 3 requires an additional neutral mutation), loss of the novel SLF to re-store SI (pathway 1), or gain of the ancestral SLF (pathway 5). Consequently, in this model, a new S-haplotype can evolve via a number of pathways, including four that involve a SC intermediate, and one in which SI is maintained. Genetic and demographic factors such as selfing rate, level of inbreed-ing depression, mutation rate, number of haplotypes, and population size (Wright 1939; Uyenoyama et al. 2001; Gervaiset al.2011) may affect the rate and trajectory of di-versification at the S locus. Despite their potential impor-tance, to date, no models have examined these conditions and how they interact with S-haplotype diversification in NSR systems. Our model examines these conditions and re-lates this to the different evolutionary pathways that may generate novel S-haplotypes. Moreover, by considering all pathways, and reducing our model to correspond to previous models (Uyenoyamaet al.2001; Gervaiset al.2011), we can also directly compare these studies (based on SR) with ours, which considers the dynamics of NSR SI systems.
To investigate the pathways and conditions associated with novel S-haplotype evolution, wefirst establish a deterministic population genetic model for the NSR system. By examining all potential evolutionary pathways (Figure 2), we ask: what conditions (inbreeding and self-pollination rate) are associated
with the evolution of new S-haplotypes and does this vary with evolutionary pathway? Do novel S-haplotypes evolve through SC intermediates? How does completeness (having a full set of SLFs from the population) influence diversification? And, does this vary with haplotype number? Following this, using stochas-tic simulations withfinite population size, we ask, in addition to the effect of inbreeding depression and selfing rate, what is the influence of population size, mutation rate, and number of po-tential haplotypes on the evolution of new specificities in a NSR system? Finally we ask if certain evolutionary pathways are more common for SI haplotypes with long lifespans and high frequencies. Diversification was possible in our analytical model, but the parameter space for diversification was more limited than in stochastic simulations and varied with haplotype number and the level of completeness. Furthermore, in the analytical model, diversification generally resulted in a short-term increase in S-haplotype numbers, especially in the path-way that maintains SI. This increase was only short-term because incomplete haplotypes slowly go extinct unless they acquire a full set of SLFs. In comparison, in the stochastic sim-ulations, S-haplotype diversification was observed even for the pathway maintaining SI. This difference highlights the potential importance of drift, unconstrained mutational order, and muta-tion rate for diversificamuta-tion outcomes. By considering all evo-lutionary pathways, and the conditions associated with S-haplotype diversification, our model combines analytical theory and stochastic simulations to provide new insights into the evolutionary dynamics of NSR SI systems in plants.
Methods
The NSR system
The genetic mechanism of our NSR system is based on the model proposed by Kuboet al.(2010) and Fujiiet al.(2016). This is a gametophytic SI system where incompatibility is determined by the haploid genotype of the pollen. We as-sume that each haplotype consists of two tightly linked loci: anR-locus and anF-locus. AnR-locus determines the female specificity and consists of a single RNaseRi;whereas, at the F-locus, male specificity is determined collaboratively by sev-eral SLF genes (F-boxes)F1;F2;. . .:In the analytical model
(see below) we make no assumptions on the length (L) of this sequence, and so the appearance of a new SLF may either keep the length of the haplotypeLintact (e.g., a change of specificity of an old SLF), orLmay increase due to a duplica-tion event. However, in the stochastic simuladuplica-tions (see be-low), we assume that the number of SLFs in each haplotype is constant (Lis constant), implying that a mutation in the SLF results in the simultaneous appearance (addition) and disappearance (deletion) of an SLF. We assume a one-to-one correspondence between SLFs and RNase, such that each SLF Fiis assumed to detoxify (recognize) exactly one RNase,Ri;
and each RNaseRiis recognized by exactly one SLF,Fi:This
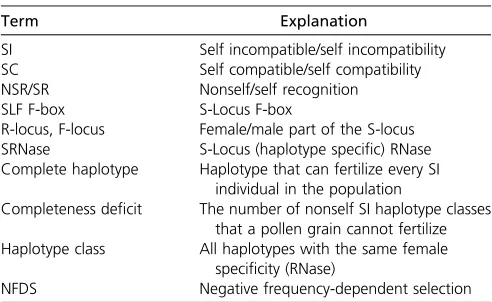
implies, for example, that a pollen haplotype needs to have both SLFsFiandFjin order to recognize, and thus be able to Table 1 Abbreviations and terminology
Term Explanation
SI Self incompatible/self incompatibility
SC Self compatible/self compatibility
NSR/SR Nonself/self recognition
SLF F-box S-Locus F-box
R-locus, F-locus Female/male part of the S-locus
SRNase S-Locus (haplotype specific) RNase
Complete haplotype Haplotype that can fertilize every SI individual in the population
Completeness deficit The number of nonself SI haplotype classes that a pollen grain cannot fertilize Haplotype class All haplotypes with the same female
specificity (RNase)
fertilize, a diploid plant with Ri and Rj RNase (Figure 1).
Conversely, incompatibility results from the failure of a pollen grain to recognize both RNase of a diploid female. For a pollen grain to be able to fertilize all individuals with incom-patibility types other than its own type in the population it needs to have as many SLFs as there are RNase present in the whole population except the one recognized by its own RNase. If a haplotype has all the required SLFs, we call itcomplete(and otherwise incomplete). We emphasize that completeness is a property of a haplotype, but also depends on the composition of the population (Figure 1). The level of incompleteness of a haplotype is described by the completeness deficit, which mea-sures the number of missing SLFs. Ahaplotype classrepresents all haplotypes that have the same female specificity (RNase) but may have different sets of SLFs. We treat as one SI class all complete and incomplete SI haplotypes with the same RNase (Figure 1).
Evolutionary pathways for the generation of new SI haplotypes: the cube
In the NSR system, the generation of a new SI haplotype requires mutational changes not only in a focal haplotype but also in other haplotypes in the population. Moreover, some of the required mutations may be under selection, but some are not. We thus need to make a distinction between the number of neutral and non-neutral (selected) mutations in the focal haplotype, as well as the numbers on other haplotypes in the population. In this paper, we consider all evolutionary path-ways for the generation of new SI haplotypes that allow up to two selected mutations on a single haplotype. As in the pre-vious work on the evolution of new SI haplotypes (Uyenoyama
et al.2001; Gervaiset al.2011), we start by considering an initial population of k complete SI haplotype classes, and discuss all the mutations that lead to a new complete SI haplotype class.
Step 1 (initial condition; neutral mutations): For every diversification pathway, thefirst mutation in the population must necessarily give rise to a haplotype with a novel male specificity,i.e., a new SLF; a haplotype with a new female specificity will never be fertilized and thus can never invade (Figure 2). We start our analysis by either assuming that the novel SLF already exists in some SI haplotype classes in the population, or that itfixes due to drift. And so we enter the Cube (Figure 2).
Step 2 (1st non-neutral mutation):Suppose that the novel not-yet utilized SLF, which we label Fkþ1;is fixed withinn
different SI classes. We will follow changes on a haplotype, saySk(or any other of thekexisting SI classes; note thatSkis
not necessarily the class that underwent the previous diver-sification event), which may or may not have the novel SLF Fkþ1: We writeSþk if the haplotype class has the novel SLF Fkþ1;andS2k if not. Each pathway is described in Figure 2.
Three selectively different events may follow: a mutation in theR-locus, either (i) on aSþk haplotype (pathway 1), or (ii) on aS2k haplotype (pathway 5), or a mutation in theF-locus (iii) such that haplotypeSk(Sþk orS2k) obtains an SLFFkthat
corresponds to its RNaseRk(pathways 2, 3, and 4).
path 3 requires an additional neutral mutation), gain of the ancestral SLF (pathway 5), or replacement of the new SLF by the ancestral SLF (pathway 1); see Figure 2.
Final state of the population: All five evolutionary paths lead to a novel complete SI haplotypeSkþ1:If all initialkSI
haplotype classes remain in the population during this pro-cess, we say that the paths are diversification pathways. Re-call, however, that since we assume that ink2nof the initial kSI classesFkþ1is absent, then, after the diversification
pro-cess (provided no further mutations have happened in the population),k2nSI classes are incomplete and will not be able to fertilize the new SI classSkþ1:
Two remarks are in order. First, the steps described above give a detailed description of all the changes in the population needed to generate a new complete SI class. This, however, may seem an overly strict requirement, especially for largek, since missing one or two SLFs only slightly affects the fre-quencies of haplotypes compatible with the focal haplotype. If we relax the requirement of completeness, we need, in principle, only two changes (one non-neutral) in the popula-tion. First, a single haplotype class gains a“not-yet utilized” SLFFkþ1;after which another haplotype classS2k undergoes a
mutation in theR-locus, generating an incomplete SI haplo-type Skþ1 (step 2, first non-neutral mutation of pathway 5,
Figure 2). This path was also identified by Fujiiet al.(2016). It remains to be seen, however, whether this path is likely (or even possible) under the various levels of incompleteness (parametern) and demographic parameters used in this pa-per. Second, if we assume that allkSI classes initially have the new SLF Fkþ1 (i.e.,n¼k), and then restrict the
subse-quent mutations to the diagonal of the cube (highlighted rectangle in Figure 2,i.e., considering only pathways 1 and 2), we recover the SR model in Uyenoyamaet al.(2001) and Gervaiset al.(2011). This allows us to directly compare the evolutionary diversification pathways in NSR and SR sys-tems. Finally, we remark that since in the NSR model path-ways 1 and 2 imply a simultaneous loss and gain of two specific SLF, we predict that these pathways (if feasible) are less common than the alternative pathways 3, 4, and 5. This should be observed in the stochastic simulations, where the rate of mutations is considered explicitly.
The life cycle of an individual and the dynamics of the population
In this section, wefirst give the life cycle of an individual and then give the recurrence equations to study the dynamics of haplotypes for both infinite andfinite population models. The infinite population model is the large population limit of the stochasticfinite population model.
Figure 2 (A) Potential pathways for the evolution of a novel SI haplotype for the gametophytic SRNase/F-box NSR SI system. A novel SI haplotype in class Skþ1(top right corner) evolves from an ancestral SI haplotype in classSk(eitherSþk bottom left corner orS2k bottom right corner; the transitions between Sþ
k andSk2are selectively neutral, see main text) via a number of potential evolutionary pathways. Each side of the cube represents a mutation in either the male (SLF; represented by a box) or female (SRNase, represented by a circle) specificities that make up the S-haplotype. Mutations along the horizontal planes of the cube involve the male SLF gene, with a deletion (from afilled to open box) or addition (from open tofilled box). An open box may be seen either as an SLF that is not utilized, or as a place-holder for a SLF, which is then added, for example, by duplication (see the main text). Mutations in the vertical plane represent a mutation to generate a novel SRNase (from green to yellow circle). At each vertex, red circles represent SI haplotypes (no SLF to detoxify its own SRNase) and blue circles SC haplotypes (SLF present to detoxify its own SRNase).Sþ
k is the initial haplotype with the SLF corresponding to the novel SRNase; while inSk2the SLF for the novel SRNase is missing. Pathways 1 and 2 (starting withSþk;or alternatively with S2
k followed by a neutral mutation to obtainSþk) involve two mutations with a SC intermediate. Pathway 5 (starting withS2k) involves two mutations and SI is maintained. Pathway 3 (starting withSþk) involves three mutations and a SC intermediate. Pathway 4 (starting withSk2) involves two mutations and a SC intermediate. The highlighted gray diagonal rectangle indicates pathways 1 and 2 which have been previously considered by Uyenoyamaet al. (2001) and Gervaiset al.(2011). (B) Mutations involved in thefive pathways that result in a novel SI haplotype. For all pathways, thefirst mutation (step 1) is neutral because there is not yet a corresponding SRNase in the population. This step involves either the presence (Sþ
Consider a well-mixed population with nonoverlapping generations, such that one iteration of the (finite and infinite population) model represents the full life-cycle of an individ-ual (e.g., annual plants). At the beginning of the season, each diploid individual plant produces, and receives, a large num-ber of haploid pollen grains. Of all the pollen received a pro-portionais assumed to come from the same individual, and 12afrom a pollen pool from all the other plants (i.e., global pollen dispersal). The proportion of haplotypes received is proportional to the frequency distribution of the pollen in the whole population. Importantly, we assume that all out-crossed mating events are among unrelated individuals and that self-fertilized offspring undergo inbreeding depression Uyenoyamaet al.(2001), Gervaiset al.(2011). Self-fertilized offspring survives until adulthood with a fixed probability 12drelative to outcrossed offspring. After offspring are pro-duced, all adults die. A possible mutation occurs at the time of reproduction. We assume that the S-locus is nonrecombining. In this paper, we also assume that there is no geographic structure. Thus we make no distinction between globally and locally incomplete S-haplotypes, implying that mate lim-itation due to completeness plays a lesser role in structured populations (seeDiscussion).
Infinite population model:Following the assumptions of the life cycle of an individual (see above), the probability that an individual with genotypegis self-fertilized is equal to the num-ber of self-pollen grains received that are SC, divided by the total number of compatible (self and nonself) pollen grain received:
pselfg)g¼
aDDg)g aDDg)gþ
P
rð12aÞprDHg)r
(1)
whereDDg)gis a diploid fertilization function that gives the
fraction 0;1=2 or 1 of self-pollen that can self-fertilize,DHg)ris
a haploid fertilization function that gives the probability that a pollen with haplotypercan fertilize a diploid individualg, and pr is the frequency of (haploid) pollen rin the whole
population. Similarly, the probability that an individual with genotypegis outcrossed with haploid pollenhis
poutg)h¼
ð12aÞphDHg)h aDDg)gþ
P
rð12aÞprDHg)r
: (2)
If the plant is self-fertilized, the offspring survives until adulthood with probability 12drelative to outcrossed offspring. The fre-quency of (diploid) genotyperin the next generation is
x9r¼ 1 W
2
4ð12dÞX
g
xgpselfg)gRg;g/rþ
X
g;h
xgpoutg)hRg;h/r
3 5;
(3)
where Rg;h/r is the probability that a diploid
indi-vidual g that is fertilized by a haploid pollen h produces a diploid offspring r (according to Mendelian rules),
W¼ ð12dÞPgxgpselfg)gþ P
g;hxgpoutg)h is the averagefitness
in the population, and where, for clarity, we usexto denote (diploid) genotype frequencies.
To study the conditions for the various diversification pathways we suppose, in the infinite population model, that initially the population consists of k SI classes, with equal frequencies 1=k and no SC haplotypes. Moreover, nout of thesekclasses have the novel not-yet utilized SLFFkþ1fixed
within the class. The haplotypes in the remainingk2n clas-ses do not haveFkþ1:We note that each haplotype may have a
different number of SLFs, i.e., Lis not fixed in the infinite population model.
Finite population model:LetNdenote the number of indi-viduals considered in each simulation (i.e., 2Nhaplotypes). Each haplotype is represented by a sequence
S¼Rk0Fk1Fk2. . .FkL (4)
denoting the states at a single female determining SRNase and afixed numberLof male SLF genes. KeepingLfixed implies that the appearance of a new SLF gene is accompanied by loss of another SLF gene. However, the effect onfitness becomes small whenLis large as it increases the likelihood that the lost SLF gene does not correspond to any of the RNase in the population, and, thus, has no affect on the mate availability of the haplotype. Unlike in the infinite population model, where we assumed initial presence of SI classes, the initial state in the finite population simulations consists of identical SC haplotypes,i.e., all haplotypes carried the same SRNase and the same (random) sequence of SLF-genes. This choice of the initial state allowed us to capture the initial phase of the evolution of SI haplotypes where SI appears and forms a functional system with at least three SI haplotypes. Moreover, the combination of mutation and drift results in intermediate populations, which can be much more diverse in comparison with the infinite population model,i.e., thefinite population model allows multiple simultaneous diversification events at the same time. Thus, thefinite population model may reveal some of the limitations of the infinite population model. Each generation consisted of the life-cycle described above; while each life cycle consists of mutation, followed by reproduction and viability selection.
Mutation:We assumed afinite space of distinct RNase types
fR1;R2;. . .;RnRgand SLFsfF1;F2;. . .;FnFg;where the pollen
typeFitargets the RNaseRi(nF¼nR). The number of
muta-tions in the RNase and in the SLFs were drawn randomly from a binomial distribution with parameters ð2N;mRÞ for
RNase mutations andð2NL;mFÞfor SLF mutations and
ran-domly placed on the genotypes. Here, mRandmF represent
the probability of a mutation in a given generation either in the RNase or in a single SLF. The binomial distribution can be replaced by the Poisson distribution with parameters 2NmR
(female) and 2NLmF(male), since the two distributions are
the same in the limit of small mR;mF and largeN,L(valid
all RNase-mutationsRi/Rj;and similarly for all SLF
muta-tionsFi/Fjfor anyi;j:
Reproduction and viability selection:The second part of the simulation consisted of randomly generating the mating part-ners and their offspring, incorporating the compatibility be-tween individuals and selection in terms of selfing a and inbreeding depressiond.
In the infinite population model, the frequencies of indi-vidual genotypesgin the next generation can be obtained by solving a system of difference equations (3). However, sto-chastic simulations use probabilistic rules to determine off-spring production for all parent combinations. These rules quantify the probability that female gametesgand male pol-lenhproduce an (adult) offspring as
Pg;h¼ 1 W
h
ð12dÞxgpselfg)gIðg2hÞ þxgpoutg)h
i
: (5)
where pself
g)g and poutg)h are defined in (1) and (2), and Iðg2hÞ= 1 wheng¼hand 0 otherwise. The mean popula-tionfitnessW ensures thatPg;hPg;h¼1:Thefirst term in (5)
captures self-fertilization and is nonzero only when g¼h; while the second term in (5) reflects outcrossing events be-tween genotypesgandh. The simulation required two steps: using the current genotypes fgig; their frequenciesxgi and
compatibility relationships pselfg)g;poutg)h;we first generated N parental pairs g;h (distinguishing between females g and males h) by stochastic sampling with probabilities
ðg;hÞ/Pg;h. Next, we randomly generated a single offspring
for each parental pair using Mendelian inheritance.
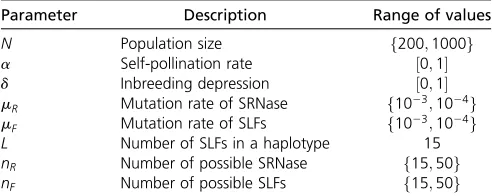
We ran the simulation for afixed number of generations (1032104 generations) with parameters N,
mR;mF; a, d,
summarized in Table 2. The structure of the space of possible haplotypes depends on our choice of parametersnR;nF;and L. We recorded the list of genotypes in the population at all times, as well as a list of all mutations. This allowed us to trace the key measures and to:
1. Classify haplotypes based on their haplotype classes. Ini-tially, a single SC class is present in the population (no SI classes were initially present).
2. Classify haplotypes based on compatibility among SI clas-ses. We distinguish between SI and SC haplotypes and, in combination with the grouping in 1, we plot the frequen-cies of SI and SC haplotypes within each class.
3. Classify haplotypes based on completeness deficit,i.e., the number of nonself SI classes that cannot be fertilized be-cause of missing SLFs. This measure depends on the num-ber of SI classes, as it cannot exceed the numnum-ber of SI classes21. The minimal completeness deficit of an event is computed as a minimum deficit through all times during the lifetime of the event and through all SI haplotypes within the class at each time.
4. Identify all birth/death events of the SI classes. Birth of a new SI class of typekis an event that occurs at generation tif there is at least one SI haplotype with SRNaseRkat the t-th generation while there was none such haplotype in
the previous generation. Death of thek-th SI class occurs when the last SI haplotype from that SI class vanishes at generationt, provided there was at least one such individ-ual at generationt21:
5. Trace the genealogy of the SI classes. We can trace the order of mutations that led from the ancestral haplotype to any other haplotype and record the times at which the mutation occurred. This allows us to trace the pathway leading to a birth (or death) event of any SI class. We chose the representative haplotype of each event as the first haplotype that reached the minimal completeness deficit of this event. The results were almost identical when the last haplotype in the class was chosen as a rep-resentative haplotype. We then traced back all its ances-tors from the current and previous RNase class and projected it onto a mutation cube in Figure 2.
Data availability
The authors affirm that all data necessary for confirming the conclusions of the article are present within the arti-cle,figures, and tables. Supplemental Material (File S1 and File S2) available at Figshare: https://doi.org/10.25386/ genetics.6148304. File S1 containsfigures that further clarify the following features: (i) effect of population size on the average number/frequency of SI classes; (ii) changes in the minimal completeness deficit in time for a single class; and (iii) diversification diagrams for all studied pathways, including the summary figure for k¼8: File S2 contains the code required for a stochastic simulation of the SLF sys-tem with an example. Thisfile also includes the output in the form offigures and tables.
Results
Theoretical predictions of evolutionary outcomes
Our model examinesfive potential pathways for the evolution of new SI haplotypes (see Figure 2), which includes four pathways with SC intermediates (pathways 1, 2, 3, and 4) and one where SI is maintained (pathway 5, see Figure 2). These pathways are also defined by the initial state of the population (i.e., before thefirst functional mutation occurs), where pathways 1, 2, and 3 assume that the novel SLF (Sþk) is Table 2 Parameters of the NSR model used in simulations
Parameter Description Range of values
N Population size f200;1000g
a Self-pollination rate ½0;1
d Inbreeding depression ½0;1
mR Mutation rate of SRNase f1023;1024g
mF Mutation rate of SLFs f1023;1024g
L Number of SLFs in a haplotype 15
nR Number of possible SRNase f15;50g
initially present in the population, while the novel SLF is initially absent in pathways 4 and 5 (S2k). The transition
be-tween the two initial states is selectively neutral and requires only a single mutation in the SLF of haplotypeSk:We divide
the parameter space, proportion of self-pollination (a), and inbreeding depression (d), into regions that represent; di-versification (green; long-term increase in the number of SI haplotypes, loss of the intermediate mutant), short-term di-versification (light magenta; short-term increase in the num-ber of SI haplotypes), exclusion of the novel SI haplotype (Skþ1;gray), novel SI haplotypeSkþ1 replaces its ancestral
SI haplotypeSk(red; no diversification), SC haplotypes go to
fixation (below the thick line; no SI present in the system), see Figure 3.
The maintenance of complete and incomplete haplotypes:
To disentangle the complexities involved in the diversi-fication process, it isfirst useful to compute the effect of (in)completeness (number of missing SLFs) on mate availabil-ity andfitness, and determine whether (and when) complete and incomplete SI haplotypes coexist in the population (see Appendix A for the exact calculations). Complete SI haplo-types are maintained in the population due to NFDS, and, when rare, they have a selective advantage and increase in frequency. However, populations with incomplete haplotypes may not maintain all haplotypes. Here, rare incomplete hap-lotypes are expected to have afitness advantage over common incomplete haplotypes with an equal, or lower, levels of completeness, but not over haplotypes with higher levels of completeness (e.g., fully complete haplotypes). Therefore, even though incomplete haplotypes are under NFDS, they may not have sufficiently highfitness to increase in frequency when rare. We thus aim to resolve the conditions under which haplotypes with varying levels of completeness are maintained in the population. This is useful for investigating the feasibility of diversification pathways because, in gen-eral, diversification will result in some fraction of incomplete haplotypes.
Aligned with our assumptions on the diversification path-ways (seeMethods), we provide the exact analytical calcula-tions for whichkþ1 SI haplotypes, some complete and some incomplete, can coexist in the population. Out of the kþ1 haplotypes,k2nare assumed incomplete and lack a single but identical SLF. The remaining nþ1 SI haplotypes are assumed complete, including one that cannot be fertilized by thek2nincomplete haplotypes corresponding to the hap-lotypeSkþ1in the diversification pathways (Appendix A). We
find that when there were, in addition toSkþ1;no complete
haplotypes (n¼0) coexistence is possible only when the ini-tial number of haplotypes (k) is three, but not fork.3:With one complete haplotype (n¼1) coexistence is possible only for 3#k#6 but never for k.6; and for 1,n,k coexis-tence is not possible for anyn;k:However, when all haplo-types are complete (n¼k), coexistence is possible for allk. This implies that diversification is possible only when either a single haplotype is complete (n¼1) but the total number of
haplotypes is small (k#6), or when all haplotypes are com-plete (n¼k). Despite these rather strict requirements for diversification, there are several caveats. First, the frequency of an incomplete haplotype, if initially present in the popula-tion, decreases to zero very slowly. This haplotype could therefore be rescued from extinction by gaining the missing SLF, which results in increased mate availability. Second, these results do not explicitly consider diversification events that involve the coexistence of SI and SC types. Third, we considered only the case where all incomplete haplotypes lack a single and identical SLF, thus coexistence and diversi-fication may be possible for haplotypes with varying levels of completeness and different missing SLFs. Finally, our results hold only for global pollen dispersal. When dispersal is local, we expect that globally incomplete haplotypes that are lo-cally complete will be maintained in the population. Next, we complement these results by studying all evolutionary diversification pathways, including intermediate haplotypes, to determine which diversification pathways are the most likely.
Pathway 1: SRNase as thefirst mutation:Previous models (Uyenoyamaet al.2001; Gervaiset al.2011) suggested that diversification is not possible through pathway 1 (first muta-tion in the female-specificity). Our model can be reduced to correspond to these models for pathways 1 and 2 when all SI haplotypes are assumed complete and the dynamics are con-strained to the diagonal of the cube (highlighted pathways in Figure 2). Pathway 1 represents a mutationfirst in the female SRNase leading to a SC intermediate followed by the pollen-part mutation (SLF) to produce a SI haplotype (Figure 2). Our results show that diversification via this pathway is pos-sible for all levels of completeness (n) and haplotype number (k) (see Figure S3 in the Supplemental Material). The appar-ent discrepancy with our previous result that diversification is possible only forn¼1 orn¼koriginates from the fact that here, in pathway 1, the intermediate SC haplotype is not excluded in the diversification process. However, when con-sidering diversification through all pathways (Figure 2), di-versification via pathway 1 occurs in the parameter region where SC haplotypes (produced in pathways 2, 3, and 4) have afitness advantage, ultimately resulting in the loss of SI (region below the thick black line in Figure 3, see also Figure S3 in the Supplemental Material). Consequently, for both SR and NSR systems, it appears that diversification is unlikely through this evolutionary pathway.
under two scenarios; first, through pathways 2, 3, and 4, when the number of complete haplotypes was one (n¼1; green region in Figure 3Aii), and, second, when all haplo-types were complete, through pathways 2 and 3 (green re-gion in Figure 3Aiv). When the number of complete haplotypes was between 1 andk, only short-term diversifica-tion was possible (light magenta region in Figure 3Aiii), and this occurred through pathway 5 (SI maintained). Because all intermediate SC haplotypes are excluded after diversifica-tion, in the short-term, new SI haplotypes coexist in the sys-tem following diversification, but all incomplete haplotype classes then slowly go extinct (see results above). In this case, extinction is only prevented by mutations that result in in-complete haplotype classes becoming in-complete (obtaining all SLF genes in the population).
The effect of completeness on diversification was also observed at higher haplotype numbers. When k¼8;there was no diversification whenn¼1 (the condition for possible diversification forn¼1 isk,7;Appendix A), with the novel
SI haplotype (Skþ1) unable to invade the population (Figure
S6 in File S1). This is in contrast to diversification in the narrow region of self-pollination and inbreeding depression when there are fewer haplotypes (k¼5;cf. Figure 3Aii and Figure S6ii). Yet, similar to whenk¼5;short-term diversifi-cation was observed when the number of complete haplo-types were between 1 andk(Figure 3Aiii and Figure S6iii), and long-term diversification at high self-pollination (a) and inbreeding depression (d) when all haplotypes were com-plete (Figure 3Aiv and Figure S6iv). This suggests that the conditions for diversification are restricted to a narrow region ofaandd, but that this is moreflexible when there are fewer haplotypes (smaller k), as diversification can occur at both low and high levels of completeness. Moreover, completeness will determine if there is long- or short-term coexistence of novel haplotypes in the population. The parameter spaces for diversification for each evolutionary pathway across a broader range of haplotype numbers and levels of complete-ness are outlined in Appendix A–C.
Figure 3 Diversification in the infinite population model. (A) Summary for all pathways 125 as a function of inbreeding depression (d) and proportion of self-pollen (a), when the initial number of SI haplotypes (k) isfive and the level of completeness ranges from zero to k (0#n#k;n= number of complete haplotypes). The bifurcation plots are superimposed plots of Figures S3–S5. Color coding: diversification with long-term increase in the number of SI haplotypes and a loss of the intermediate mutant (green), short-term diversification (light magenta), no diversification due to exclusion of the novel SI haplotypeSkþ1(gray), no diversification because the novel SI haplotypeSkþ1replaces its ancestral SI haplotypeSk(red). Below the thick black line is a parameter region where mutations in the SLFs may lead to a complete SC haplotype classSCk (pathways 224), which results in the fixation of this SC class and a loss of SI from the population. Therefore, diversification is only possible in the region above this line. Long-term stable coexistence after a diversification event is possible only forn¼1 andn¼k(green regions). For 1,n,k;after the invasion ofSkþ1;all incomplete
If the selfing rateaand inbreeding depressiondare con-stant, the SR model of Uyenoyamaet al.(2001) and Gervais et al.(2011) predicts very low numbers of S-alleles. This is because the diversification regions fromktokþ1 S-alleles generally do not overlap, unlesskis small and thus, in most cases, only a single diversification event is possible. Interest-ingly, the diversification regions for the infinite population NSR model are identical to those for the SR model, see Figure 2 in Gervaiset al.(2011). The similarity between the SR and NSR models is because all haplotypes are initially assumed complete (in both SR and NSR models) before the novel female specificity arrives in the population. We show the di-versification regions fork¼329 S-alleles in Figure 3. Mul-tiple diversifications may occur only when the diversification regions overlap (gray color in Figure 3B). For example, gray region I allows diversification fromk¼3 tok¼5 since it is the intersection of the regions fork¼3 andk¼4:Similarly, region II allows diversification fromk¼4 tok¼6;and the narrow gray region III allows diversification fromk¼5 to k¼7:For other parameter combinations, only a single di-versification event is possible in the infinite NSR model. Lim-ited diversification is one of the major drawbacks of the deterministic SR and NSR models. However, demographic stochasticity may be the key to, at least partially, resolving this puzzle since stochasticity very often leads to different dynamics compared to deterministic models.
Stochastic simulations: an introductory example
The deterministic model for infinite population size appears inadequate to explain the generation and maintenance of the large number of haplotypes observed in natural populations. First, for both SR and NSR systems, the deterministic model predicts that the number of SI haplotypes increases by at most two when selfing rate and inbreeding depression are constant (see also Gervais et al.2011). Second, in our deterministic NSR model, diversification often leads to the eventual loss of all incomplete haplotypes. Consequently, we next examine stochastic simulations, which include features such as uncon-strained mutational order and drift. Wefind that stochastic simulations solve some of the problems of the deterministic model in explaining haplotype diversification.
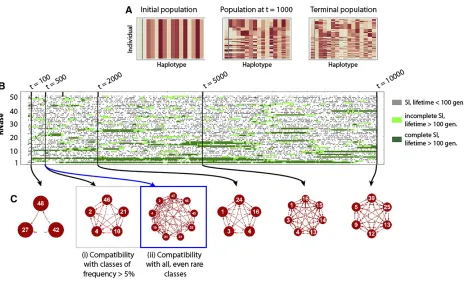
We begin by presenting an introductory example that clarifies the essential concepts and parameters used in the following sections. All simulations begin (t¼0) with a pop-ulation of SC individuals, with the same SRNase class and a random set of SLF genes including the SLF that corresponds to its own SRNase (Figure 4A). In this example, there are 50 possible SRNase haplotype classes. Only SI haplotypes are presented in Figure 4B, and these can be classified into two classes: complete haplotypes with all SLF genes corre-sponding to other SRNase haplotypes in the population, and incomplete SI haplotypes that are missing some SLFs. Simu-lations are run for 10,000 generations, and the dashed line for each SRNase class represents the emergence of that class; gray, short lines are SI haplotypes that have a lifetime of
,100 generations, light green lines are incomplete haplotypes
with a lifespan of.100 generations and dark green complete haplotypes with long lifespan (.100 generations). In Figure 4B the length of the line shows lifespan. Complete haplotypes are generally present at higher frequencies, and have longer lifespans than incomplete ones. Completeness (having a full set of SLF genes) determines mate availability. In this example, at generation 500, haplotype class 4 is complete and can there-fore mate with all other haplotypes (Figure 4Ci and ii). In comparison, haplotype class 21 is incomplete and has reduced mate availability, both when considering higher frequency (.5%; Figure 4Ci) and rare classes (Figure 4Cii).
Stochastic simulations: establishment and the number of SI classes
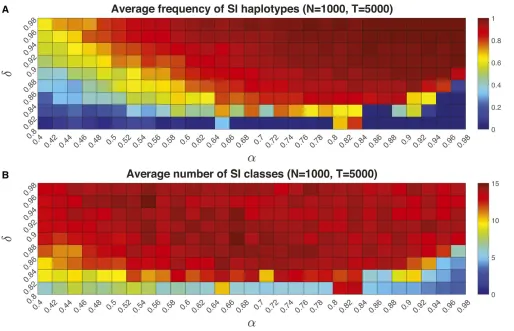
Next, we examine the conditions associated with S-haplotype diversification. The frequency of SI haplotypes was greatest (.75%) at intermediate to high values of self-pollen depo-sition (a¼0:621) and high inbreeding depression (d.0:85) (Figure 5A). Here, the average frequency of SI types in the population was highest (closest to 1) with high values of both self-pollen deposition (a.0:8) and inbreeding de-pression (d.0:86) (Figure 5A). In the parameter space (a.0:4;d.0:82), the average number of SI haplotypes that evolved was 7–14 for population size 1000 (Figure 5B), al-though some of these are rare. Population size influenced the relative frequencies of SI to SC haplotypes, so that the overall relative frequency of SI to SC increased with population size (see the results forN¼200 in File S1).
Stochastic simulations: evolutionary dynamics and the interplay between SI and SC classes
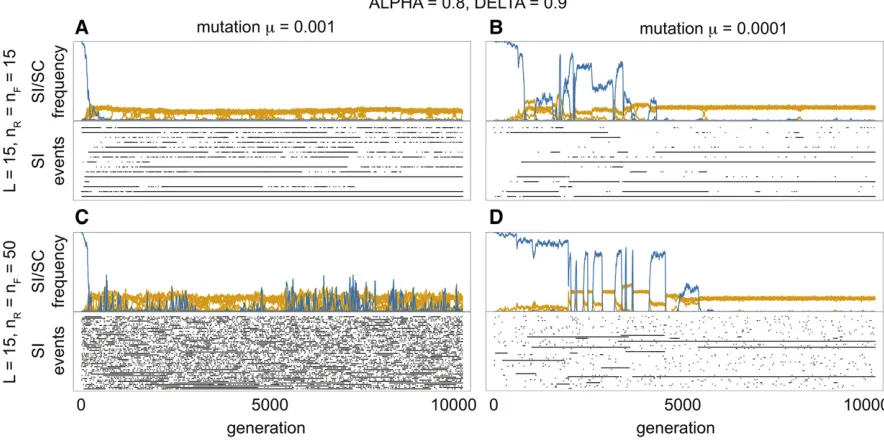
Our model shows the three stages in the evolution of a NSR SI system: the establishment, diversification and stationary phases (Figure 6). During the establishment phase (duration of which is proportional to the mutation rate) the relative frequency of SC haplotypes decreases as these are replaced by SI haplotypes. Once the SI system is established (defined as k¼3), the population enters the diversification stage, which is characterized by an increase in the number of SI classes. Finally, during the stationary phase, SI classes appear and disappear but their long-term average number remains constant. During the stationary phase, there were many cases of equal frequencies of SI classes, but also some low fre-quency SI classes. Recurrence of SC haplotypes was observed for all parameter combinations; however, their frequency and occurrence varied based on the mutation rate (m¼0:001vs. m¼0:0001) and on the number of potential haplotypes (nR¼nF ¼15vs. nR¼nF¼50). Higher mutation rate lead
to a greater frequency of more transient events, whereas for lower mutation rates events were less frequent, but persisted in the population for longer (Figure 6A vs. Figure 6B and Figure 6Cvs. Figure 6D). Moreover, fewer potential haplo-types (nR;nF) resulted in a lower abundance of SC haplotypes
parameter space where SI invades (see Figure 5). Yet, the frequency of SI types was greater for the parameter space where new SI haplotypes are more likely to invade. Equal frequencies of the most common SI classes were apparent in the stationary phase, and this was most consistent for lower mutation rates (Figure 6, B and D). Low frequency SI haplotype classes were, however, also present at sufficient numbers leading to the occasional replacement of the most common SI classes by the low frequency SI classes.
To track SI haplotypes (ignoring SC haplotypes), we recorded thefirst occurrence of a given class (Figure 6) that may have arisen from either a SC or SI haplotype (see Figure 2). Each line (row) therefore shows an event that begins with the occurrence of a novel SI haplotype and ends with the extinction of the last SI haplotype from that class; the length of the line is therefore the lifespan of the haplotype class. Short events occur when the haplotype class is lost due to demographic stochasticity, while the long events represent haplotype classes that reach sufficient frequency and are maintained in the population. There were many more short than long events, and the lifespan of SI haplotype classes
varied in relation to mutation rate and potential haplotype number. Higher mutation rates led to a greater proportion of short events (Figure 6, A and C). Moreover, for a given mu-tation rate, there was higher turnover and less stability of the SI classes when there were more potential haplotypes (nR¼nF ¼50;Figure 6, A and C). Consequently, the highest
turnover of SI classes occurred at higher mutation rates and numbers of potential haplotypes (Figure 6C), compared to the longer lifespans and less turnover observed for lower mu-tation rates and number of potential haplotypes (Figure 6B).
Stochastic simulations: most likely evolutionary pathways for SI haplotypes with long lifespans
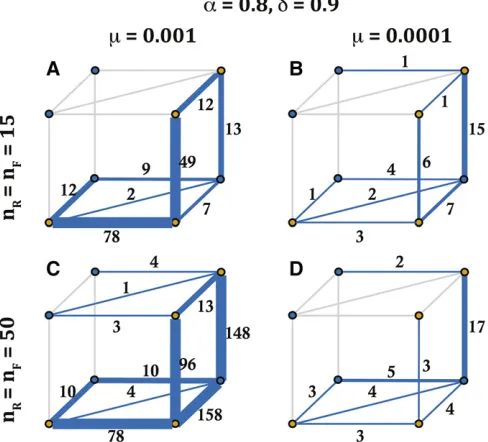
We now examine how the evolutionary pathway of long lifespan SI haplotypes depends on mutation rate (m) and potential haplotype numbers (nR¼nF). Both mutation rate
and potential haplotype number influenced the likelihood of each pathway for SI haplotypes with a lifespan of .100 generations. High mutation rate (m¼0:001) and a lower number of possible haplotypes (nR¼nF¼15) favored the
pathway that maintains SI (Figure 7A). Yet, with a greater Figure 4 An example of the evolutionary dynamics of the model used for the stochastic simulations with N¼1000 individuals,nR¼nF¼50;
number of possible haplotypes (nR¼nF¼50), a higher
mu-tation rate resulted in high transition likelihoods for both pathway 4 with a SC intermediate, and for pathway 5 that maintains SI (Figure 7C). In comparison, for lower mutation rates (m¼0:0001), we observed a larger number of transi-tions through the pathway with an SC intermediate (pathway 4), and this was more consistent for different potential hap-lotype numbers (Figure 7, B and D). Furthermore, and aligned with our predictions on the unlikeliness of pathways 1 and 2 (they require a simultaneous loss and gain of two specific SLFs), we do not observe these pathways in our sim-ulations (see above for more discussion on pathway 1).
The effect of completeness: Complete haplotypes with no missing SLF genes had the longest lifespan and maintained the highest maximal frequencies compared to haplotypes missing between two and four SLF genes (minimal completeness deficit between two and four; Figure 8). In comparison, missing only one SLF gene had a smaller effect on lifespan and frequency. All completeness deficits were represented in the short lifespan and low frequency classes. However, the complete haplotypes, or those missing only one SLF gene, had the longest lifespans (.100 generations) and highest (.0:1) frequencies (Figure
8). We provide further illustration of the importance of com-pleteness for haplotype lifespan in Figure S2 of File S1. In this example, we present a single representative SI class and its completeness deficit throughout its lifetime, showing that ex-tinction of an SI class is associated with the loss of completeness.
Discussion
Then, we relate our results to previous models and exam-ine how they extend our current understanding of novel S-haplotype evolution in NSR systems. We conclude by dis-cussing future directions for theoretical models, and how these, when combined with genomic data, can provide insight into the evolution of diversity in NSR systems.
Evolutionary pathways for diversification: self-pollination, inbreeding depression and haplotype number
Self-pollination and inbreeding depression influenced diver-sification outcomes: yet this varied for the different evolu-tionary pathways and with different levels of completeness and haplotype number. Wefirst discuss how these parameters in-fluence diversification for each pathway and then discuss the interaction between selfing rate and inbreeding depression.
First mutation in the female-specificity with a SC intermediate:Diversification was unlikely through a pathway
where thefirst mutation happens in the SRNase resulting in an intermediate SC haplotype (pathway 1); this pathway is identical to the path presented in Uyenoyamaet al.(2001) and Gervaiset al.(2011). Although this pathway is, in prin-ciple, possible (see Figure 3), it is unlikely to contribute to the observed diversity because, when comparing all pathways simultaneously, this parameter region overlaps with the re-gion where SI is lost from the population via alternative path-ways (region below the thick line in Figure 3). Furthermore,
this pathway is not observed in the simulations. The discrep-ancy between our model results likely originates from differ-ences in the order of mutations between the two theoretical approaches. In contrast to the analytical model, where diversifi-cation through a pathway occurs in a set sequence, the order of mutations is random in simulations. This means that, like Gervais et al. (2011), pathway one was not observed in our simulation results because either an SLF or SRNase mutation can occur first resulting in the loss of the SI system. Conse-quently, although theoretically possible, pathway 1 can only oc-cur under the restricted conditions observed in the deterministic model and is unlikely to contribute to long-term diversification.
First mutation in the male-specificity with a SC intermediate:Haplotype number influences the strength of
diversification, and this occurs at lower inbreeding depres-sion. Consequently, there is generally no overlap in the pa-rameter space for diversification for different numbers of haplotypes initially present in the population. Thus, surpris-ingly, even though in principle the number of S-haplotypes can increase to infinity in our analytical infinite population model, the number of haplotypes increases by at most two for anyfixed level of inbreeding depression and self-pollination. However, in nature, variation in selfing rate and inbreeding depression may facilitate traversing nonoverlapping param-eter spaces. An equivalent result was found for SR systems in Gervaiset al.(2011), indicating the importance of frequency-dependent selection for evolutionary outcomes. This has in-teresting implications for considering the application of these models to empirical data on the distribution and number of S-haplotypes (seeDiscussionbelow). For example, small pop-ulations with fewer S alleles may provide the conditions that promote diversification in a metapopulation.
First mutation in the female-specificity with a SI intermediate: In contrast to the above pathways where versification was unlikely for higher haplotype numbers, di-versification for a pathway where SI is maintained (pathway 5; Figure 3) is possible for any initial haplotype number.
Moreover, since all haplotypes outcross, this pathway has nofitness costs associated with self-pollination and inbreed-ing depression. This implies that, in principle, multiple con-secutive diversification events are possible for this pathway for any level of inbreeding depression and self pollination. However, in our deterministic model the diversification was only short term as all incomplete SI haplotypes slowly go extinct.
Purging of deleterious alleles: Theory predicts a negative relationship between inbreeding depression and selfing rate, such that the purging of deleterious recessive alleles through selfing reduces inbreeding depression (Lande and Schemske 1985). However, the combination of high inbreeding depres-sion and selfing rate is not unrealistic, given that studies have found inbreeding depression in populations and species with high self-fertilization rates (Byers and Waller 1999; Winn et al.2011). Moreover, Gervaiset al.(2014) found that purg-ing had little effect on the spread of SC individuals if most deleterious alleles had weakfitness effects. In our study, the combination of self-pollination and inbreeding depression where diversification was observed varied with evolutionary pathway, indicating the potential for different conditions to favor diversification through alternative pathways. In our model, inbreeding depression wasfixed through time (i.e., purging was not considered), even though its strength may vary with population size (Bataillon and Kirkpatrick 2000) and the degree of biparental inbreeding (Porcher and Lande 2016). Sheltered genetic load may also influence the dynam-ics of deleterious alleles and inbreeding depression (Porcher and Lande 2005; Llaurenset al.2009), although this is more likely to be important for sporophytic SI systems with domi-nance hierarchies among alleles (Llaurens et al.2009). By considering the importance of dynamic inbreeding and ge-netic linkage, future models could further examine how these apply to the evolution of novel S-haplotypes in an NSR SI system.
Evolutionary pathways for diversification: the effect of completeness
The relative importance of completeness for diversification may vary for self-vs. NSR systems. Studying an SR model, Sakai (2016) found that an incomplete SI system was essen-tial for diversification, and that this occurred during the ini-tial evolution of the SI system. Here the pollen genes (male component) for a given specificity were not fully rejected by the female-determining genes for that specificity: leading to incomplete rejection following the matching of SI haplotypes. In this model of diversification, S alleles evolve before the species split and then are maintained in different species after diversification (Sakai 2016). In our model, incompleteness (missing SLF genes related to SRNases in the population) reduces mate availability andfitness. One of the key results of this study on NSR SI is the importance of completeness for long-term diversification. Long-term diversification was ob-served only when one haplotype is complete (n¼1) or all Figure 7 The likelihood of transitions along different evolutionary
haplotypes are complete (n¼k). For all other completeness levels only short-term diversification is possible because in-complete haplotypes slowly go extinct unless rescued by mu-tations that restore completeness (a full set of SLFs). This is analogous to evolutionary rescue (Gomulkiewicz and Holt 1995; Gonzalez et al. 2013), where mutation can prevent extinction, enabling the haplotype to persist in the popula-tion. Our simulation data also show the potential importance of completeness for haplotype lifespan and turnover. Given that mate availability scales with completeness deficit, in-complete haplotypes with more missing SLFs are likely to be selected against, reducing their lifespan and contribution to long-term diversification outcomes.
Completeness and the pathway that maintains SI: Our results also raise a number of questions about diversification via the pathway that maintains SI (pathway 5). Diversification is not possible for this pathway when the number of complete haplotypes is zero or one (i.e.,n¼0 or 1). When the number of complete haplotypes is.1 diversification is possible, but only if all incomplete haplotypes rapidly become complete, otherwise they go extinct. This challenges the feasibility of the evolutionary pathway for diversification proposed by Fujiiet al.(2016). Yet, when we considerfinite populations we do see diversification through this pathway. This implies that conditions in the simulations such as a random order of mutation events, higher mutation rates, finite population size, and having a moreflexible SLF template (i.e., more SLFs to begin with) may facilitate diversification through this pathway. In conclusion, comparing the results of our deter-ministic and stochastic models highlights the potential im-portance of completeness for long-term diversification in
the NSR SI system. These results, however, are based on the assumption of global dispersal of pollen. It is possible that the importance of incompleteness may decrease if pollen has a limited range, as this may reduce the effects of missing SLFs on mate availability. Future models that extend our results to nonglobal dispersal may therefore assist our understanding of the role of incompleteness in S-haplotype diversification.
Congruence of theoretical models and empirical data: estimates of haplotype number
The extremely high level of S-haplotype diversity observed in natural populations is well established (Lawrence 2000; Castric and Vekemans 2004), raising interesting questions about the congruence of theoretical models with empirical data. The number of S-haplotypes derived from our model (k¼7214;for population size 1000) were far fewer than the diversity commonly observed in natural populations of species with SR and NSR SI (20–40 SI haplotypes; Lawrence (2000)). These results are similar to the simulation results of Gervaiset al.(2011) who found that diversification peaked at between 7 and 18 alleles. It has been suggested that pop-ulation structure may provide the conditions for diversifica-tion (Uyenoyamaet al.2001; Gervaiset al.2011). Incomplete reproductive barriers and hybridization among species may also create the population structure required to enhance diversification (Castric et al. 2008). In this case, novel S-haplotypes may evolve in separate species, which are then exchanged among species via introgression. These novel S alleles may spread through the population once they are decoupled from the hybrid genetic background. These ideas are intriguing given the transpecific nature of S alleles and the maintenance of SI during speciation (Igic et al.2004). Further models that include population structure, as well as introgression, are therefore required to assess the potential importance of this for diversification at the S locus. The total number of S-haplotypes predicted by Sakai (2016) was higher (40–50 alleles), and more in line with population estimates. The mechanism of diversification in this model, however, suggests that novel S alleles evolve during the ini-tial evolution of the SI system from self-compatibility. It is also based on a SR SI, and involves variation in the strength of the incompatibility reaction, suggesting that the mecha-nism may be less applicable to S-haplotype diversification in NSR systems.
There are a number of assumptions required to simplify the inherent complexities of modeling the evolution of new S-haplotypes in NSR systems. These assumptions may have contributed to the lower haplotype estimates compared to that observed in natural populations. Wefirst assume that there is no recombination within the S-locus. However, Kubo et al. (2015) provide evidence of genetic exchange at the S-locus for petunia, and suggest that SLFs may be shared among S-haplotypes via this process. Inclusion of genetic exchange may therefore facilitate novel S-haplotype evolution, as sug-gested by Fujiiet al.(2016), who found that this had a im-portant role in evolution of novel S-haplotypes in their NSR Figure 8 SI haplotype lifespan (A) and highest frequency of a class over
its lifespan (B) in relation to its minimal completeness deficit. The light/ dark colors represent short/long events (lifetime greater/shorter than 100 generations). Completeness deficit is a measure of how many SLF genes a haplotype is missing that relate to potential mating partners in the population. Minimal completeness refers to the minimum through all haplotypes in that SI class over the entire lifespan. This measure is there-fore related to mate availability so that a minimal completeness deficit of 0 is when the haplotype has the full set of SLF genes that are able to detoxify all potential SRNases in the population (i.e., maximum mate availability); a minimal completeness deficit of 1 implies that the haplo-type is missing one SLF associated with an SRNase in the population and is therefore unable to mate with individuals with this SRNase. Conse-quently, the higher the minimal completeness deficit, the lower the mate availability for that haplotype. Simulations were run with the following parameter values: N¼1000; nR¼nF¼15; L¼15; mr¼mF¼0:001;
model. Second, in our model, we assume a one-to-one re-lationship between each SLF and SRNase. Yet recent evi-dence of SRNase recognition by multiple SLFs in the collaborative NSR system of petunia Kuboet al.(2015) sug-gests the need for integrating these dynamics into models of novel S allele evolution in NSR systems. Consequently, exten-sion of our model to include a collaborative network with redundant SRNase recognition by multiple SLFs may facili-tate the evolution of novel S-haplotypes. Finally, we assume equal mutation rates for male- and female-determining ponents of the S locus. Given the larger size of the SLF com-pared to SRNase genomic region, and some evidence of greater variation and turnover of SLFs (Kuboet al. 2015), the potential influence of higher mutation rates for SLF genes could be tested. Consequently, extending our model to in-clude genetic exchange, the collaborative nature of the NSR system, unequal crossing over and variation in mutation rates for male- and female-determining components may result in different evolutionary outcomes and equilibrium number of S-haplotypes.
Haplotype lifespan and frequency: mate availability and negative frequency-dependence
The interaction between haplotype completeness and mate availability can influence the lifespan and frequency of novel SI haplotypes. In the NSR SI system modeled here, mate availability is inversely related to the deficit in SLF genes (minimal completeness deficit), so that complete haplotypes, with no missing SLFs, have the highest mate availability and are able to mate with all other haplotypes in the population. Our results of longer lifespan and high frequency for complete haplotypes (minimal completeness deficit of zero), reflects its importance to mate availability andfitness. Interestingly, and in contrast to our infinite population model, the moderate to high longevity and frequency of haplotypes missing one SLF (minimal completeness deficit of one) suggests that these haplotypes can still maintain highfitness. The deficit in SLF genes may also affect the strength of NFDS, so that NFDS weakens when there are fewer mating partners. This may contribute to the stochastic loss of haplotypes with a greater deficit in SLF genes, which is reflected in their shorter lifespans and lower frequencies. Taken together, these results highlight the importance of NFDS and suggest that both evolutionary pathway and mate availability contribute to the outcomes and success of novel SI haplotypes. It would be interesting to see if these results are still apparent with extensions to the model to include local pollen dispersal, since this may lessen restric-tions in mate availability.
Conclusions
Our model demonstrates that novel S-haplotypes can evolve across a range of parameter values (inbreeding depression and self-pollination), but that this varies with evolutionary pathway. This result generates intriguing questions about the role of SC intermediates in S-allele diversification and how different conditions may favor alternative pathways. For
example, when considering empirical data, does the presence of low frequency SC individuals in populations (Raduskiet al. 2012) represent points in the diversification process? This also raises questions regarding the viability of SC individuals as intermediates for the evolution of new specificities under different models of inbreeding depression. Extensions of this model to include population structure may also help to rec-oncile differences between theoretical models and the number of alleles commonly observed in plant populations. Combining genomic data with model predictions could provide insight into the evolutionary dynamics of NSR SI. For example, vari-ation among individuals in SLF gene position and copy number may provide information on recombination frequency and gene duplication events (see Kuboet al. (2015)); while the distribution of mutations within SLF genes may indicate the steps required to produce a novel SLF during allelic diversifi-cation. Indeed, previous studies have provided some estimates of the number of mutations required to alter S-allele specific-ities (Mattonet al.1999; Chookajornet al.2004), but given differences in the molecular mechanism and variation in size of the female- and male-determining components, this may vary with SI system. Combining theoretical models with data on the genomic structure of the SLF region will therefore improve our understanding of haplotype diversification for NSR SI: provid-ing a fascinatprovid-ing example of the evolutionary dynamics in-volved in genetically based recognition systems.
Acknowledgments
We thank Deborah Charlesworth and three anonymous re-viewers for helpful comments on the manuscript. We also thank Vincenzo Natali for his influential movie The Cube that was a great source of inspiration. Here, the characters move through cube-shaped rooms with various death traps, as do the S-alleles in our work, which seem to be searching for a successful escape route through a sequence of mutational cubes, facing the self-compatibility and incompleteness traps. The research leading to these results has received funding from the European Union’s Seventh Framework Programme (FP7/2007-2013) under grant agreement number 329960, European Research Council (ERC) research agreement number 250152 and Research Executive Agency (REA) grant agreement number 291734.
Literature Cited
Bataillon, T., and M. Kirkpatrick, 2000 Inbreeding depression due to mildly deleterious mutations infinite populations: size does matter. Genet. Res. 75: 75–81.
Byers, D., and D. Waller, 1999 Do plant populations purge their genetic load? effects of population size and mating history on inbreeding depression. Annu. Rev. Ecol. Syst. 30: 479–513. Castric, V., and X. Vekemans, 2004 Plant self-incompatibility in
natural populations: a critical assessment of recent theoretical and empirical advances. Mol. Ecol. 13: 2873–2889.