Abstract
ORNAN, RACHELLE NITZANNE. The Influence of Reference-Mark Density and Saliency on Time-To-Passage. (Under the direction of Dr. Donald H. Mershon.)
The Influence of Reference-Mark Density and Saliency on Time-To-Passage
by
Rachelle Nitzanne Ornan
A dissertation submitted to the Graduate Faculty of North Carolina State University
in partial fulfillment of the requirements for the Degree of
Doctor of Philosophy
Psychology
Raleigh, North Carolina
2008
APPROVED BY:
Dr. Katherine Klein Dr. Denis Gray
Dr. Chris Mayhorn Dr. Donald Mershon
ii Biography
I was born June 2, 1974 in Lynchburg, VA. I enjoyed a rich and varied childhood filled with
physical, musical, artistic and cerebral activities. I attended Brandeis University from
1992-1996, and majored in neuroscience. Following graduation, I moved to New York City to
pursue my interest in design. I attended the Pratt Institute, where I spent many a sleepless
night in the studio studying industrial design fundamentals, while supporting myself by
waitressing, working odd temp jobs, and eventually working at Estee Lauder headquarters in
the packaging design department. Following two years in New York, I relocated to Raleigh,
North Carolina to complete a Master’s degree in Human Factors Psychology in 2001 under
the direction of Dr. Donald Mershon, a Master’s in industrial design in 2004 under the
direction of Professor Haig Khachatoorian, and finally, a PhD in Human Factors and
Experimental Psychology in 2008. Along the way, I had a variety of practical work
experiences: at NASA Langley Research Center designing a space hotel concept for
low-Earth orbit; at the Johnson Space Center investigating the causes and potential design
solutions to excess stowage on the International Space Station; and as a freelance
designer/human factors professional in the Research Triangle area. Currently, I work at the
Payloads Concept Center at the Boeing Company, where I use my design and human factors
skills to create more productive, functional, aesthetically-pleasing, cabin interiors for
iii
Acknowledgements
This dissertation is the product of the great support and encouragement I’ve received from a
lifetime of academic advisors: influential teachers from my youth in Lynchburg, VA;
members of the Graybiel Lab at Brandeis University; friends and advisors at NASA; my
committee members; and my advisor, Dr. Mershon, my friend, mentor, fearless editor, who
has steadfastly supported my efforts to combine the two disciplines of design and
psychology. I also thank friends, family, and in-laws, who have always expressed great
interest in my academic pursuits. I thank my parents, Emmanuel and Sonja, for stressing the
importance of earning an education. Thank you to my dedicated friend, Philip, who
programmed this dissertation experiment in exchange for a stained glass window, still
forthcoming. Finally, I thank my husband, Wilson (who, until this very moment, has never
known me to be anything other than a student). He has shown great patience and support for
my academic career and professional goals, and has been a good sport throughout the
iv
Table of Contents
List of Tables ... vi
List of Figures ... vii
Introduction...1
The Shuttle Canadarm or SRMS... 2
ISS robotic workstations... 4
Errors involving visual displays in space... 4
Space vision research over the past 50 years ... 7
One eye or two? VR or flat? ... 8
Grids and reference-marks—the best solution?... 10
Physiological factors in depth perception ... 12
Gogel and McNulty, the seminal article ... 14
Measurement of perceived velocity... 17
Time–To-Passage... 19
Measuring TTP ... 20
Variables affecting perceived velocity and TTP... 24
Sex differences... 27
Method…… ...28
Power and sample size calculations... 28
Participants... 30
Apparatus ... 31
Experimental variables and design ... 31
Calibration... 35
Dependent variables... 36
Procedure ... 38
Experiment 1 – Replication of Gogel & McNulty’s study ... 39
Experiment 2 - Offset and color... 41
Experiment 3 – Size and horizontal extent ... 44
Experiment 4 –Reference-mark saliency and object shape ... 46
Data checks and manipulations... 49
Results and discussion ...52
Experiment 1- Comparison with Gogel & McNulty... 52
PercentTTP ... 56
Experiment 1 hypothesis summary... 62
Experiment 2 percentTTP ... 62
Experiment 2 hypothesis summary... 64
v
Experiment 3 hypothesis summary... 69
Experiment 4 percentTTP ... 69
Experiment 4 hypothesis summary... 73
General discussion ...74
Conclusions...85
Limitations ... 85
Future directions ... 88
References…...90
Appendix A: TotTTP results and discussion ...97
Experiment 1... 98
Experiment 2... 103
Experiment 3... 105
Experiment 4... 109
Appendix B: ANOVA and post-hoc comparison tables ...117
Appendix C: Experimenter instructions...137
Appendix D: Informed consent form and data sheet ...149
vi
List of Tables
Table 1. Power table for Experiment 1 ...29
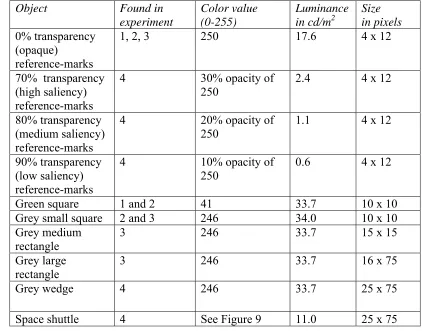
Table 2. Object colors, sizes and luminance values for all experiments...32
Table 1B. Experiment 1 totTTP ANOVA Table...118
Table 2B. Experiment 1 totTTP significant post hoc results. ...119
Table 2B (cont)....120
Table 3B. Experiment 1 percentTTP ANOVA results...121
Table 5B. Experiment 2 totTTP ANOVA results. ...123
Table 6B. Experiment 2 totTTP significant post-hoc results. ...124
Table 7B. Experiment 2 percentTTP ANOVA results...125
Table 8B. Experiment 2 percentTTP significant post-hoc results...126
Table 9B. Experiment 3 totTTP ANOVA results. ...127
Table 10B. Experiment 3 totTTP significant post-hoc results. ...128
Table 11B. Experiment 3 percentTTP ANOVA results...129
Table 12B. Experiment 3 percentTTP significant post-hoc results...130
Table 13B. Experiment 4 totTTP ANOVA results. ...131
Table 13B (cont.)....132
Table 14B. Experiment 4 totTTP significant post-hoc results. ...133
Table 15B. Experiment 4 percentTTP ANOVA results...134
Table 15B (cont.)....135
vii
List of Figures
Figure 1. “The Canadarm’s mechanical parts.” ...3
Figure 2. “The Warrior vision system of flat panel displays from Interstate Electronics Corp. will be integrated into the robotic workstations aboard ISS.” ...4
Figure 3. A photo of the Crew Optical Alignment Sight (COAS) graphical overlay. ...11
Figure 4. A camera view taken from the Progress 14 spacecraft approaching the ISS...11
Figure 5. Experimental display...33
Figure 6. Experiment 1 trial combinations...40
Figure 7. Experiment 2 trial combinations...43
Figure 8. Experiment 3 trial combinations...45
Figure 9. Shuttle image used for Experiment 4...47
Figure 10. Trial combinations for Experiment 4...48
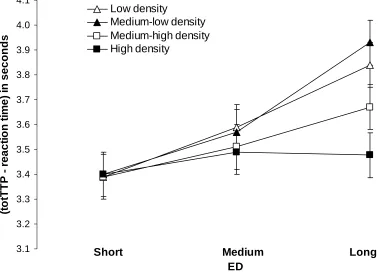
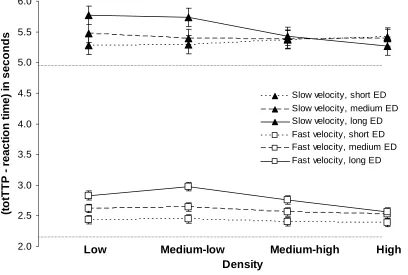
Figure 11. Experiment 1 (totTTP- reaction time) in seconds plotted as a function of ED and density...55
Figure 12. Experiment 1 percentTTP as a function of velocity, ED and density level...56
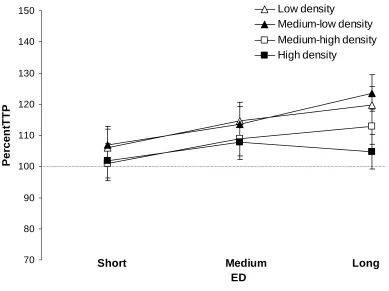
Figure 13. Experiment 1 percentTTP as a function of ED and density...57
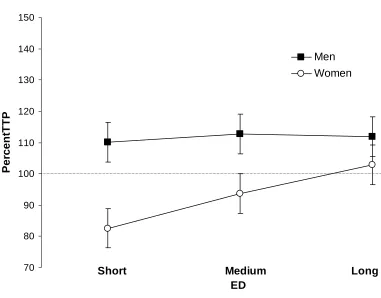
Figure 14. Experiment 1 percentTTP as a function of sex and ED...61
Figure 15. Experiment 2 percentTTP as a function of ED and density...62
Figure 16. Experiment 2 percentTTP as a function of ED and sex. ...64
Figure 17. Experiment 3 percentTTP as a function of ED and density level. ...66
Figure 18. Experiment 3 percentTTP as a function of ED and sex, collapsed across object size. ...67
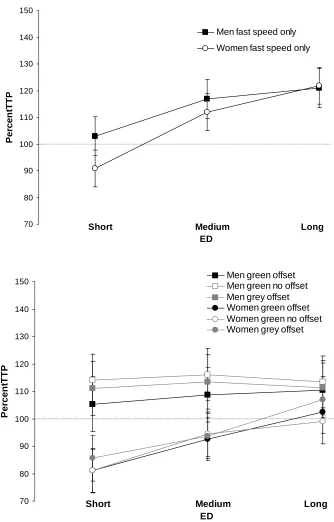
Figure 19. Experiment 3 (top) and 4 (bottom) percent TTP as a function of ED, object characteristics and sex...70
Figure 20. Experiment 3 (top) and 4 (bottom) percentTTP as a function of ED and sex...72
Figure 21. Experiment 1 (top) and 2 (bottom) percentTTP as a function of sex and ED...75
Figure 23. PercentTTP increase in accuracy between low and high-density reference-marks according to experiment, variable type, and level. ...78
viii
Figure 1A. (TotTTP – reaction time) in seconds as a function of ED and density level for all
four experiments. ...99
Figure 2A. Experiment 1 (totTTP- reaction time) in seconds plotted as a function of ED and
density...100
Figure 3A. Experiment 3 (totTTP-reaction time) in seconds as a function of ED, velocity,
and density. ...101
Figure 4A. Experiment 2 (totTTP-reaction time) in seconds as a function of ED and density.103 Figure 5A. Experiment 3 (totTTP – reaction time) in seconds as a function of ED and object
size....106 Figure 6A. Experiment 3 (totTTP – reaction time) in seconds as a function of ED and
density...108
Figure 7A. Experiments 1, 2, and 3 (in order from top to bottom, totTTP-reaction time) in
seconds as a function of ED...110
Figure 8A. Experiment 4 (totTTP – reaction time) in seconds as a function of density and
ED. ...111
Figure 9A. Experiments 1-4 (totTTP-reaction time) in seconds as a function of sex and ED
across all four experiments. ...112
Introduction
The International Space Station (ISS) has been built one module at a time by visiting
crews, representing the European Space Agency (ESA), Japanese Space Agency, National
Aeronautics and Space Administration (NASA), Russian Space Agency and the Canadian
Space Agency. Its construction began in 1998, when the first module was launched on a
Russian Proton rocket. Subsequent assembly has been conducted by Shuttle servicing
missions. Construction was abruptly halted February 1, 2003, when the Space Shuttle
Columbia tragically broke apart over Texas upon re-entry. Construction was slated to
continue in July 2005 with the first Shuttle launch, since the accident. However, mounted
cameras on the Shuttle showed that on the July flight, foam again broke off the external tank
and continues to pose a threat. Additional structure and modules to the ISS have since been
launched into orbit, using the Shuttle payload bay, including several truss segments and solar
arrays, and in 2008, the European Space Agency’s Columbus laboratory module, and the
Japanese Space Agency’s laboratory, Kibo scheduled for May.
A considerable amount of research effort has been spent on designing the
human-machine interface of the robotic systems used in assembling the ISS. Though sophisticated,
the operation of these robotic systems is visually, spatially and cognitively challenging.
Astronauts rely upon a few camera displays, while aligning and assembling external modules
and equipment. In addition to the limited displays, there are many other factors which
2
software that mimics the lighting conditions they will experience on orbit during the task. If
the timing is not perfect, the usually well-illuminated work area can quickly turn into an
eye-searing, highly-reflective environment, when the Sun rises on orbit (which occurs
approximately every 90 minutes). Thus, there is a time-sensitive element of the task, which
can cause significant work stress. Similarly challenging, the background structure on the
displays changes as the astronauts toggle between the various camera views. Conversely,
views from certain cameras at certain angles will appear identical, if the supporting ISS truss
structure is the backdrop. The cost of an error in judgment is significant: astronauts guide
masses of 100,000 kg or more during assembly tasks, and if misguided, these loads can cause
significant damage to surrounding structures or risk crew lives.
The Shuttle Canadarm or SRMS
Each Space Shuttle is equipped with a remote grappling arm in its payload bay called
the Shuttle Remote Manipulator System (SRMS or “Canadarm”), which assists with satellite
capture and holds equipment for repair and assembly. The fully-extended arm measures
15 meters and has an upper and lower boom separated by a “shoulder” joint allowing pitch
and yaw. The arm also has an “elbow” joint capable of conducting pitch movements and a
“wrist” joint which can pitch, yaw and roll. In combination, these joints provide a grand total
of six degrees of freedom (Currie & Peacock, 2002). The operator uses the Robotic
Workstation (RWS) located in the flight deck to control its movement. Two cameras are
mounted on the arm, one located at the wrist joint and one at the elbow (Figure 1) and these
3
It is possible to obtain direct viewing of the arm through the windows, facing the
payload bay in the Shuttle flight deck. The astronaut manipulates the joystick to send the
intended motion-path information to the arm. The onboard control system automatically
translates the command, breaks down the motion, and sends messages to the individual
joints. The automated system can be switched-off and each joint can be operated
individually, if required.
Figure 1. “The Canadarm’s mechanical parts.”
Retrieved February 12, 2008 from Institute of Electrical and Electronics Engineers, Inc. of Canada website:
4
Figure 2. “The Warrior vision system of flat panel displays from Interstate Electronics
Corp. will be integrated into the robotic workstations aboard ISS.”
Retrieved February 12, 2008 from Society for Automotive Engineers website:
http://www.sae.org/aeromag/features/spacestation/.
ISS robotic workstations
The Robotic Workstations on the ISS have two hand controllers and four monitor
displays (21.1 x 15.9 cm), which can be toggled between various cameras on the arm or the
Mobile Base System (G. Lewis, personal communication, May 15, 2005). When the ISS is
completed, there will be a total of 14 cameras located on the exterior, which will interface
with the Robotic Workstation technology.
Errors involving visual displays in space
When the Shuttle fleet was grounded in February 2003, after the re-entry breakup of
Space Shuttle Columbia, visiting vehicles such as the Russian Soyuz and Progress were used
for resupplying the International Space Station with fresh crew and supplies. Both vehicles
are equipped with an automated docking system called KURS. A manual override system
(called TORU) is present on the ISS, if the KURS should fail. Crewmembers have assumed
5
June 2005). In October 2004, Cosmonaut Sharipov assumed control over the docking of the
Soyuz from inside the vehicle. Visually-guided manual overrides occur with enough
frequency to merit significant pre-mission practicing of the task by crewmembers. The
success of the docking requires good coordination, when juggling the lag-time produced by
the interaction between the KURS and the TORU systems, and most importantly, requires
the ability to judge approach velocities with accuracy.
TORU consists of a raised seat for the astronaut commander and two joysticks: one to
control rotational directions of pitch, yaw and roll of the approaching vehicle, and the other,
translational movements of left and right. A lever located near the right joystick, and
operated by the pinky finger, controls the braking/thrusting of the Progress vehicle on
approach. A black-and-white video screen is positioned, before the operator, and provides a
Progress-eye view of the approach towards the ISS. Superimposed on the relatively small
video display are tick marks and hatches, various numbers indicating collapse rates and
distances to the docking vehicle. The display can be toggled between the external
Progress-mounted camera, and the ISS-Progress-mounted camera, which shows the Progress vehicle’s approach
in the z-direction. Superimposed on the Progress’ TORU display is vehicle velocity
information, along with other graphical overlays intended to aid performance. At this time,
there are no cameras on the ISS, which show side or oblique views of the two docking craft,
although in the future it is likely that one of the final 14 cameras will be able to capture this
6
The most serious accident involving the manual override TORU system occurred
March 4, 1997, when an approaching Progress vehicle was hidden from view behind Mir’s
solar arrays during the final sequence of the operation. Although the monitor appeared to
show a normal approach velocity, when the Progress emerged from behind the solar array,
the US crewmember Mike Foale directly determined that the approach was, in fact,
dangerously fast. He was unable to stop the Progress and it crashed into Mir, creating a loss
of pressure, risking both crew safety and space station integrity (Burroughs, 1998). Perhaps,
if it had been easier to discern the time-to-contact, the actual distance to the Russian Progress
vehicle and/or its approach velocity, the collision that March might never have occurred.
Most likely, some previously-identified organizational factors for the perception of velocity
and motion-in-depth contributed to the errors in judgment. By understanding how these
factors affect operator perception of motion/velocity on video displays, or by direct viewing,
it may be possible to avert similar accidents in the future.
NASA officials and contractors are currently working on a new spaceship design for
Orion, the Crew Expolaration Vehicle, which is to replace the current Space Shuttle in 2014.
The capsule will be designed to accommodate voyages to the ISS, the Moon, and quite
possibly Mars. Preliminary designs show the potential for adding new modules on-orbit to
support a longer-duration mission (Hancock, 2005). Assuming that astronauts and
space-construction workers will continue to perform docking and assembly tasks in the future,
further understanding of which display features, camera angles, and graphical aids promote
7
Space vision research over the past 50 years
Vision in space has always been a key area of research for NASA and its related
contractors. An overview of such research reveals that a large number of studies, conducted
during the Apollo era, investigated basic questions surrounding how vision changes in
weightlessness, on launch with high levels of acceleration and vibration, how performance of
visually-guided tasks in space such as rendezvous and docking can be improved (Vanderplas,
1963), and how to create realistic-looking displays for training purposes on Earth and
on-orbit (Kincade et al., 1963; Grether, 1963). Thanks to experiments with military aircraft, by
the 1950s, a great deal of information was already known about effects of high g-force and
vibration on vision and the effects of such changes on display visibility. Later, during the
early Gemini missions, astronauts provided subjective descriptions of Earth objects viewed
through a camera with magnification, and conducted several visual-acuity experiments
(White, 1963). The notorious discovery of space motion sickness, which affects the majority
of novice astronauts, did not occur before the days of Apollo, when the larger cabins allowed
astronauts to move about more freely.
Research conducted during the 1950s at Wright Patterson Air Force Base also
examined the trade-off between target contrast and threshold distance for target detection on
orbit, and identified that distance judgments in space are very inaccurate. When targets are
seen in a homogeneous environment or viewed in a field within which objects are located at a
significant distance, target distance will be severely underestimated (Grether, 1963; Baker
8
monocular distance cue of linear perspective. Another explanation for this target
underestimation is the Specific Distance Tendency, defined by Gogel, as the tendency for an
object to appear at an intermediate distance, especially if it is presented in a reduced cue
environment (Gogel, 1972).
Today, much of space-vision research is display-centered, and has progressed beyond
research dealing with basic physiological changes of the visual system. A host of government
teleoperation projects and commercial spin-offs exist, because of this advanced vision
research: remote operation of the Mars Rover missions of 2003; remote surgical applications
for use on long-duration spaceflight; and the joint DARPA/NASA Robonaut project; a
robotic helper operated by a stereoscopic head-mounted display worn by a distant operator.
Robonaut has yet to fly in space, but it is designed to lend a helping hand to astronauts
performing extravehicular activity (EVA), by handing them tools and equipment as needed.
Dextre (pronounced ‘Dexter’), a multi-armed Canadian Space Agency robot, was installed on
the ISS in March 2008 to aid in future construction tasks.
One eye or two? VR or flat?
Research has produced mixed results concerning the benefits of 2D or 3D displays for
use in complex spatial tasks. Operators claim more confidence when using 3D displays,
though their performance while using 3D displays, has yet to exceed their performance using
2D displays (Gaillard, 1988). Conversely, stereoscopic vision has been shown to improve
operator performance compared with single camera monocular views in a cluttered
9
complex, cheaper 2D displays will be the norm for at least the next few years. While it may
seem that stereoscopic viewing, VR, or a Head’s Up Display (HUD) would be the best
solution for teleoperation tasks, not every application is well-suited to remote operation. For
instance, assembly and repair tasks on-orbit often last hours at a time. Wearing HUD
headsets is visually fatiguing for the user (Mallem et al., 1991) and can cause significant
motion sickness in the wearer, due to streaming images at the periphery (Roscoe, 1991).
For reasons yet unknown, eyes maintain dark-focus accommodation when viewing
the collimated virtual images typically found in HUDs (Hull et al., 1982; Iavecchia, et al.,
1988; Norman & Erlich, 1986; Randle et al., 1980). In one study, resting focus was
measured while participants either 1) read numbers off a rooftop display 182 meters away or
2) read numbers superimposed on the same rooftop by the HUD (Iavecchia et al., 1988). The
10 HUD participants experienced an inward shift in accommodation that was highly related
to each participant’s individual dark or resting focus; each individual’s dark focus accounted
for 88 percent of the variance observed in their measured focal responses. Depending on the
amount of inward shift--1) objects may appear smaller in general 2) distant objects may be
judged farther, and 3) objects located below the horizon line or line of sight may appear
higher than they really are (Roscoe, 1991). Because of the mixed reviews of ‘3D’
technology, most displays on board the ISS and the Shuttle are flat-panel monocular displays
with a combination of graphic overlays, presenting supplemental distance and velocity
information. Grids are often part of the overlay, because they provide a good indication of
10
1992). The Shuttle’s Crew Optical Alignment Sight system makes use of reference-marks
and cross-hairs (Figure 3) as does the TORU display for Progress docking (Figure 4).
Grids and reference-marks—the best solution?
The proposed research investigates display issues relevant to performing velocity-
estimation tasks in space. Graphical overlays such as grids and reference-marks have been
shown to cause misjudgments of velocity in the fronto-parallel plane. The proposed study is
based on a seminal article by Gogel and McNulty (1983), which demonstrated that the
greater the density of vertical reference or hatch marks in a display, the greater the perceived
velocity of a laterally moving object. This 1983 study corroborates the findings of other
researchers that the addition of reference-marks or a reference frame lowers the motion
threshold (Liebowitz, 1955; Brown, 1931a, 1931b). Given this, there is potential for serious
(if not deadly) consequences, if grids and hatch marks incorporated into visual displays cause
misperception of velocity. This study will examine features of objects and reference-marks
that are hypothesized to have significant effects on the perception of lateral constant motion.
11
Figure 3. A photo of the Crew Optical Alignment Sight (COAS) graphical overlay.
This instrument is used routinely for docking maneuvers on the Space Station and Shuttle. The Progress vehicle is within the viewfinder. Retrieved February 12, 2008 from:
http://spaceflight.nasa.gov/shuttle/reference/shutref/orbiter/avionics/gnc/coas.html
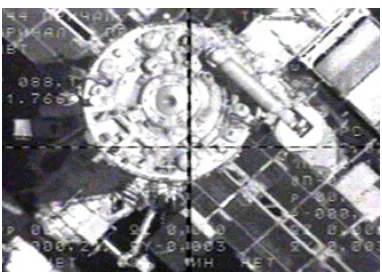
Figure 4. A camera view taken from the Progress 14 spacecraft approaching the ISS.
This photo shows the graphical overlay of numbers and the cross-hairs as it approaches the aft end of the ISS’s Zvezda Service Module before docking. Retrieved February 12, 2008 from NASA.gov:
12
It is expected that the results of this study, and related perceptual research, will be
applicable to areas other than ISS space operations, such as: remote or laparoscopic
minimally-invasive surgery (Ott, & DeLucia, 2006); assembly-line manufacturing; highway-
construction tasks; and commercial on-orbit space manufacturing and construction. To keep
results general enough to apply to these domains, the displays will use both a simple
illuminated square or rectangle as the target object. In Experiment 4, however, a 2D image of
the Space Shuttle is used to test more specific hypotheses related to an extended, more
realistic object.
Physiological factors in depth perception
Before beginning any discussion of perception, the characteristics of the perceptual
domain and the physical domain must be identified. The physical domain is, of course, the
actual external environment surrounding an observer. The perceptual domain is that same
environment, as the observer perceives it.
The human visual system has certain innate characteristics that determine how things
appear to us. In a process called "accommodation, "the lens of the eye changes shape, in
order to bring the light emanating from objects into focus on the retina. It does so by ciliary
muscles that tighten or loosen the pull on the lens, physically molding it into varying degrees
of curvature (power). In general, the lens must have a greater curvature to bring into focus
objects very near to the observer, while the lens must remain relatively flat when focusing on
13
distance of 4 meters, there is very little change in accommodation. For the close and
(Gogel & Tietz, 1973). Other monocular cues to distance include linear perspective, shading
and shadows, interposition, aerial perspective, texture gradients, relative size, and motion
parallax.
A binocular cue to distance is vergence, which is the amount of crossing of the eyes
needed to correctly align both eyes with an object of interest. For nearby objects, vergence is
much greater than for objects far away. For distant objects, the eyes are aligned nearly
parallel. Vergence is an effective binocular cue to distance for objects up to four or five
meters away.
Binocular disparity, as its name suggests, is also a binocular depth cue. An average
distance of 6.5 centimeters separates the eyes on the adult human face (Coren, Ward, &
Enns, 1999). Each eye is thus presented with a slightly different picture of the world. The
resulting three-dimensional view we have of our world is created by the offset of the images
presented to each eye. To explain this concept, consider that the images in a stereogram are
offset by various amounts of lateral separation between the two views. The amount of offset
between the left-eye and right-eye images determines how much depth is seen within the
composite (fused) "image". The Viewmaster, a popular children's toy, shows
three-dimensional images that appear even more dynamic, and three-three-dimensional than those we
encounter in real life. This is because the offset of the Viewmaster images is usually (and
intentionally) much greater than what is created by the lateral separation of the eyes
14
This study’s experimental screen was seen binocularly. This firmly anchored the
screen’s position in 3-D space and clearly conveyed to participants that the motion displays
were occurring in a fronto-parallel plane. Since the graphics superimposed on the screen in
this study were two-dimensional, any cues which might vary the distance of the moving
objects will be monocular.
Gogel and McNulty, the seminal article
Gogel and McNulty (1983) began their discussion by outlining the difference
between relative and absolute motion cues. A moving object presented completely alone in a
display will provide absolute cues of motion to the observer. Two moving objects in a
display share relative motion cues between themselves, although each object also presents
absolute-motion information to the observer. The addition of a reference-mark (or even a
frame surrounding the viewing area) typically lowers the threshold of motion (Brown, 1931b;
Mates, 1969). There is evidence that an object’s apparent velocity is less in an empty field
than in a field containing reference-marks (Brown, 1931b; Johansson, 1950). The addition of
reference-marks increases the availability of relative motion cues, with the result that the
observer may weigh these more heavily than the absolute motion cues provided by the
moving object itself. As the total number of reference-marks increases (predictably, up to a
certain limit), the availability of relative-motion cues, created by the interaction of those
marks with a moving object, increases as well. The absolute motion cues of the moving
object itself will, therefore, carry much less influence on the perception of the moving
15
increased within the range studied, the moving object was judged to be traveling faster.
Why this occurs can be explained by the principle of adjacency. The adjacency
principle states that the strength of a relationship (or the weight placed on relative cues)
between two objects increases as the separation between those objects decreases. In the
present example, the more reference-marks present, the more the object’s perceived velocity
will be determined by relative motion cues, rather than by absolute motion cues, because the
object encounters reference-marks with greater frequency. In addition to its influence in 2D
displays, the adjacency principle also operates in motion-in-depth displays. One moving
object has been shown to induce motion of another nearby object, when they are at similar
apparent distances (Gogel, 1979).
Experiment 1 of the Gogel and McNulty study examined the role of length of motion
path and fixation on the perceived velocity of a moving 2 mm point of light. A 34 cm x 57.5
cm screen was placed 1 meter away from the observer in a darkened visual alley. The alley
floor was covered with a pink and black checkered cloth (removed for later experiments),
covered by 2.5 cm squares. Seven vertical reference-marks (measuring 1 cm tall and 2 mm
wide) were evenly spaced over either a 10 cm or 20 cm total path length. The point traveled
from right to left, disappeared when it reached the left edge of the screen, and reappeared
again at the right, to begin the motion path again. The object velocities were either 1.6, 4.26,
6.34, 9.09, 11.20 or 13.77 cm/s.
Because relative motion had been found to be affected by attention (Johansson,
16
instructions were given to participants: fixation on the moving object, fixation on the center
reference-mark, or no fixation instruction. Observers matched the apparent, perceived
velocity of the object by adjusting the velocity of a hidden moving belt, as it passed through
their fingers. Observers viewed the motion of the object for as long as they wanted, before
stating that they were confident in their velocity match of the moving belt. A total of 72 trials
were completed, exposing subjects to each of the 12 stimulus conditions (6 speeds x 2
lengths) a total of six times.
The tactile matching task proved to be a reliable method of measuring perceived
velocity, although observers exhibited a tendency to overestimate visual speed using the
method. Fixation instructions had no significant effect on the results. Though there was a
tendency for some observers to judge the object as moving faster on a shorter path, this was a
non-significant finding overall.
In Experiment 2, the object moved along either a 10 or 20 cm path and the number of
vertical reference-marks was varied. Either 0, 1, 2, 4, 7 or 13 reference-marks were equally
spaced over the path, and only two velocities were used: 4.3 or 9.1 cm/s (angular velocities
of 2.4 degrees/s or 5.2 degrees/s, respectively). An increase in reference-mark number with
either speed or either path length resulted in a significant increase in apparent velocity. The
speed of physical motion was also a significant variable.
To determine the effect of motion path length, if any, Experiment 3 used the same
density of reference-marks for both motion path lengths. For either path, reference-mark
17
reference-marks by path length), resulting in 4, 6, 8, 12, 16, or 20 marks for the long path and
2, 3, 4, 5, 8, and 10 marks for the short path. There were four combinations of speed and path
length, since the same two velocities from Experiment 2 were used.
Simply stated, the length of the motion path was insignificant and perceived speed
varied with both physical speed and reference-mark density. These results indicated that
mark density and physical speed (rather than the absolute number of
reference-marks) were the most important determinants of perceived velocity. These results confirm
the adjacency principle hypothesis that as relative motion cues increase, perceived velocity
also increases.
The first experiment of this dissertation replicated the results of Gogel and McNulty
in the transverse plane of view, using a 2D flat-panel display. Additional experiments sought
to identify those characteristics of reference-marks and/or characteristics of the object that
modified the perceptual effect. The overall goal of this dissertation was to understand 1) the
effect that reference-mark density and object characteristics have on accuracy of perceived
velocity judgments and 2) to better determine those characteristics of objects or reference-
marks that could improve performance if they were incorporated into actual work displays.
Measurement of perceived velocity
Perceived velocity experiments often use magnitude-estimation techniques. The basic
method of magnitude estimation involves the presentation of a standard stimulus to the
participant. In the following experimental trials, the participant is asked to compare the trial
18
stimulus. For example, a standard stimulus is presented and its brightness is described as
“10” (the modulus). An experimental stimulus that later appears twice as bright should be
described as having a value of “20.”
Though a seemingly simple task, magnitude estimation can have some inherent
problems with response bias and practice effects. When participants are forced to use a
particular range of values, responses often become restrained and predictable, and initial
values may effectively set the standard for future responses (Poulton, 1968). Even without
the use of a modulus and standard, participants often self-monitor their consistency in
responses and factor in previous judgments. Participant responses can be biased by
numerosity, or the pairing of certain physical stimuli with absolute numbers or magnitudes
(Zwislocki & Goodman, 1980), making the likelihood of a pure response unfettered by
undesirable influences quite rare. People tend to apply a “numerosity heuristic” when they
are asked to quickly judge the amount of something or the total number of objects, especially
when the task is cognitively challenging. That is, they tend to over-estimate amounts in
general. In a study by Pelham, Sumarta, and Myaskovsky (1995), participants judged the area
of a circle as being greater, when it was divided up into smaller slices, than if it were
presented as one solid unbroken shape. Similarly, the area of the circle was judged as
greater, when slices were placed in one extended line, rather than assembled closely in a
19
judgment than young children or even animals. In the same study, participants provided
greater overestimations while performing a challenging secondary task. For these reasons,
rather than the use of verbal estimates of speed, a more active, direct measure was
implemented in the present experiment.
Substitute methods for magnitude estimation exist that are not limited to a range of
values nor do they provide subjects the opportunity to repeat their responses from a previous
stimulus. For example, in a cross-modal matching task, a subject matches the experience of
an experimental stimulus by adjusting a comparison stimulus in another modality, such as
adjusting the rate of a beeping sound to match the perceived velocity of a moving circle of
light (Young, 2002), or adjusting the felt-speed of a belt to match a visually perceived
velocity, as in the Gogel and McNulty (1983) study.
Time–To-Passage
A different method for measuring perceived velocity was implemented in this study.
In general, this measure involves a subject providing a passage (TTP) or
time-to-arrival (TTA) judgment. Another popular measure is known as time-to-contact (TTC). TTC
is defined as the time it takes for a moving object to come into contact with a surface, another
object, or a person. It is typically used in motion-in-depth trials in which the object is on a
direct collision path with the observer. In this research, TTP was a better choice of term,
because participants judged when the object passed by a particular point in the transverse
20
type of judgment that robotic station operators make during assembly tasks. The term TTP is
used primarily in this research to represent a wholly or partially perceived judgment, as
opposed to indicating the actual time-to-passage of any particular object.
In the discussion that follows, the author will employ TTP whenever possible,
because it is a more general term than TTC. When TTC is specifically employed, the reader
should assume that the object was on a collision path to the observer, whether direct or
angled, and that TTP cannot be substituted. TTP has been used in this dissertation, because
the path of the moving object in all four experiments was always perpendicular to the
participant.
Measuring TTP
There are several primary methodologies for measuring TTP in the literature. The
first task, the relative judgment task (RJ), commonly uses the term "observation point" to
describe the participant's position. In RJ tasks, participants estimate which of two objects will
pass the participant's observation point first (DeLucia, 1991; Simpson, 1988), which object
would a participant, when moving towards the stimuli, contact first (Kaiser & Mowafy,
1993), or which of two objects would contact a third point first (Bootsma & Oudejans, 1993).
The second task, the Predicted-Motion (PM) task presents the participant with the moving
stimuli and removes the display after a certain length of viewing time. The participant is
instructed to press a button or respond at the time when the object would have contacted the
participant or passed a certain point, if it had remained visible. A more ecological alternative
21
hidden by another object rather than simply disappearing from the display. While certain
studies have demonstrated greater TTP judgment accuracy with occlusion scenarios (Manser,
1999), it was important that participants not be able to predict exactly when the object would
disappear. In an occlusion paradigm, the occluding object is typically within the participant’s
view at the start of each trial. In the present research, an occluding object entering from
off-screen could have possibly transferred unwanted motion effects to the moving object.
Therefore, a traditional PM task was implemented in this research.
In discussions of TTP, it is important to identify and describe the two differing
opinions on the topic. There are a variety of models available for TTP estimation, but each
may be placed into one of these two camps. The first has its roots in “Gibsonian” ecological
or direct psychology, and suggests that TTP is determined by an optical expansion variable
called “tau.” (It should be mentioned that at the time of the writing of this dissertation, the
theory of tau has since been discredited; Hecht, 2004). Tau is defined instantaneously, and is
dependent on time (Tresilian, 1991). Lee (1974) defines tau as being the inverse of the
relative rate of retinal expansion of the object's optical contour. Lee et al. (1983) have shown
that participants “gear” their actions (e.g., “at what point should I leap to catch a pop-fly in
the outfield?”) to accommodate the changing value of tau, i.e., the rate of change in optical
expansion of a falling ball.
Knowing that participants respond to tau in the case of an approaching ball,
Savelsbergh et al. (1991) hypothesized that, if participants were presented with a ball that
22
aperture of participants’ hands would reflect changes in the ball’s actual size. Researchers
discovered that even though participants possessed no “expressible” knowledge that the ball
was deflating upon approach, their grasping apertures were, in fact, finely tuned to the optical
contraction of the ball, as it deflated. Because standard deviations of hand aperture became
smaller as the ball approached the hand, the researchers interpreted the results as an
indication that visual feedback becomes more precise as contact approaches (Savelsbergh et
al., 1991).
Tau has been further deconstructed into global and local variables. Local tau is
derived from the object's image, whether specified by the image's optical contour or the
distance between two designated points within the object. Local tau is involved with the
timing of actions, such as catching and hitting, and is often discussed in the perception and
action literature involving sports performance. In contrast, global tau is based on information
regarding the whole scene in view. It refers to the total velocity field of the visual
environment, assuming a rigid environment such that a flow field is imaged on the retina, as
a person moves in-depth through the environment (Tresilian, 1991). It can be defined as "the
ratio of angular separation of the contours of an image to the instantaneous rate of change in
the angular separation of the contours of the image” (Novak, 1997, p.2). Said differently,
global tau is based on the rate of change in the angle between the participant's line of sight
and the edges of the object. Global tau is the optical variable that is used for specifying TTP
for non-collision path approaches. TTP, according to the ecological theory of perception, is
23 combination of the two.
The second camp counters that "we do not only interact with objects that are moving
towards our eyes” (Smeets et al., 1996, p. 583). These researchers believe that TTP is judged
indirectly, on the basis of distinct perceptual variables like perceived distance and perceived
velocity. Experiments (Smeets and Brenner, 1995; Brenner et al. 1996) have shown that
human timing of interceptive action depends on the perceived velocity of an object. In this
research, a moving background was used to induce perceptual changes to the apparent
velocity of the object, without changing either the physical velocity or the perceived position.
In a sense, the tau hypothesis of direct perception of TTP is a cleaner hypothesis,
(unlike the indirect perception of TTP, which requires consideration of two separate
variables), because there are no transformations to perform. However, the direct perception
hypothesis cannot explain why TTP of an object, under certain circumstances, is influenced
by moving backgrounds (Brenner et al., 1996; Smeets et al., 1996) and a static illusory image
such as the Sander parallelogram (DeLucia et al., 2000), or the Ebbinghaus-Tichener illusion,
for example (Pavlova, & Sokolov, 2000). If the direct perception theory of TTP were valid,
TTP estimates in the presence of these influences should remain constant. Smeets et al.
(1996) stress that because errors in perceived distance or velocity will subsequently change
participants' judgments of time-to-contact, this is an extremely sensitive measure with which
to test the indirect perception hypothesis against the hypothesis. Using a moving background
design, they have shown that TTP estimates for laterally moving objects are based on the
24
Despite the theoretical debates surrounding direct versus indirect perception of TTP,
the method of measurement of time-to-passage seemed to be most appropriate for the needs
of this study.
Variables affecting perceived velocity and TTP
There are numerous variables involving the relationship of the object to the
background, which have consistently been shown to affect perceived velocity. The lower the
contrast between a moving object and its background, the lower the perceived velocity
appears (Thompson, 1982). The movement of the background in relation to the object can
also have a significant effect on perceived velocity. A background moving in a direction
opposite to the object will result in an increased perceived velocity, while a background
moving in the same direction of the object will results in a decreased perceived velocity
(Nakamura, 1997; Raymond, 1988). In Raymond’s study, velocity overestimation was
cancelled by an increase in object size. However, underestimation of velocity, caused by a
striped background moving in the same direction as the object, was not nulled with a larger
object. When a moving object is increased in size and is viewed on a uniform background
(potentially of interest to this study), a small increase in perceived velocity results. Perceived
velocity is inversely related to spatial period and increases with increased spatial frequency
of the background (Diener et al., 1976). As stripe size or viewing aperture size (or both)
increase, perceived velocity decreases (Oyama, 1970; Diener et al., 1976).
While acceleration was not studied in this experiment, it is of interest to note that
25
probably because observers use a constant-velocity strategy, rather than properly adjusting
for the acceleration (Lee et al., 1981; Kaiser & Hecht, 2003; Lee & Reddish, 1981;
Gottsdanker, 1955; Rosenbaum, 1975). This has been shown to be true in either monocular
or binocular viewing tasks (Lopez-Moliner et al., 2003), as well as with tasks involving
non-constant optical flow fields (Kaiser et al., 2003).
The relationship between TTC, distance and velocity is simple: TTC = Distance /
Velocity. Similarly, Perceived TTC = Perceived Distance / Perceived Velocity. To study the
influence of one of the three items in the latter equation, one must keep the other variables
constant. Several studies have disclosed important information regarding relationships
between actual TTC and perceived TTC. As actual TTC increases, so do perceived estimates
of TTC. Participants underestimate TTC, when actual TTC is less than two seconds, and
overestimate TTC, when actual TTC is greater than two seconds (McLeod & Ross, 1983;
Schiff & Detwiler, 1979; Schiff & Oldak, 1990). Estimates of faster objects are more
accurate than slower ones. By physically increasing velocity of the moving object, estimates
of TTC were more accurate, with less underestimation, possibly as a result of the shorter
TTC, i.e., the object was absent from view for a shorter time (McLeod & Ross, 1983; Schiff,
Oldak & Shah, 1992). It is not known, however, what relationship exists between accuracy
and perceived velocity. Because this study manipulated the perceived velocity of the object,
the relationship of perceived velocity (manipulated by the addition of reference-lines) to
timing accuracy was examined.
26
TTP-estimation errors. In an experiment investigating cognitive processing, as it relates to
lateral TTP judgments, Novak (1997) found that the more objects being judged in a display,
the less accurate (and more overestimated) were the TTP judgments in a PM task. The task
was to judge which of six display objects approaching in depth would pass a certain point
first. Participants experienced a higher cognitive processing load, when judging six objects
simultaneously, than when judging either one object alone or three objects. Participants gave
considerably less accurate, more overestimated TTP predictions as the number of objects in
the display increased. DeLucia and Novak (1997) discovered that the cognitive processing
required to make relative TTC estimations in a display with 8 objects (each with their own
TTC) moving toward an observer, created significantly longer response times and less
accuracy.
Pictorial size may be another cue to guide TTP estimates. Participants in a 1991 and
1995 DeLucia study were presented with a monocular display at a distance of 36 cm in which
two objects (a large object which was far away and a small object which was close) were
moving with identical speed on approach-but-bypass trajectories. Various objects were
placed in the display and seen as floating above a perspective plane. The objects were
squares, rods, triangles and crosses and were shown within the context of a road with
converging lines at the horizon, and “approaching” posts at the sides. The two-dimensional
objects “approached” the viewer head-on and were categorized as having fast expansion,
slow expansion, and slow expansion with ground-intercept information provided in the form
27
judged that the farther large square would contact them first, even though the actual TTP was
shorter for the smaller, closer square (DeLucia, 1991, 1995). Ground-intercept information
weakened this effect. In the computer simulation, the smaller object always projected a
smaller image throughout the display duration, although it was always closer in distance to
the observation point. This effect is called the size-arrival effect. These results indicate that
pictorial depth information can override motion-based depth information in certain situations.
These results (whether caused by relative size cues, perceived relative velocity, or perceived
relative depth) imply that pictorial depth information is involved in judging TTP, rather than
the TTP being solely dependent on arrival-time information provided by the optical
expansion pattern of the display (DeLucia, 1991).
Sex differences
There have been numerous examples of sex differences in the judgment of perceived
TTP. In general, women provide less accurate TTP judgments than men, and this inaccuracy
increases monotonically with increases in actual TTP. Two studies show that women’s
estimates tend to be, on the whole, more conservative (that is, greater underestimates of TTP)
than men’s estimates, especially with verbal judgments (Schiff, & Oldak, 1990; McLeod, &
Ross, 1983). However, several studies have reported greater variability in women’s TTP
judgments, which is most likely caused by individual differences among women, as far as
participation in physical activities and sports (Schiff & Oldak, 1990; McLeod & Ross, 1983).
Sex effects co-vary with the accuracy of velocity judgments of an approaching object. At
28
estimations; more specifically, they greatly underestimate TTC (Manser, & Hancock, 1996).
In a 1992 study by Schiff and Oldak, older women provided higher velocity estimates than
other groups, further reinforcing the finding that women tend to be more conservative and
underestimate TTP in radial, transverse, and oblique approaches.
Why women tend to be less accurate has been under debate for years. Women show
less sensitivity to changes in relative velocity than do men. Schiff and Detweiler (1979)
found that women who provided less accurate TTC judgments, also reported less prior and
current participation in sports and hand-eye coordination activities than women with more
accurate results. Still, it seems important to mention there seems to be fair amount of
variability in the accuracy of female TTP judgments (Konecni et al., 1976). Researchers
have found that women of all ages tend to be more conservative drivers compared to men.
For example, women take more time to cross over a lane of traffic, when making a left-hand
turn (Caird, & Hancock, 1994) and are more likely to stop at yellow lights (Konecni et al.,
1976).
Method
Four separate experiments were conducted with the first serving as a replication of
the original Gogel and McNulty study, using computer displays as the display mechanism.
Power and sample size calculations
Gogel and McNulty’s third experiment showed that the interaction of interest, that of
density (6 levels) X velocity (2 levels), had a partial effect size of 0.06 with 24 participants
29
observations for the interaction of interest. One note, because Cohen’s power tables are for
standard between-subjects ANOVAs and not for repeated-measures ANOVAs, the actual
power in their study was greater than 0.08. The interaction of interest in Experiment 1 of the
current study was that of Velocity (2 levels) X Density (4 levels) for a total of 8 groups.
Using hypothesized effect sizes of 0.1, 0.25, or 0.4, and alpha of 0.05, the following power
table was calculated using the shareware program, GPOWER.
Based on the results from Gogel and McNulty, it was reasonable to anticipate a small
to medium effect size. The best compromise of efficiency and power was to run a total of 24
partipants in each experiment (because there was little power to gain by increasing to 32
participants if the effect was small). Because the power table above was calculated using a
standard power program that assumed a between-subjects design, it was expected that a
repeated-measures design would result in power values that were somewhat larger than
shown in Table 1.
Table 1. Power table for Experiment 1
Number of Participants
Total
Observations
Effect Size
Small .10 Medium 0.25 Large 0.40
18 144 0.11 power 0.53 power 0.95 power
24 192 0.13 power 0.69 power 0.99 power
30
As an alternative, power was calculated for Experiment 1, assuming 24 participants
using the following website: http://www.stat.uiowa.edu/%7Erlenth/Power/. A randomized complete block balanced ANOVA, Tukey’s HSD, and an alpha of 0.05 were selected. Using
a 0.3 seconds detectable contrast for density (the main effect of interest), the resulting power
was 0.86. The interactions of interest were 1) density*extrapolation distance and 2)
density*velocity. For a detectable contrast of 0.5 seconds, the power was 0.575 and 0.89,
respectively. Because this online program did not allow for selection of repeated-measures
designs, it was expected that power would be higher than what was reported by the program.
Participants
Twenty-four observers (12 men and 12 women) ranging in age from 18 to 22
participated in Experiment 1, 2 and 4. Twenty-two observers (11 men and 11 women) of the
same age range participated in Experiment 3. Average age of participants across all
experiments was 18.7 years old (SD = 1.3). All participants were North Carolina State
University undergraduate students enrolled in Introductory Psychology class, who voluntarily
participated in order to fulfill a “research requirement.” Each individual possessed no less
than a visual acuity of 20/30 in each eye, corrected or uncorrected, with an overall visual
acuity of 20/20 as measured by a near-and-far Snellen visual acuity chart. They
demonstrated a minimum stereoacuity of 145 seconds of arc, as measured by the Keystone
Multi-Stereo Test. Additionally, all participants had normal color vision, as tested by Ishihara
Test for color vision. These stringent vision requirements reflect the minimum standards for
31
Apparatus
The proposed display apparatus was a 17” flat-panel Hewlett Packard color display.
A Macintosh G3 desktop computer was used to power the displays, using a 128mb ATI
Radon 9200 video card. All experimental displays were created using Macromedia Director
MX 2004 software. Experimental displays were shown in the center portion of the screen on
a black background. A wireless keyboard was used for registering participant responses.
Participants were comfortably seated in a chair in front of the flat-panel display with
the keyboard within reach. Subjects were asked to maintain their head position, although they
were not required to use a chinrest. (A chin-rest would have been an unnatural lab artifact
and not very realistic for real world applications.) Participants’ eyes were located
approximately 0.6 m from the screen, simulating the approximate distance of the 50th
percentile female astronaut’s eyes, when using the robotic workstation displays on orbit. This
value was calculated by using the NASA Human Systems Integration Standards’
anthropometric measures of forearm length and shoulder-to-elbow length for the 50th
percentile astronaut. This eye distance has also been used in visual experiments, concerning
displays on Earth (Lopez-Moliner et al., 2003; DeLucia & Liddell, 1998). A black curtain
was drawn during practice and experimental trials to block glare on the flat panel display
from hallway lights. White noise (55 DBa) was played during experimental trials to muffle
any unintended hallway noises or extraneous sounds.
Experimental variables and design
32
results have been mixed regarding sex effects in predicted-motion tasks, the between-subject
variable of sex was included because of the ease with which equal numbers of men and
women could be recruited.
Table 2. Object colors, sizes and luminance values for all experiments
Object Found in
experiment
Color value (0-255)
Luminance in cd/m2
Size in pixels
0% transparency (opaque)
reference-marks
1, 2, 3 250 17.6 4 x 12
70% transparency (high saliency) reference-marks
4 30% opacity of
250 2.4 4 x 12
80% transparency (medium saliency) reference-marks
4 20% opacity of
250 1.1 4 x 12
90% transparency (low saliency) reference-marks
4 10% opacity of
250 0.6 4 x 12
Green square 1 and 2 41 33.7 10 x 10 Grey small square 2 and 3 246 34.0 10 x 10 Grey medium
rectangle
3 246 33.7 15 x 15
Grey large rectangle
3 246 33.7 16 x 75
Grey wedge 4 246 33.7 25 x 75
Space shuttle 4 See Figure 9 11.0 25 x 75
Twenty centimeters was selected as the standard motion path length for all
experiments, because it corresponded to the width of the RWS displays on board the ISS, and
allowed participants to view objects over a reasonable motion track. Gogel and McNulty
33
path length was not expected to restrict generalizability.
Reference-marks were equally distributed across this 20 cm path length. The
reference-marks measured 1.2 mm (4 pixels) wide and 1 cm tall. The light gray opaque
reference-marks were superimposed over the black background (luminance of 0.2). The
luminance, and color picker value of all stimuli in all four experiments are found in Table 2.
For replication purposes, the color picker had a palette of 256 colors (using a Macintosh
palette) with 0 as black and 255 as white. Figure 5 shows an example of an Experiment 1
display.
Figure 5. Experimental display. Display shows square target and lowest
reference-mark density used in Experiment 1.
The object was not viewed over the entire span of 20 cm. Rather, the square was
34
from left to right. To trigger the motion of the square, participants pressed the space-bar
once. After one second of delay, the square entered the field of view, approximately two
inches inside the screen edge, to avoid any edge effects. The square traveled with a constant
velocity (either slow or fast) and disappeared, when its front edge reached the appropriate
reference-mark. This resulted in three different ‘extrapolation distances’ (ED’ or prediction
intervals for which participants were instructed to provide a TTP judgment by pressing the
space-bar a second time. The three EDs were varied randomly, so that it would be more
difficult for participants to standardize responses. ED was introduced as a variable to prevent
participants from standardizing responses, though it was not anticipated to have any
significant effects; studies have shown no effect of manipulating viewing time of displays on
accuracy (McLeod & Ross, 1983).
Actual time to cross the entire path for the fast velocity, which was used in all four
experiments, was 2.2 seconds. The object took 0.55 seconds to cross each quarter of the
path. In Experiment 1, an additional slow velocity was used. When traveling at the slow
velocity, the object took 4.95 seconds to cross the entire 20 cm path length.
A variety of object and reference-mark characteristics were examined over a series of
four experiments: Experiment 1 investigated the effect of four levels of reference-mark
density (low, medium-low, medium-high or high), and two velocities (one fast, one slow);
Experiment 2 investigated the color of moving object (either gray or green), and offset of
object from vertical center of reference-marks; Experiment 3 investigated the horizontal
35
the dimensions used in Experiment 1 and 2, or a medium-sized square; Experiment 4
investigated the effect of reference-mark saliency and type of object (familiar--a gray wedge)
or unfamiliar—a space shuttle image).
Calibration
A calibration screen was used to measure the luminosity of the reference-marks and
background. The calibration screen allowed the experimenter to fill the entire visible area
with one of 256 possible colors (0 black, 255 white) at a specified percentage transparency,
using a user-friendly color picker. A Tektronix© J65231 1-degree Narrow Angle Probe
photometer was used to measure luminance of the screen center. Since LCD screens often
show significant color shifts with eccentricity and location, the photometer was positioned at
the eye height of an average participant.
The program was designed to allow the external calibration of velocity. For
calibration purposes, a special version of the program presented 100 trials of continuous
object motion across the 20 cm path. The trials were timed with a stopwatch over the trials,
providing an external check of all possible object velocities. The experimenter started the
stopwatch when the object edge first crossed the start of the path. The object then crossed a
set distance from left to right and when the leading edge of the object reached the end of the
path, it immediately began its motion path again from the left side of the screen. The total
amount of distance covered by the object over the 100 trials was then divided by the amount
of time it took for the object to cross the path 100 times. The author’s personal reaction time
36
http://getyourwebsitehere.com/jswb/rttest01.html) had only a negligible effect on the overall
velocity over 100 trials. In this way, the experimenter calibrated the display velocities and
ensured that the internal program velocity corresponded to a known external velocity.
Dependent variables
The dependent variable was total time-to-passage (totTTP), defined as the total time
elapsed between appearance of the object and participant response. This measure was
composed of both a visible and a hidden portion. The actual or visible component (TTPvisible)
refers to the time over which the moving object was visible, equivalent to ¼, ½, or ¾ of the
total path length. The perceived or hidden component (TTPhidden) was the remainder of the
path length, over which the moving object was hidden. TTPhidden refers to the time elapsed
between object disappearance and participant response. In this dissertation, the hidden
portion is referred to in terms of long, medium and short ED, depending on the length of the
hidden period. The visible (actual TTP) plus the hidden portion (TTPhidden) makes up this
two-part dependent variable of totTTP. In order to compare results to those of Gogel and
McNulty for Experiment 1, totTTP will be discussed in terms of their dependent measure,
“perceived velocity.” The relationship between perceived velocity and totTTP is simple:
when totTTP is overestimated, perceived velocity is underestimated and vice versa.
Because totTTP has limited applicability to the real world, a derived dependent
variable was calculated to serve as a measure of timing error and accuracy. This variable was
37
and percentTTP. PercentTTP uses TTPhidden as the numerator, rather than totTTP. This
technique has been used previously in many studies involving time-to-contact (McLeod &
Ross, 1983; Schiff & Oldak, 1990; Schiff, Oldak & Shah, 1992; Novak, 1997). In this study,
mean percentTTP values were typically greater than 100, indicating that participants
overestimated actual TTP (similar to those results of Gogel & McNulty). In other words,
participants were seeing the objects as moving more slowly than they were in actuality. This
overestimation has been supported in the literature by a few studies involving motion
extrapolation (Yakimoff et al., 1993; Sokolov & Pavlova, 2003). One rule of thumb to make
percentTTP easier to interpret is that the farther away a value is from 100, the lower the
accuracy. To avoid any confusion, results will be discussed both in terms of percentTTP, as
well as accuracy.
A time-to-passage predicted-motion paradigm was used to measure the dependent
variable totTTP, and the derived dependent variables, perceived velocity, and percentTTP.
The display presented the object motion trials and required active participation on the
observer’s part. Verbal judgments of TTP were avoided to prevent participants from
self-monitoring their responses by using magnitude estimation. Though past studies (Young,
2002; Nyeste, 2004) have shown the value and validity of using a cross-modality auditory
measure, called the MMT (metronome matching technique), for perceived velocity
judgments, a PM task seems to be a more natural, realistic form of measurement for the