Abstract
ANDERSON, ALLISON M. Learning Curve Analysis for Alternative Keyboards. (Under the direction of Dr. Gary A. Mirka).
Although research has shown that alternative keyboards can offer ergonomic benefits over the standard QWERTY keyboard, the simple single-plane QWERTY layout is still the most widely used keyboard design. One of the hypothesized reasons for this resistance to change is the expected time to learn a new layout of the keys or time to become accustomed to a modified keyboard profile/orientation (e.g. split, contoured). To begin to address this concern, the current study was performed to quantify learning rates for four alternative keyboards (a chord keypad, a contoured split keyboard, a Dvorak layout keyboard, and a fixed split keyboard). To gain a deeper understanding of the underlying phenomenon that may lead to differences in learning rate, this study also sought to understand how physical, cognitive, and perceptual demands of the different keyboard design affect this learning rate.
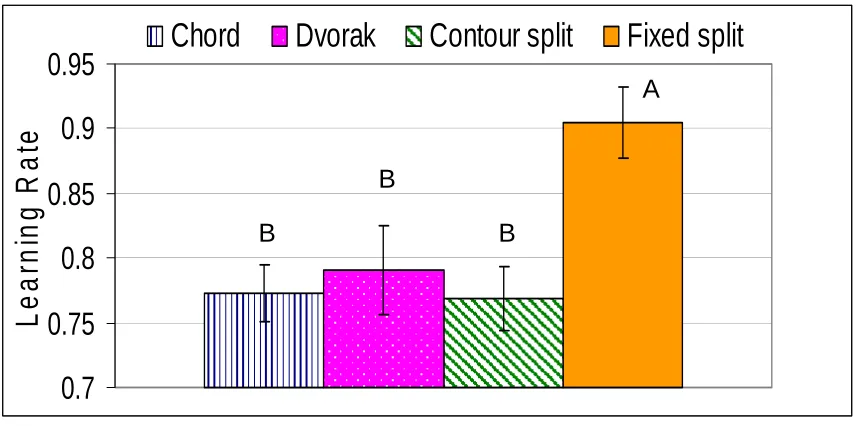
Results demonstrated five trials were sufficient to provide stable estimates of the learning rates for each keyboard. The results also showed that the learning rate for the fixed split keyboard (90.4%) was significantly different (F=23.25, p<0.001) from the learning rates for the other three keyboards (chord: 77.3%, contour split: 76.9%,
Dvorak: 79.1%). Previous studies have suggested that cognitive tasks have a learning rate of 70% while physical tasks would have a learning rate of 90%. Our results
indicate that the fixed split keyboard was primarily a physical intervention while the other keyboards appear to have both a physical and cognitive learning component. Learning rate was negatively correlated to all types of demand (physical, cognitive, and
perceptual), meaning that learning rate was slower with higher demand, regardless of the type of demand.
Productivity is also an important measure when implementing an ergonomic intervention. The average time for the QWERTY trials (control condition) was 40.2 seconds, and the average time for the 5th trial on the split keyboard was 42.4 seconds (5% slower than QWERTY). Also, after 20 trials on the contour split keyboard, subjects were able to type each trial in an average of 44 seconds, within 10% of typing speed on the QWERTY keyboard. These two alternative keyboards utilize the QWERTY key layout but are physically shaped differently to promote more neutral wrist postures. Subjects were able to regain typing speeds on these two keyboards, but trial times were much slower on the other two keyboards given the higher cognitive demands.
Learning Curve Analysis for
Alternative Keyboards
by
Allison Marks Anderson
A thesis submitted to the Graduate Faculty of North Carolina State University
In partial fulfillment of the
Requirements of the Degree of Master of Science
INDUSTRIAL ENGINEERING Raleigh, North Carolina
APPROVED BY:
Sharon Joines, PhD David Kaber, PhD
Gary A. Mirka, PhD
Biography
Allison Anderson was born the youngest of five daughters of Gordon and Judy Marks.
Allison grew up in Valrico, FL. In May of 2001, Allison graduated from Brandon High
School in Brandon, FL, and decided to pursue a degree in engineering at North Carolina
State University. Allison swam distance freestyle for NC State, and was involved in
several programs on campus including the Caldwell Fellows Program and Alumni
Association Student Ambassador program. Allison also served as a resident advisor on
campus for two years. In May 2005, she graduated with a Bachelors of Science in
Biomedical Engineering. A few weeks after graduation, Allison married David
Anderson, who she was fortunate enough to meet in her first semester at NC State. In
the fall of 2005, Allison started working on her M.S. of Industrial Engineering where she
had the honor of serving as a research assistant for Dr. Gary A. Mirka. Allison looks
forward to graduating in May 2007 and starting her first job as an ergonomics consultant
Table of Contents
List of Figures...iv
List of Tables... v
1. Introduction ... 1
1.1 Occupational Musculoskeletal Disorders ... 1
1.2 Office Environment ... 4
1.3 Overview of Ergonomic Interventions for Office Environment ... 6
1.3.1 Administrative Controls... 6
1.3.2 Engineering Controls ... 7
1.3.3 Keyboards... 7
1.3.3.6 Challenges with New Keyboards ... 20
1.4 Learning Curve Theory ... 21
1.5 Objectives of This Study ... 23
2. Methods ... 25
2.1 Subjects ... 25
2.2 Equipment... 25
2.2.1 Testing Equipment/ Keyboards... 25
2.2.2 Data Collection Equipment ... 27
2.3 Experimental Design ... 28
2.3.1 Independent Variables... 28
2.3.2 Dependent Variables ... 29
2.4 Protocol... 29
2.4.1 Part 2: Learning Rate Verification...31
2.5 Data Processing... 31
2.5.1 Learning Rate ... 31
2.5.2. Subjective Assessment Data ... 31
2.6 Statistical Analysis ... 32
2.6.1 ANOVA ... 32
2.6.2 Correlation Analysis... 33
3. Results ... 35
3. 1 Learning Rate ... 35
3. 2 Subjective Assessment of Demands... 40
4. Discussion... 42
4.1 Learning Rate and Subjective Assessment... 42
4.2 Assessment of Alternative Keyboards... 45
4.2.1 Fixed Split Keyboard... 45
4.2.2 Contour Split Keyboard... 47
4.2.3 Dvorak Keyboard ... 49
4.2.4 Chord Keyboard... 51
4.3 Limitations to Research... 53
4.4 Future Research ... 54
5. Conclusion ... 56
References... 58
List of Figures
Figure 1: Correct posture for seated work environment (OSHA, 2004) ... 5
Figure 2: Postures promoted by the standard, flat keyboard (NIOSH, 1997-2) ... 10
Figure 3: Fixed split keyboard (NIOSH, 1997-2) ... 11
Figure 4: Planes for adjustment on split keyboard (NIOSH, 1997-2)... 11
Figure 5: Kinesis ergonomic keyboard ... 14
Figure 6: Comparative finger loads on the Dvorak keyboard (left) versus the standard keyboard (Dvorak, 1943)... 17
Figure 7: Five keyboards were used in this study……….26
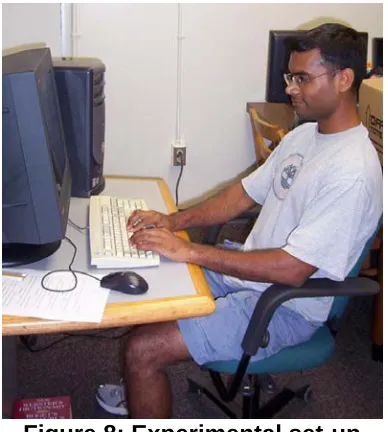
Figure 8: Experimental set-up ... 26
Figure 9: Subjective assessment of perceived workload... 28
Figure 10: Analysis of survey question data... 32
Figure 11: Learning rate by keyboard type. Columns with the same letter were not statistically different. ... 35
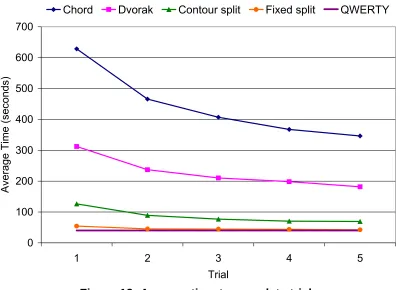
Figure 12: Average time to complete trials ... 36
Figure 13: Average percent error for each trial... 37
Figure 14: Average time to complete each trial ... 38
Figure 15: Average percent time to complete 20 trials ... 39
Figure 16: Subjective assessment of the physical, cognitive, and perceptual demands as a function of keyboard type ... 41
Figure 17: The normal quantile plot of the residuals of the chord keyboard ... 69
Figure 18: The normal quantile plot of the residuals for the Dvorak keyboard ... 69
Figure 19: The normal quantile plot of the residuals for the contour split keyboard ... 70
Figure 20: The normal quantile plot of the residuals for the split keyboard ... 70
Figure 21: Test for homogeneity of variance ... 71
Figure 22: Residuals of learning rate as a function of order of keyboard ... 71
List of Tables
Table 1: Letter frequency ... 27
Table 2: Time, % time, and % error for each keyboard ... 38
Table 3: Analysis of learning rate ... 39
Table 4: Estimated time to complete ... 40
Table 5: Correlation results ... 40
Table 6: Average normalized survey scores ... 41
1. Introduction
One objective of human factors and ergonomics is to design tools and
environments to “better match the capabilities, limitations, and needs of people” (p.4
Sanders and McCormick, 1993). Proven benefits of implementing human factors
knowledge into design are: increased productivity, decreased error, increased
system safety, increased system reliability, and increased user satisfaction and
acceptance (Sanders and McCormick, 1993).
There are two sub-disciplines of ergonomics: cognitive ergonomics and physical
ergonomics. Cognitive ergonomics deals with mental processes and people’s
mental interactions with systems. Physical ergonomics deals with how physical and
anatomical characteristics affect people’s interactions with systems. This paper
focuses on the physical and cognitive demands associated with alternative
keyboards, and how each of these factors affects learning ability.
1.1 Occupational Musculoskeletal Disorders
Musculoskeletal disorders (MSDs) are conditions that involve the nerves,
tendons, muscles, and supporting structures of the body (NIOSH, 1997-1).
Work-related musculoskeletal disorders (WMSDs) refer to MSDs that are caused or made
worse by the work environment. Physical risk factors for MSDs are: highly repetitive
tasks and frequency of movement, force applied/needed, posture (static and
awkward), and exposure to vibration (NIOSH, 1997-1; Hargraves et al., 1992).
MSDs often occur as a result of the mismatch between the physical abilities of the
Occupational MSDs have a costly impact on society and the individual. It has
been estimated that occupational MSDs cost between $13 and $20 billion each year
(NIOSH, 1997-1). High-risk industries include nursing, air transportation, mining,
food processing, leather tanning, and manufacturing of automobiles, furniture,
appliances, electrical products, textiles, and apparel (NIOSH, 1997-1). It is easy to
associate MSDs with these highly physical jobs, but many office workers develop
MSDs each year as well. According to Hargraves et al., “most people who work in
an office know a coworker who has experienced chronic pain or they have
experienced it themselves” (p.365 Hargraves et al., 1992). People who sit at a
computer each day are exposed to awkward static postures that can affect the upper
back, hand, and wrist. MSDs in the office environment more than doubled each year
from 1988 to 1992 (BLS, 1994). Between 1988 and 1993 there was a 1000%
increase in the number of reported cases of carpal tunnel syndrome (CTS), which is
associated with keyboarding tasks (BLS, 1993). In 2003, approximately one quarter
of all carpal tunnel cases involving days away from work were caused by repetitive
typing or keyentry (BLS, 2003). In order to prevent hand/wrist injuries in the office
environment, it is important to understand the causes of these injuries.
There are three main types of hand/wrist region MSDs: carpal tunnel
syndrome (CTS), hand/wrist tendinitis, and hand-arm vibration syndrome. Hand-arm
vibration syndrome is caused by vibration in the hand/arm from things such as
vibrating tools, but it is not a concern with computer work. Hand/wrist tendinitis is
inflammation, irritation, and/or swelling of a tendon (NIOSH, 1997-1); it is caused by
Finally, CTS is compression of the median nerve at the wrist, and symptoms of CTS
include numbness, tingling, weakness, and/or muscle atrophy in the hand and finger;
force, repetition, and vibration can all contribute to cause CTS (Atencio, 1993;
NIOSH, 1997-1). CTS is actually the most frequently reported “disorder associated
with repeated trauma” (NIOSH, 1997-1). CTS starts with tendinitis (inflamed
tendons), and when these inflamed muscles and tendons go through the carpal
tunnel, they put pressure on the nerves in the wrist. This added pressure can pinch
a nerve (median nerve) and this can cause pain, weakness, tingling, and numbness
in the fingers and hand. Treatments for CTS include: wearing wrist splints at night,
modifying the work area, job rotation, prescribed anti-inflammatory drugs, and
surgery if the case is severe (Atencio, 1993).
There are a number of studies that have explained the relationship between
office work and upper extremity MSDs. Gerr et al. followed 632 individuals for three
years in jobs requiring 15 hours or more hours each week of computer use.
Workers’ daily diaries followed work practices and incidence of musculoskeletal
pain, and more than 50% of computer users reported musculoskeletal pain within
the first year. Computer usage higher than 15 hours per week can contribute to
MSDs affecting the upper extremity, shoulder and neck region (Gerr et al., 2002).
However, it is difficult to completely estimate computer usage since many people are
using a computer at home and at work.
Awkward static and dynamic postures can lead to upper extremity disorders.
The complex structure of the wrist allows for a wide range of movement, which also
position, the tendons are only exposed to tensile load, but when the wrist is bent
there are also compressive and frictional forces (Keyserling et al., 2000). The
pressure inside the carpal tunnel is elevated when the wrist is extended, ulnarly
deviated, or the forearm is pronated past 45° (Marklin and Simoneau, 2001; Serina
et al., 1999). A review of 39 epidemiological studies investigating the connection
between computer use and MSDs concluded that postures specific to computer
workstations such as placing the keyboard below elbow (elbow at 90 degrees or
greater), limiting head rotation, and resting the arms can lead to reduced risk of
neck/shoulder injuries (Gerr et al., 2006). Minimizing ulnar deviation of the wrist and
keyboard thickness appears to result in reduced risk of hand/arm outcomes (Gerr et
al., 2006). Since the use of computers is prevalent, it is necessary to learn more
about prevention of musculoskeletal problems.
1.2 Office Environment
A properly designed computer workstation is one key to reducing risk of
occupation related musculoskeletal problems in the office environment. Risk factors
that may negatively affect health are: working positions, workstation components,
and work process. OSHA has developed a workstation checklist so anyone can
generally evaluate his or her own workspace. Overlooking any of these components
in workstation design can be detrimental to employees’ health (OSHA, 2004;
Sanders and McCormick, 1993).
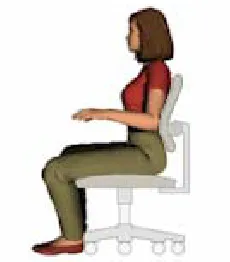
Proper workstation setup includes correct posture and correct support in
order to promote a neutral body position. If the body is neutrally aligned, muscles
angles (elbow joint, hip joint, knee joint), so forearms and thighs are almost parallel
to the floor. The head should be relaxed and in line with the torso. The back and
thighs should be supported with proper cushioning. Feet should be flat on the floor
or on a foot rest (Figure 1).
Figure 1: Correct posture for seated work environment (OSHA, 2004)
Workstation components such as monitors, keyboards, mice, and chairs
should be positioned to support a neutral posture. That means the most used
components should be closest to the body in order to reduce awkward postures
while reaching. Monitors should be placed so that the top of the monitor lines up
with a 0-20° line of sight to reduce neck flexion. As mentioned earlier, chairs and
keyboards should be placed at a height in order to produce 90° angles with the body
(a neutral posture). Furthermore, high frequency typists should consider keyboard
height and placement distance to minimize frequent and awkward reaches.
Finally, computer workstation users should know how to recognize task
hazards and warning signs of musculoskeletal problems. Even if computer
workstations are set up correctly, typists may still be affected by long periods of
such a large part of our culture that most people accept possible risk associated with
computer work because of the normalcy of the task (OSHA, 2004).
1.3 Overview of Ergonomic Interventions for Office Environment
There are several types of ergonomic intervention strategies for office work,
but the main goal of any intervention is to improve the health and safety of
employees in the workplace. The recommended order of implementation of
ergonomic interventions is engineering controls, administrative controls, and
personal protective equipment (Goetsch, 2005). Engineering controls are executed
by transforming the problem at the source by changing the workstation, changing the
tool, or changing the task to better protect workers. Preventing a problem at the
source is the best way to keep people safe in the workplace. However, it is not
always feasible or cost-efficient to change the problem at the source, so changing
the worker’s job through administrative controls or adding personal protective
equipment are other possible strategies. Administrative controls are policies that are
implemented in the workplace to limit employee exposure to potentially harmful
conditions (Goetsch, 2005). No matter what type of ergonomic intervention is
implemented, the goal is still the same: to reduce exposure to recognized risk factors
for MSDs.
1.3.1 Administrative Controls
Administrative controls are an important type of ergonomic intervention for the
workplace since many MSDs can be caused by long time periods of repetitive
motions (e.g. typing). Examples of administrative controls are required rest breaks,
micro breaks, and stretch breaks for increased blood flow. Perhaps the most
important administrative standard is to educate employees about ergonomic
workstations, MSDs, early warning signs, and preventative solutions (Goetsch,
2005; OSHA, 2004). Some companies simply post signage with proper workstation
setup, a list of stretches, and warning signs such as pain and weakness in the
wrists. Simple practices can be implemented to help keep employees healthy.
1.3.2 Engineering Controls
There are a number of engineering controls that can be applied to computer
workstations. It is important for people to carefully setup a workstation since 8 hours
or more each day are spent working there. The components within the workstation
that can be added, moved and/or changed are: monitor, keyboard, mouse,
wrist/palm rest, document holder, desk, chair, new lighting, and telephone (Aaras et
al., 1998; NIOSH, 1997-2; OSHA, 2004). Objects used most frequently should be
placed in close reach. Improper placement of any of these components can cause
awkward postures, repetition, and contact stress. Aside from relocating items in the
workstation, objects can also be changed. Among the most common changes are
keyboards, chairs, and lighting (Aaras et al., 1998). Alternative keyboard designs
are an interesting ergonomic intervention and are the focus of the current study.
1.3.3 Keyboards
Keyboards are the most frequently used computer input device, and most
people have at least some contact with a keyboard everyday. Proper placement
(height and distance), design and use, and key usage are important characteristics
keyboards are posture, discomfort, keying force, and user acceptance (Hargraves et
al., 1992; Sanders and McCormick, 1993).
Alternative keyboard designs can differ from the standard QWERTY keyboard
by physical shape of the keyboard (including slope, lateral inclination, rotation,
splitting keyboard in halves) and physical location of keys (Cakir, 1995). Keys
should be placed in rows to best fit human capacity, and the shape of the keyboard
should reduce tendon workload and awkward static postures. Ergonomic keyboard
designs should efficiently utilize muscles involved in keying, optimize tactile
feedback, reduce static postures, and assist with the visual recognition of keys.
Design factors affecting static postures are: keyboard size and shape, wrist and arm
support, and key layout (Hargraves et al., 1992). Consideration should also be
given to key travel, key shape, inter-key distance, keying frequency, keyboard
shape, and key assignment when considering efficient use of executive muscle
groups (Hargraves et al., 1992). Using the body more efficiently reduces the risk of
overused muscles, thus reducing risk for MSDs.
1.3.3.1 Standard QWERTY keyboard
The standard QWERTY keyboard refers to both the Q-W-E-R-T-Y layout of the
keys and the standard flat profile of the keyboard. The QWERTY key layout was
developed over 100 years ago to deliberately slow typists because the mechanical
machinery in a typewriter could not keep up with typists’ speed (Dvorak, 1943).
Sholes developed the standard QWERTY keyboard expecting typists to “hunt and
Therefore, the design parameters for the original typewriter keyboard are obsolete in
today’s society (Gopher and Raij, 1988).
The main design problems of the standard QWERTY keyboard are poor shape
(single plane profile of the keyboard) and poor key allocation. Both problems
promote awkward postures that can lead to MSDs. Because the standard QWERTY
was designed for one or two finger typists, the keyboard does not efficiently assign
keys to fingers and some fingers are overworked (Dvorak, 1943); the weaker (left)
hand and weaker fingers typically type the most commonly used letters (Sanders
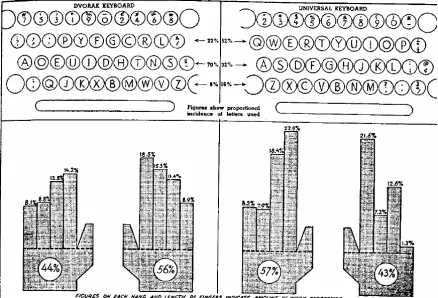
and McCormick, 1993; Dvorak, 1943). Only 32% of typing is done on the home row
of the standard QWERTY keyboard (52% on upper row and 16% on lower row). A
more efficient keyboard would place the most used letters on the home row (Dvorak,
1943).
The profile of the standard keyboard promotes awkward postures such as
abduction of shoulders, pronation of forearms, extension of wrists, and ulnar
deviation of wrists shown in Figure 2 (Fagarasu et al., 2005; Hargraves et al., 1992;
Simoneau et al., 1999; Simoneau et al., 2003; Swanson et al., 1997). Simoneau et
al. 1999 examined 90 office workers to quantify the wrist and forearm postures of
conventional keyboard users and found that wrist position was far from neutral. For
the left wrist, typing posture resulted in a mean ulnar deviation of 15°, mean wrist
extension of 21°, and mean forearm pronation of 62°. For the right wrist, typing
posture resulted in a mean ulnar deviation of 10°, mean wrist extension of 17°, and
mean forearm pronation of 66° (Simoneau et al., 1999; Simoneau et al., 2003).
will exploit muscle force capability; the flat, non-adjustable shape of the standard
keyboard does not effectively use the length-tension relationship in muscle force
generation (Hargraves et al., 1992). Several alternative designs have been
designed to address these problems, and are outlined in the following sections.
Figure 2: Postures promoted by the standard, flat keyboard (NIOSH, 1997-2) 1.3.3.2 Fixed Split Keyboard
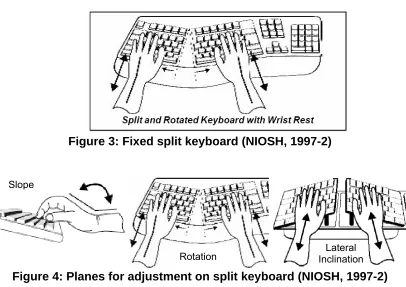
The most basic alternative keyboard is a fixed split QWERTY keyboard
(Figure 3). The keyboard is split into two halves separated at the B-N, G-H, and T-Y
character keys and angled to form a slight v-shape. Split keyboards can differ from
standard keyboards on three planes: lateral inclination, rotation, and slope shown in
Figure 4 (Swanson et al., 1997). The goal of changing lateral inclination is reduction
of forearm pronation, the goal of changing the rotation angle is a reduction of ulnar
deviation, and the goal of changing the slope angle is a reduction in wrist extension
(Marklin et al., 2004). Several combinations of angle adjustments to each of these Shoulder
Abduction Ulnar Deviation
Wrist Extension
planes have been tested (Baker and Cidboy, 2006; Cakir, 1995; Fagarasanu et al.,
2005; Honan et al., 1995; Marklin et al., 1999; Nakaseko et al., 1985; Rempel et al.,
2007; Simoneau et al., 1999; Simoneau et al., 2003; Smith et al., 1998; Zecevic et
al., 2000).
Figure 3: Fixed split keyboard (NIOSH, 1997-2)
Figure 4: Planes for adjustment on split keyboard (NIOSH, 1997-2)
Typing postures on the standard keyboard are far from neutral, and these
awkward postures can be avoided with a split keyboard. Split keyboards that either
open to shoulder width or have a rotational angle of 10°-12.5° (Figure 3) position the
wrist with neutral unlnar/radial deviation (Fagarasanu et al., 2005; Honan et al.,1995;
Marklin et al., 2004; Zecevic et al., 2000). Fagarasanu et al. tested 30 subjects who
could type at least 25 words per minute on 2 split keyboards, one fixed split
keyboards with a rotational angle of 10°-12.5°and one contour split keyboard. They
found these alternative keyboards promoted more neutral wrist ulnar/radial deviation
(2005). In addition, a downward slope angle of 7.5° neutralizes wrist extension, and
Slope
a lateral angle of 20°-30° reduces forearm pronation (Marklin et al., 2004). Postural
benefits also lead other benefits such as increased comfort and decrease muscle
activity.
Neutral wrist postures correspond to decreased muscle activity in the
hand/wrist area and upper back (Marklin et al., 2004; Szeto and Ng, 2000). Szeto et
al. tested10 subjects who typed for 30 min and found the normalized RMS values of
EMG on the extensor carpi radialis was 7.4% MVC for the split keyboard and 8.1%
MVC on the standard keyboard; the extensor carpi ulnaris EMG values were 9.4%
with the split keyboard and 10.5% with the standard keyboard (Szeto and Ng, 2000).
Extensor carpi ulnaris muscle activity was significantly lower on the fixed keyboard,
but there was no significant difference in muscle activity for the extensor carpi
radialis. These muscles are important in maintaining static wrist posture, while the
flexor digitorum sublimis, flexor digitorum profundus, and extensor digitorum
communis are prime movers of finger joints. In addition to the hand muscles, slight
but significant decreases in muscle activity in upper trapezius and anterior deltoid
have been reported for a fixed rotational angle keyboard (Strasser et al., 2004).
Since split keyboards can improve wrist postures and decrease muscle
activity, corresponding decreases in pain and increases in comfort have been found.
Cakir tested 26 subjects with two split keyboards with varying angles of rotation and
found that both setups improved postural comfort, but most users needed up to 2
weeks to feel completely comfortable with the design (1995). Tittiranonda et al.
found that 80 computer users with MSDs using alternative keyboards in the
However, Swanson et al reported no significant differences in discomfort between a
standard keyboard and alternative keyboards over a two day period, but reported
discomfort was low in general (1997). Level of discomfort reported varies with the
experience and health of the subject.
Split keyboards generally have ergonomic benefits over the standard flat
keyboard, but these improvements usually come with some short-term decrease in
productivity. Faragasanu et al. tested 30 subjects and found that when typing with
the fixed split keyboard it reduced mean typing force by 58%, and after only 8 hours
of training, subjects were able to type at 89% of their productivity on a standard
QWERTY keyboard (2005). Skilled typists can regain productivity losses on split
QWERTY keyboards typing within 10% of baseline productivity in several hours
(Fagarasanu et al., 2005; Swanson et al., 1997; Zecevic et al., 2000). Fifty female
clerical workers were able to type near initial QWERTY speed (within 10%) after a
two day testing period (Swanson et al., 1997). After 10 hours of training, 16 subjects
were able to type at 89% productivity (Zecevic et al., 2000). Little time is needed to
regain typing speed on alternative keyboards, and typists may even be able to
surpass QWERTY typing speed given the postural benefits of alternative keyboards.
1.3.3.3 Contoured Fixed Split
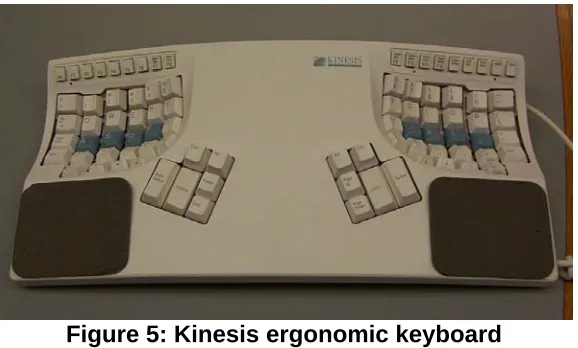
The contoured split keyboard is another alternative to the standard keyboard.
The keyboard is split into two halves at shoulder width distance and keys are
physically located in a bowl shape (Figure 5). The concave bowl shape was created
to minimize travel distance for the fingers while placing the hands in a more neutral,
Figure 5: Kinesis ergonomic keyboard
The contour split keyboard has a unique shape that places the hand and wrist
in a more neutral posture. It has been subjectively rated higher for comfort and
preferred by typists over the standard keyboard (Chen et al., 1994; Smith and
Cronin, 1993). Chen et al. tested 11 subjects with 4, 5 minute trials. Although
subjects typed slower on the contour split keyboard than the QWERTY keyboard, it
was subjectively rated higher for comfort. Furthermore, Smith and Cronin (1993)
tested 25 subjects who could type at least 45 wpm with random letter typing for 2
hours. These subjects also preferred the contour split keyboard more than the
QWERTY keyboard for comfort and usability. In the same Fagarasanu et al. study
mentioned earlier (section 1.3.3.2), mean typing force was reduced by 42% for the
contoured split keyboard compared to the standard keyboard (Fagarasanu et al.,
2005). In the same Smith and Cronin study, 11 of the 25 subjects were tested for
muscle activity in the extensor carpi ulnaris (used for ulnar deviation), flexor
digitorum sublimis, and extensor digitorum (used for hand extension), pronator radii
teres (used for pronation), and the deltoid. All muscles showed lower activity when
using the contour split keyboard, but muscle activity in the extensor carpi ulnaris and
6 professional typists on 24, five minute trials. The muscle activity in the flexor carpi
ulnaris, the extensor carpi ulnaris, the extensor digitorun communis, and the flexor
digitorum sublimus was measured, and muscle activity in all of these muscles was
significantly lower using the contour split keyboard than the QWERTY keyboard.
Therefore, muscle activity in the muscles used for ulnar deviation and hand
extension was significantly lower when using the contour split keyboard (Gerard et
al., 1994; Smith and Cronin, 1993). The contoured split keyboard is another
alternative to the standard QWERTY keyboard because it promotes a neutral wrist
and hand posture, but users generally need more time to adjust to the shape of the
keyboard than that of the fixed split keyboard (Fagarasanu, 2005; Smith and Cronin,
1993).
Several studies have reported typing speed on the contour split keyboard.
Six professional typists were able to type with 72% of baseline QWERTY speed after
23 five minute trials (115 minutes) (Gerard et al., 1994). However, in another study,
during pilot work 5 test subjects who were able to type 45 wpm or more were able to
type at 86% productivity within an hour of using a contour split keyboard (Treaster et
al., 2000). The unique shape of the contour split keyboard may impose initial typing
challenges, but experienced typists can regain speed quickly and experience
postural benefits (Gerard et al., 1994; Treaster et al., 2000). Initially, typing speed
slows and error rate increases while typing on a contour split keyboard, but these
improve with more experience (Chen et al., 1994; Fagarasu et al., 2005; Smith and
1.3.3.4 Dvorak keyboard
The two keyboards described in the previous two sections have different
physical geometry than the standard keyboard, but still maintain the QWERTY
layout of the keys. The Dvorak keyboard, on the other hand, has the same physical
shape as the standard keyboard, but letters are in different locations. Any keyboard
can be changed to a Dvorak keyboard layout by placing tabs over keys and
adjusting computer settings to reflect the Dvorak layout. Unlike the other alternative
keyboards in this study, there is no research on the ergonomic benefits of using the
Dvorak keyboard layout. No studies were found that specifically measured
improvements in hand posture and muscle activity. Most Dvorak keyboard studies
are more concerned with efficiency of typing.
Fifty years after the Sholes keyboard layout was established (the QWERTY
design), August Dvorak realized that the placement of letters was obsolete because
typewriter technology had advanced and machinery was able to keep up with
exceptional typists (>100wpm). Therefore, he sought to design a more logical and
efficient key layout. The simplified Dvorak keyboard was designed on the basis of
data relative to the frequency of use of different letters and the frequency of two,
three, four, and five letter sequences. All vowels and most frequently used
consonants are on the home row of the Dvorak layout. This allows for faster typing
since there is a high probability of vowels and consonants alternating (Martin, 1972;
Dvorak, 1943). With the Dvorak keyboard layout, the right-hand does 56% of the
typing versus 43% on the standard keyboard. Furthermore, 70% of typing is
fingers. Figure Figure 66 show how fingers are loaded with the Dvorak layout and
the QWERTY layout. Typing errors with the Dvorak layout typically occur for long
words with complicated spelling. Dvorak claimed that his keyboard layout could
improve typing speed by 35%, and typists surveyed agreed they would not go back
the QWERTY layout after learning the Dvorak layout (Dvorak, 1943). However,
Norman and Fisher had 12 university students who could type 25 words per minute
or less type 10 minute trials on each of three alternative alphabetical keyboards. On
the Dvorak keyboard layout, subjects only typed about 5% faster than the standard
QWERTY keyboard (1982). These authors concluded while novice typists may gain
from the 5% increase in typing speed, it may not be as worthwhile for expert typists
to invest time in learning the Dvorak layout (Norman and Fisher, 1982).
Although Dvorak proved his layout to be superior to the QWERTY layout, it
was unfortunately never accepted by the general population. Most people would
have to relearn this layout and many are unwilling to do so. Visual search time of
unfamiliar organization of keys has a greater effect on search time than placing
several letters on each key (e.g. cell phone), so a new Dvorak keyboard user’s
typing speed will most likely be slowed by large visual search time (Sears et al.,
2001). Although the Dvorak keyboard layout reduces finger travel and promotes
faster typing speeds, there is little research to prove the ergonomic benefits of
learning this new layout.
1.3.3.5 Chord Keyboard
The chord keyboard has both a unique location for keys/letters and a unique
physical shape as compared to the standard QWERTY keyboard. Chord keyboards
have far fewer keys than the standard QWERTY keyboard. On a chord keyboard,
each letter has a specific key combination (single key or multiple keys) that are
simultaneously pressed, similar to chords in music. Several different chord
keyboards have been developed and tested (Beddoes and Hu, 1994; Eliam, 1989;
Gopher and Raij, 1988; Kroemer et al., 1992). Chord keyboards can either be
one-handed or two-one-handed, but most models are designed for one-hand use.
Although the chord keyboard is distinctly different from the standard
QWERTY keyboard, the design principles address some of the fundamental
problems of the standard keyboard and allow for a larger range of users. The chord
(talk on phone, etc); also, it allows people with one limb to type all keys with
one-hand users. Fingers always rest on home keys and do not move, as compared to
the QWERTY which requires complicated finger and hand paths. Since chord
keyboards are also small, they take up less desk space and are more transportable.
The spatial patterns for the chord keyboard are organized guidelines and less
complicated to identify and memorize; they also have many internal overlaps that
assist in their reconstruction as opposed to the QWERTY keyboard that is
composed of several isolated elements (Gopher and Raij, 1988; Hargraves et
al.,1992; Noyes, 1983). The shape and key allocation on the chord keyboard are
distinctly different than the standard QWERTY keyboard.
Most research on chord keyboards focuses on performance. In one study,
ten subjects from the university population were able to memorize 59 chords for a
two-handed chord keyboard (eight keys, one for each finger) within about 3 hours.
Subjects attended 2 hour sessions each day for two weeks; the first week was the
learning phase, and the second week was the testing phase. The average typing
speed after 40 trials with 400-500 characters was 70 characters per minute
(Kroemer et al.,1992). The same keyboard was used for a one-handed chord
keyboard study (the left side was disabled), and five subjects were taught 18 chords.
After an initial training phase, subjects were able to reach a typing speed of 170
characters per minute (cpm) after 60 hours of use (McMulkin and Kroemer, 1994).
On a two hand chord stenograph with 10 keys (one for each finger and thumb), five
of training. These typing speeds were approximately within 10% of the subjects’
typing speeds on the QWERTY keyboard (Beddoes and Hu, 1994).
Subjects with no typing experience have also been investigated for chord
keyboard typing efficiency. Gopher and Raij tested fifteen subjects with no typing
experience and placed them into one of three groups: QWERTY, one-handed chord
keyboard, two-handed chord keyboard (the two-handed chord was two separate
one-hand chord keyboards, each could stand on their own). After 35 one-hour
training sessions, chord users could type 160 cpm (about 32 wpm) while QWERTY
users could only type about 105 cpm. For subjects with no typing experience, the
chord keyboard had a higher learning curve than the QWERTY keyboard (Gopher
and Raij, 1988). The chord keyboard has many benefits over the QWERTY,
especially for people with no typing experience.
1.3.3.6 Challenges with New Keyboards
One of the main objectives of this study is to provide insight into why
alternative keyboard are not used. Although there were several alternative keyboard
designs available, the QWERTY keyboard was standardized in 1966 (Hargraves et
al.,1992). The main reasons alternative keyboards have not been adopted are: cost,
initial productivity decrements, the learning process, and perspective of the user
(Gopher and Raij, 1988; Hargraves et al.,1992). Alternative keyboards are often
considerably more expensive than flat QWERTY keyboards, so postural benefits
must be shown to prevent injury or increase productivity to provide justification for
the initial keyboard cost. As presented in the previous sections, research has shown
is a much larger population of keyboard users now than when many alternative
keyboards were introduced, and if the QWERTY remains the standard keyboard the
cases of MSDs, specifically CTS, will most likely continue to grow.
Since the QWERTY keyboard is the standard, most people have invested
time in learning and typing proficiently with it and are resistant to learn a new skill
since the standard keyboard is sufficient (Eliam, 1989). The transition to a new
keyboard is more difficult for skilled typists than novice typists because they have to
learn new motoric patterns (Cakir, 1995; Gopher and Raij, 1988; Martin, 1972).
Most studies reported subjects typed the fastest on the standard QWERTY
keyboard. Therefore, it is important to study the learning curve for alternative
keyboards to quantify the learning process and to assess the costs and benefits
associated with implementing alternative keyboards.
1.4 Learning Curve Theory
When a novel task is performed repeatedly, an individual acquires
experience. According to Teplitz, experience is a result of the following: becoming
familiar with the task, becoming familiar with the procedures and interactions with
other objects, improved manual dexterity, developing shortcuts to the task at hand,
developing a rhythm and pattern to the task, and reduced occurrences of stop and
start actions caused by errors in quality (Teplitz, 1991). Learning curve theory
provides a structured, mathematical approach to predicting how task time decreases
with more repetitions. It can be used to show how long it will take for a person to
learning time lengthens. The general learning curve calculation used to calculate
the rate that a worker learns to complete a task is (Konz and Johnson, 2000):
Yx=KXN
Learning rate: 2N
Yx: production time for Xth unit in sequence
K: time required for first unit
N: exponent leading to learning rate (2N)
X: number of production units
Most tasks have elements of both cognitive and physical learning. Dar-El et
al. (1995) suggested a dual-phase learning model where in the early stages of the
model, cognition is the dominant factor; in later stages after more repetitions,
physical skills are the limiting learning factor. In this particular model, the learning
constant is not fixed, making the model complicated. While distinguishing cognitive
and physical learning in a model may be quite useful, the authors indicate that a
single and less complicated learning model could also explain the results (Dar-El et
al., 1995).
Productivity is important in manufacturing, and therefore several learning
rates for manufacturing tasks have been quantified in literature. The best estimate
for cognitive learning rate is .7, while physical is .9, but the combined learning rate is
somewhere in between (Konz and Johnson, 2000). For example, sorting cards into
compartments has a learning rate of .83 (83%), while machining and fitting small
casting has a learning rate of .74 (74%). In manufacturing where speed is very
processes needed to be studied to possibly improve efficiency (Konz and Johnson,
2000). In the same way, it is important for office workers to interact with
environment in a way to maximize comfort and efficiency.
Researchers have quantified productivity of typing on alternative keyboards
against a baseline QWERTY measure, but none have linked learning rates to
physical, cognitive, and/or perceptual demands with learning rate. Dvorak
extensively studied his new keyboard layout and the acquisition of that typing skill
set, but technology and keyboard user population have changed since his research.
Some chord keyboards have been studied with regard to learning rate, and have
been graphically expressed, but researchers have not specifically quantified a
learning rate with the learning curve formula (Gopher and Raij, 1988; Kroemer et al.,
1992). Furthermore, some researchers have produced a best fit curve to the
productivity curve to predict learning rate (Gerard et al.,1994; McMulkin et al.,1992).
Therefore, this study will formally evaluate learning rate for four alternative
keyboards.
1.5 Objectives of This Study
The objective of this study is to quantify learning rates for four alternative
keyboards (fixed split, contour split, chord, and Dvorak) and understand how
physical, cognitive, and perceptual demands affect learning rate by quantifying these
measures.
Cognitively demanding tasks generally have slower learning rates than more
physical tasks, and since the key allocation is unique on the Chord and Dvorak
than the two alternative QWERTY keyboards. Physically demanding tasks have a
learning rate close to 0.9, and since the physical location of the keys on the split
keyboard is only slightly different than the standard keyboard, it is hypothesized that
2. Methods
2.1 Subjects
Twenty-five subjects (14 male, 11 female) were recruited from the university
population through word of mouth. Subjects ranged in age from 18-30 with an
average age of 24 years. The subjects were required to sign a university approved
Informed Consent Form (see Appendix A). All subjects were right-handed with
20/20 or corrected 20/20 vision. Potential subjects were excluded from study if they
had current or chronic back, shoulder, neck, or wrist pain. To reduce variability in
the data, subjects were required to be proficient typists and type of at least 25 words
per minute (Fagarasanu et al.,2005; Szeto et al., 2000); proficient typists were
assumed to be at steady state in QWERTY typing ability.
2.2 Equipment
2.2.1 Testing Equipment/ Keyboards
Subjects were tested on five keyboards for this experiment (Figure 7): 1)
standard QWERTY keyboard, 2) fixed split keyboard (Microsoft Natural, Microsoft
Corporation, Redmond, WA), 3) split contoured keyboard (Kinesis Ergonomic
keyboard, Kinesis Corporation, Bothell, WA), 4) Dvorak keyboard, and 5) chord
keyboard (BAT personal keyboard by Infogrip, Inc., Ventura, CA). The workstation
was setup according to HFES/ Standards (ANSI), and subjects were given foot rests
as needed (Figure 8). The fixed split keyboard (Microsoft Natural) has a split/
ergonomic keyboard) had a split/ rotational angle of 12°, lateral inclination 20°, and
has 27cm between keypads for each hand.
Figure 7: Five keyboards were used in this study: standard QWERTY (not pictured), chord (top left), contoured split (top right), Dvorak (bottom left),
fixed split (bottom left)
2.2.2 Data Collection Equipment
The typing trials were performed on a computer using the freeware typing
program Stamina 2.0. After each trial, the experimenter recorded completion time
(minutes, seconds), error percentage, and typing speed (characters per minute).
The Stamina 2.0 software forces the typist to type the passage correctly. The
passage moved across the screen in a line as typing progressed, and no movement
occurred if the wrong key was pressed. The trial passage contained 225 characters
including spaces and had all letters of the alphabet (according to frequency of use,
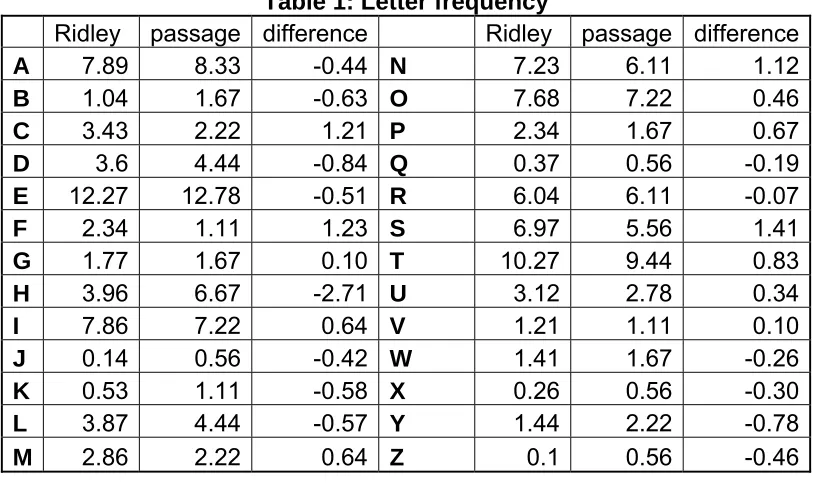
Table 1), two commas, and three periods (Ridley et al.,1999). Table 1 shows the
percentage of letter use in written work (Ridley et al., 1999), the percentage of letter
use in the actual passage, and the difference between the two.
Table 1: Letter frequency
Ridley passage difference Ridley passage difference
A 7.89 8.33 -0.44 N 7.23 6.11 1.12
B 1.04 1.67 -0.63 O 7.68 7.22 0.46
C 3.43 2.22 1.21 P 2.34 1.67 0.67
D 3.6 4.44 -0.84 Q 0.37 0.56 -0.19
E 12.27 12.78 -0.51 R 6.04 6.11 -0.07
F 2.34 1.11 1.23 S 6.97 5.56 1.41
G 1.77 1.67 0.10 T 10.27 9.44 0.83
H 3.96 6.67 -2.71 U 3.12 2.78 0.34
I 7.86 7.22 0.64 V 1.21 1.11 0.10
J 0.14 0.56 -0.42 W 1.41 1.67 -0.26
K 0.53 1.11 -0.58 X 0.26 0.56 -0.30
L 3.87 4.44 -0.57 Y 1.44 2.22 -0.78
M 2.86 2.22 0.64 Z 0.1 0.56 -0.46
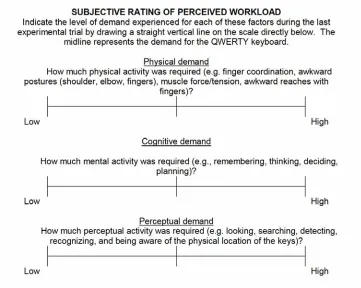
Subjective assessment data (Figure 9) were also collected. Subjects were
asked to rate each alternative keyboard in comparison to the standard keyboard on
demand (see Appendix B). The survey was based on the form of the NASA-TLX
questionnaire (Hart and Staveland, 1988). Subjective assessments have previously
been adapted from the NASA-TLX (Ma, 2002). The visual analog scale was five
inches long, and a midline at 2.5 inches represented the QWERTY keyboard (any
score above 2.5 is rated “higher” in demand than the QWERTY keyboard and any
score lower than 2.5” is rated “lower” in demand than the QWERTY keyboard).
Figure 9: Subjective assessment of perceived workload 2.3 Experimental Design
2.3.1 Independent Variables
There was one independent variable, (KEYBOARD type) with four levels:
2.3.2 Dependent Variables
The dependent variables in this study were: learning rate and demand.
Cognitive demand, physical demand, and perceptual demand were all investigated.
2.4 Protocol
Each experimental session lasted approximately two hours. Sixteen subjects
participated in the learning rate generation protocol, while nine more participated in
the learning rate verification protocol. The experimental protocol checklist and
experimental explanation are presented in Appendix C. Upon arrival, the subject
was given a brief overview of the study objectives and protocol and was asked to
sign the informed consent form. The experimenter confirmed that the subject was
eligible to participate.
After the subject signed the informed consent form, the experimenter setup
the adjustable workstation appropriately for each subject (using ANSI 100
guidelines). The subject was seated at 90° angles for the back, elbow, and knee.
The top of the screen was adjusted to be in line with the horizontal line of sight.
Footrests were supplied if needed. The experimenter explained the protocol in more
detail. Once the subject understood how to use the typing program, experimentation
began.
Each subject typed the same three sentence passage with Stamina 2.0
software for every typing trial. Subjects typed the same passage so only keyboard
learning rate was assessed (and not the learning time for becoming familiar with the
passage). Before typing trials, the subject was given one minute to review the
QWERTY keyboard and to type as quickly as possible in order to record a baseline
QWERTY typing speed and allow the subject to memorize the typing passage. The
subject was given 15 seconds rest between each typing trial. Once the subject
finished the typing trials on the standard QWERTY keyboard, the subject typed the
same passage five times on each alternative keyboard (order of keyboard
presentation was completely randomized). The subject was briefly instructed on
how to use each keyboard and was given a “cheat sheet” showing specific letters
represented on each key for both the Dvorak and chord keyboards. After each set
of five trials, the subject completed a survey (Appendix B) and was then given 3
minutes rest.
2.4.1 Part 2: Learning Rate Verification
Nine additional subjects were asked to participate in testing to verify that five
trials were sufficient for learning rate calculations. Each subject performed 10 trials
on the QWERTY keyboard and 20 trials on one alternative keyboard. The subject
was given 15 seconds rest after each trial and 3 minutes in between each keyboard.
The subject was given one additional minute after each set of five trials on the
alternative keyboard. Three alternative keyboards were tested (chord, Dvorak, and
contour split) but each subject only experienced one alternate keyboard. The fixed
split keyboard was not used for this experiment as the learning rate because
subjects could type within 5% of baseline QWERTY speed with only five trials.
2.5 Data Processing
2.5.1 Learning Rate
Learning rate represents the change in task performance time as a function of
trial number. The standard calculation for learning rate was used, where the time for
trial 1 and time for trial 5 are used to create the learning curve (Konz and Johnson,
2000) as calculated from the time-to-complete data. Here is an example of how
learning rate was calculated for this experiment:
Yx=KXN
Learning Rate: 2N
Yx: production time for Xth unit
K: time required for first unit
N: exponent leading to learning rate (2N)
X: total number of units produced
For example, say the time for the first trial is 86 seconds (K=86), and the time for the
fifth trial is 50 seconds (Y=50), the learning calculation is
50=86(5)N
Log(50/86) / Log(5) = N = 0.337
2-0.337=0.79
which is a learning rate of 79%.
2.5.2. Subjective Assessment Data
To provide a subjective assessment of each keyboard, subjects rated each
continuous rating line was five inches, with a midline representing the standard
QWERTY keyboard at 2.5 inches (Figure 10). Each rating was measured from the
midline and given a score ranging from -40 to 40 (80 possible points, each point
representing 1/16 inch from midline). The scores were then normalized for each
subject across each category of demand for all keyboards (Ma, 2002). The largest
deviation from the center point was given a score of 1 (high) or -1 (low) depending
on the direction of deviation. For example, say for a particular subject the survey
score for physical demand on the fixed split keyboard is 1.5” away from the midline
in the negative direction. This would correspond to a score of -24. However, score
with the largest deviation in physical demand was the chord keyboard with a score of
32. Therefore, the physical demand score for the fixed split keyboard would be
-0.75 (-24/32), and the physical demand score for the chord keyboard would be 1
(32/32). Survey scores were normalized in order to reduce subject variability.
Figure 10: Analysis of survey question data
2.6 Statistical Analysis 2.6.1 ANOVA
Analysis of Variance (ANOVA) was used to evaluate the effect of keyboard on
learning rate. All of the analyses were performed with SAS 9.0 (Cary, NC). The
assumptions of ANOVA were tested and confirmed using the graphical approach
described in Montgomery (2004). Three assumption tests were evaluated:
homogeneity of variance, normality, and independence of observation (see
Appendix D results). Homogeneity of variance was tested by plotting predicted
values of learning rate versus residual values of learning rate. These plots must
show no patterns or structure in order to use ANOVA. Normal probability plots of the
residuals were constructed in order to evaluate the distribution of the residuals.
Since the error is normally distributed, the plot resembles a straight line. Finally, the
independence assumption was tested to show proper randomization for the
experiment. The residuals were plotted in time order to ensure no definite trends or
patterns and that the experiment was sufficiently randomized (Montgomery, 2004).
Since the data met the assumptions, in all ANOVA analyses a p-value of less than
0.05 was the standard for significance. A Tukey-Kramer post hoc analysis was
performed to further evaluate keyboard effects.
Learning rate was analyzed with a one-way ANOVA. The linear statistical
model for this experiment was:
Subjects j
Keyboards i
yijk i j ij ijk
, 16 1 , 4 1 ) ( − = − = + + + + =µ τ β τβ ε
This equation represents a mixed model, where τ represents the fixed effect
(keyboard) and β represents the random effect (subject).
2.6.2 Correlation Analysis
Correlation analysis was used to determine how physical demand, cognitive
demand, and perceptual demand related to learning rate. The survey scores were
normalized by category for each subject across all four alternative keyboards. To
examine interactions specifically between physical demand, cognitive demand, and
analyzed. Each survey category (pd, cd, p, pd+cd, pd+p, cd+p, pd+cd+p) was
tested in SAS to find possible correlations between learning rate and demand
3. Results
The range in QWERTY typing speed for all subjects was 170 cpm – 474 cpm (about 34 wpm – 95 wpm, assuming an average of 5 letters per word).
3. 1 Learning Rate
There were no violations for the homogeneity of variance, normality, or independence assumptions. The results of the subsequent ANOVA procedure showed a significant effect of keyboard type on Learning Rate (F=23.25, p<.001) (Figure 11). The learning rate for the split keyboard was 90.4% and significantly different from the learning rates for the other three keyboards which all had learning rates of less than 80% (chord: 77.3%, contour split: 76.9%, Dvorak: 79.1%).
Figure 11: Learning rate by keyboard type. Columns with the same letter were not statistically different.
Figure 12 shows the average time across subjects to complete each trial. The actual values of time for each trial, percent time for each trial, and percent error are in Table 2. The trials for the two keyboards that were not the QWERTY layout (Dvorak and chord) were much slower than the other two alternative keyboards with
0.7
0.75
0.8
0.85
0.9
0.95
Lear
ni
ng R
a
te
Chord
Dvorak
Contour split
Fixed split
B
B
A
the QWERTY layout. The average time for the QWERTY trials was 40.2 seconds,
and the average time for the 5th trial on the split keyboard was 42.4 seconds (only
5% slower than QWERTY).
0 100 200 300 400 500 600 700
1 2 3 4 5
Trial
Average Time
(seconds)
Chord Dvorak Contour split Fixed split QWERTY
Figure 12: Average time to complete trials
Figure 13 shows the average error for each trial. Subjects had much higher error
percentages with the chord keyboard than the other three keyboards. Error rates
declined with each trial on the chord, Dvorak, and contour split keyboards, but there
0 5 10 15 20 25 30 35 40
1 2 3 4 5
Trial
% Error
Chord Dvorak Contour Split Fixed Split QWERTY
Figure 13: Average percent error for each trial
Table 2: Time (seconds), % time, and % error for each keyboard
Chord Dvorak time (sec) % time % error time (sec) % time % error
628 100 37.5 312 100 13.4
465 74.6 29.4 236 71.2 11.7
406 65.2 26.1 210 60.5 10.6
367 58.9 24.1 198 55.1 9.1
346 55.3 23.4 181 54.6 9.4
Contour Split Fixed Split
time (sec) % time % error time (sec) % time % error
126 100. 12.0 54 99.6 5.5
89 76.6 7.7 45 82.5 4.1
76 67.6 5.8 44 82.1 4.8
70 63.7 6.1 43 81.5 4.9
69 58.6 5.2 42 79.2 4.8
Figure 14 shows the percent time to complete each trial, with trial 1 as the slowest
(set at 100%). This shows comparable performance improvements (learning curves)
other three keyboards, so the learning rate is much higher (90%). This means that
fewer trials are needed to reach baseline QWERTY speed on the fixed split
keyboard than on the other three keyboards. The most significant drop in time for
trials one to two is for the Dvorak keyboard (almost 30%).
0 10 20 30 40 50 60 70 80 90 100
1 2 3 4 5
Trial
% Ti
me
Chord Dvorak Contoured split Fixed split
Figure 14: Average time to complete each trial
Figure 15 and Table 3 show data from the second part of experimentation wherein
subjects performed the 20 trials on the three alternative keyboards. The goal was to
compare the calculated learning rate after 5 trials with that of 20 trials to provide
evidence that 5 trials were sufficient to generate a stable estimate of the true
learning rate. Table 3 shows the results of this testing, and these tests confirmed
that for the subjects who complete 20 trials, 5 trials were sufficient because there is
trial, there is less than 2% difference in the mean learning rate of 5 trials and 20
trials.
Table 3: Analysis of learning rate 5 trial 20 trials Learning Rate
Mean St Dev Mean St Dev
p-value
Chord 0.77 0.075 0.78 0.037 0.43
Contour Split 0.79 0.076 0.79 0.053 0.50
Dvorak 0.86 0.048 0.86 0.013 0.46
Figure 15 shows the gradual flattening of the learning curves with more trials. On
the contour split and chord keyboards, the 20th trial was on average 60% faster than
the first trial. This is a large improvement for less than an hour of typing time with
the keyboard. 0 10 20 30 40 50 60 70 80 90 100
1 3 5 7 9 11 13 15 17 19
Trial P e rc ent T im e
Chord
Dvorak
Contour split
Figure 15: Average percent time to complete 20 trials
The time to complete 50 trials and 100 trials was estimated using the learning rates
for each keyboard. Since the average time for subjects on the QWERTY keyboard
was 40 seconds, these results show that given enough practice on the fixed split and
contour split keyboards, subjects could possibly surpass their productivity on the
Table 4: Estimated time to complete
Actual Time Estimated Time
5 trials 20 trials 20 trials 50 trials 100 trials
Chord 346.3 195.0 211.3 153.3 120.8
Dvorak 181.8 138.7 118.4 89.9 73.4
Contour split 69.1 44.0 41.4 29.8 23.3
Fixed split 42.4 -- -- 32.3 29.8
3. 2 Subjective Assessment of Demands
All of the subjective assessment parameters (Table 5) significantly correlated
with learning rate. The negative correlation means that a higher survey score
relates to a lower learning rate. Therefore, more demanding tasks (whether the
challenge is cognitive, physical, or perceptual) correspond to slower learning.
Table 5: Correlation results Correlation
Coefficient
P-value
Cognitive -0.43 <0.001
Physical -0.33 0.0073
Perceptual -0.29 0.0209
Cognitive*Physical -0.45 <0.001
Cognitive*Perceptual -0.41 <0.001
Physical*Perceptual -0.37 0.0023
Cognitive*Physical*Perceptual -0.45 <0.001
There were statistically significant differences in demand for each of the
keyboards (F=11.19, p<0.001). The average normalized survey scores (Table 6:
Average normalized survey scoresTable 6 and Figure 16) show that most subjects
felt the chord keyboard was the most cognitively and physically demanding while the
Dvorak keyboard was the most perceptually demanding. The chord keyboard was
significantly more cognitively demanding than the other three keyboards, and the
contour split and Dvorak keyboards were significantly more cognitively demanding
physically demanding than the fixed split keyboard. Finally, the Dvorak keyboard
was significantly more perceptually demanding than the contour split and fixed split
keyboards. The chord keyboard was also significantly more perceptually demanding
than the fixed split keyboard. The fixed split keyboard was rated to be almost the
same as the QWERTY in every category (score 0), but subjects rated it slightly
physically less demanding than the QWERTY.
Table 6: Average normalized survey scores
Figure 16: Subjective assessment of the physical, cognitive, and perceptual demands as a function of keyboard type
Cognitive Physical Perceptual
Chord 0.88 0.61 0.60
Dvorak 0.49 0.35 0.84
Contour Split 0.35 0.31 0.37
Fixed Split 0.05 -0.06 0.03
-0.2
0
0.2
0.4
0.6
0.8
1
Cognitive Physical Perceptual
Chord
Dvorak
Contour split
Fixed split
4. Discussion
Learning time is often presented as a change in productivity. Productivity is
an important measure for implementing an ergonomic intervention. If the training
time is too long, companies and employees are often not inclined to use
interventions (Reid, 2005). The faster/higher the learning rate for a particular
intervention or the closer it is to 1 (100%), the faster a person will reach steady state
productivity (less training time). While some studies have documented changes in
productivity for each of the different keyboards in this study, no research has
formally applied learning curve theory to alternative keyboards.
The alternative keyboards produced a range of typing speeds. Typing speed
on both the fixed split and contour split keyboards was much faster than typing
speed with the Dvorak and chord keyboards. This is almost certainly a result of the
unfamiliar key layout on the Dvorak and chord keyboards. The fixed split keyboard
had the highest learning rate and smallest productivity decrement with initial use.
The objective of this study was to quantify learning rates for four alternative
keyboards and quantify how physical, cognitive, and perceptual demands affect
learning rate.
4.1 Learning Rate and Subjective Assessment
Learning rate provides a structured, mathematical approach to documenting
how task time lessens with more repetitions of a task. It follows the equation Y=axb .
As the learning process occurs, the amount of progress for each trial lessens, but
each trial takes less time (Teplitz, 1991). In the same way, when people learn to use
rates for each keyboard in this study were documented. The learning rate
percentages for each keyboard were: chord 77.3%, contour split 76.9%, Dvorak
79.1%, and fixed split 90.4%. Previous research has estimated that the learning rate
percentage for a physical task is about 90%, while the learning rate for a cognitive
task is about 70% (Konz and Johnson, 2000). The learning rates for the contour
split, chord, and Dvorak keyboards fall between 70% and 90% meaning that these
are both cognitive and physical learning tasks ranging in complexity. Tasks can also
be categorized as simple or complex, with more complex tasks having lower learning
rates. The learning rates for the current study indicate that the chord, contour split,
and Dvorak keyboards have elements of both physical and cognitive learning, while
the fixed split keyboard can be characterized as a physical learning task. Konz and
Johnson compiled learning rates documented in literature for common tasks (Table
7). Complex tasks such as truck body assembly have lower learning rates, while
physical tasks such as screwdriver work have high learning rates.
Table 7: Learning rates for common tasks
Learning Rate Task Description 68 Truck body assembly
72 Complex 300 hour/unit assembly 80 Precision bench assembly
83 Power sawing
84 Cigar Making
90 Punch press operation
95 Screwdriver work
Since only the physical shape of the keyboard was different (maintained
QWERTY key layout) for the fixed split and contour split keyboards, these were
assumed to be more physical intervention tasks. Given the learning rate of 90.4 %,
task. However, the learning rate for the contour split keyboard was 76.9%, far from
the expected physical task change learning rate of 90%. This might indicate that the
contoured nature of this keyboard required some additional resources beyond a
simple physical learning task.
In addition to the quantification of learning rate, this study also attempted to
quantify the amount of physical, perceptual, and cognitive demand required for
learning each keyboard and tried to relate this demand to learning rate. Demand
was asked in the following way:
• Cognitive Demand: How much mental activity required (e.g.
remembering, thinking deciding, and planning)?
• Physical Demand: How much physical activity was required (e.g. finger
coordination, awkward postures (shoulder, elbow, fingers), muscle
force/tension, awkward reaches with fingers)?
• Perceptual Demand: How much perceptual activity was required (e.g.
looking, searching, detecting, recognizing, and being aware of the
physical location of the keys)?
These survey parameters were adapted from the standardized subjective survey,
the NASA-TLX (task load index) survey. The subjective assessment was presented
as an analog rating scale in order to capture sensitivity within the amount of demand
required for each keyboard. However, in order to tailor the subjective assessment to
this study, a midline representing QWERTY demand was added (Figure 10, Figure