Measurement of chlorophyll fluorescence as a heat stress indicator in tomato: Laboratory and greenhouse comparisons
7
0
0
Full text
(2) (1991), and Burke and Oliver (1993), the objective of this study was to develop a laboratory procedure for measuring the fluorescence response of tomato leaves as a function of temperature. This paper compares measurements made using the laboratory procedure with measurements conducted in greenhouses in an attempt to establish a linkage between the two. The protocols developed to facilitate comparisons between the two types of testing are also discussed. Materials and Methods Fluorescence measurements were conducted in the laboratory facilities of Weaver Laboratories and in the greenhouses at the Horticultural Field Laboratory, both located on the campus of North Carolina State University, Raleigh, N.C. The plants used were ‘Trust’ tomato. A modulated fluorometer (OS-500; Opti-Sciences, Inc., Tyngsboro, Mass.) was used. Before the study could begin, an appropriate measure of fluorescence had to be selected. Fo, the minimal fluorescence yield of a dark-adapted plant with all Photosystem II (PSII) reaction centers fully open, has been used as an indicator of plant stress. Increases in Fo are typically used to determine plant critical limits to high temperature (Havaux et al., 1988; Smillie and Nott, 1979). Measurement of Fo was not considered as an option in this study because Schreiber and Bilger (1987) and Yamane et al. (1997) showed that below 40 °C, the region of interest for this study, Fo increases only slightly with temperature. The ratio of variable (Fv = Fm – Fo) to maximal (Fm) fluorescence of dark-adapted leaves has also been used widely as an indication of plant stress because it is a rapid determination of changes in the maximum quantum efficiency of PSII phytochemistry (Andrews et al., 1995; Fracheboud et al., 1999). Fv/Fm is considered a quantitative measure of maximal or potential photochemical efficiency (Kitajima and Butler, 1975) or optimal quantum yield of PSII (Schreiber and Bilger, 1993). Fv declines with, and Fo increases with, increasing levels of several types of stress (e.g., heat, water, and light) such that Fv/Fm and Fo are generally highly and negatively correlated. Nevertheless, the error in measuring Fv/Fm is less than that in measuring Fo, leading Yamada et al. (1996) to conclude that Fv/Fm is a better choice. Fluorescence yield was another possible option. Yield is measured on a photosynthesizing leaf under lighted conditions (He and Edwards, 1996; Willits and Peet, 1999) and requires no dark adaption period. This approach was considered attractive for the greenhouse tests, where light was available naturally, but it was not well-suited for the laboratory tests where provision for lighting, gas exchange, and temperature control would have to be incorporated into the measurement chamber to accommodate a photosynthesizing leaf under varying temperature conditions. The ratio of variable to minimal fluorescence, Fv/Fo, used by Burke (1990), Ferguson and Burke (1991), and Burke and Oliver (1993) was also considered as an option, but differences in the qualitative behavior of Fv/Fo compared to Fv/Fm, at least below temperatures of ≈40 °C, are quite small (Yamane et al., 1997). Moreover, in the literature Fv/Fm is used more frequently than Fv/Fo. Fv/Fm was eventually selected as the parameter of choice based on a compromise between the simplicity of design needed for the laboratory apparatus and the appropriateness of its use for characterizing heat stress in the greenhouse plants. While it is true that fluorescence yield can be used to estimate photosynthetic rates (He and Edwards, 1996), and thus the photosynthetic activity of the plant, Fv/Fm is a measure of potential photosynthetic rates (Schreiber. and Bilger, 1993) and as such should be a better indication of potential photosynthetic health. LABORATORY TESTS. The laboratory tests were conducted using the apparatus illustrated in Fig 1. The apparatus was designed to accept 1.9 cm diameter leaf discs placed in the measurement chamber on a temperature controlled copper plate, with provision for inserting the fluorescence probe to within a few millimeters of the leaf surface. A foam pad with a hole cut through the center was glued to the end of the probe housing so that it held the leaf in intimate contact with the plate during measurement. A thermoelectric cooler was used to control the temperature using an automatic controller (model 7700; Omega Engineering, Stamford, Conn.) with an accuracy of ±0.5 °C. A 0.13-mm control thermocouple was inserted into a small hole in the center of the copper plate. A 0.076-mm-diameter monitoring thermocouple was soldered to the top of the plate and connected to a digital thermometer (model 2176A; John M. Fluke Co., Everett, Wash.), accurate to ±0.5 °C so that temperature could be monitored independently. When the probe was inserted into the housing, the leaf was contained in a relatively moisture tight space such that discs left in the measurement chamber at room temperature for several days showed no visible signs of desiccation. A further check on desiccation was performed by weighing leaf discs at the end of three separate high temperature tests (at 40 °C), placing the discs in water for 1 h, then reweighing them to determine moisture gain. The largest moisture gain was 3%, the smallest 0.6%. Based on these data, leaf desiccation during the measurement period was considered negligible. Leaves for the laboratory tests were taken from mature ‘Trust’ tomato plants that were ≈3 months old. The plants were grown in the same greenhouse compartments as the greenhouse test plants described below. The plants were seeded in early December 1997,. Fig. 1. Schematic view of the laboratory apparatus used for measuring chlorophyll fluorescence..
(3) transplanted into 0.33-L pots during the first week of Jan. 1998, then transplanted into 19-L plastic bags during the first week of February. Media and fertilization were as described below. The laboratory tests were conducted from 27 Feb. until 16 Apr., during which time the greenhouses operated normally; i.e., as the control house described below. Only leaves from the 10 youngest fully expanded leaves were used in the testing to keep the physiological age of the leaves comparable to that of the greenhouse tests. On test days, a single compound leaf would be cut from a plant, the stem placed in water, and the leaf transported to the lab. The leaf remained in water, on the bench, throughout the testing. A cork borer was used to cut discs from the individual leaflets, as needed, about midway along the leaflet length. Care was taken to avoid cutting the midrib so that discs could be cut from the other side of the leaflet later during the test. Photosynthetically active radiation (PAR) levels (400 to 700 nm) on the bench were quite low, ≈7 µmol·m–2·s–1 as measured using a quantum sensor (model 190; LI-COR, Inc., Lincoln, Nebr.). Plate temperature was set via the automatic controller, the temperature allowed to stabilize, and a disc cut and placed in the chamber. The time of placement was recorded and used to determine the exposure time for each disc. The protocol used initially was patterned after Burke (1990), Burke and Oliver (1993), and Ferguson and Burke (1991). The leaves were given 30 min light pretreatments (750 µmol·m–2·s–1) before placement in the measurement chamber, with Fv/Fm measurements taken every five min from 0 to 30 min after placement. The results were not similar, either quantitatively or qualitatively, to those of the above studies and the noise in the data made the detection of temperature based trends difficult. One possible reason for the dissimilarities may have been that they used much lower saturation intensities (5 W·m–2) and longer durations (10 s) than were possible with our instrumentation. The final protocol we developed for the modulated fluorometer eliminated the light pretreatment, extended the treatment time to 60 min and reduced the number of fluorescence readings on a given sample (one at 30 min and one at 60 min on the same leaf disc). The modulated fluorometer was set up so that modulation intensity was ≈0.3 µmol·m-2·s-1 and saturation intensity was ≈8800 µmol·m-2·s-1 for a duration of 1 s. These values were selected to give traces with rapid rises and flat plateaus. The fluorometer settings used were ≈80 for modulation intensity, 225 for saturation intensity and 75 for gain. GREENHOUSE TESTS. The greenhouse tests were conducted in two identical 5 × 6 m greenhouse compartments capable of independent heating and cooling. To impose heat stress, high temperature regimes were imposed in one of the two compartments using the main and auxiliary heaters, with the cooling set points modified appropriately. The other compartment served as the low temperature, or control treatment, with cooling set points of 23.3, 23.9, and 24.4 °C, respectively, for three stages of cooling. Day/night heating set points were 21/15.5 °C. Daylengths were natural, ranging from ≈9 h in late February to 13 h in mid-May. The average was ≈12 h over the whole period. Carbon dioxide levels in the houses were checked periodically using the analyzers on a portable photosynthesis meter (LI-6400; LI-COR) to ensure that levels were essentially ambient (within 10 mg·L–1 of 350 mg·L–1) at all times. A minimum ventilation rate of 0.25 air change per min was employed to prevent CO2 depletion. The testing ran from 20 Apr. through 15 May, during which time one or the other of the greenhouses operated at elevated temperatures for 9 out of the 26 d. Plants in the same greenhouse were never exposed to high temperatures more often than every 4 to 5 d.. The leaves tested were from 20 tomato plants, seeded in midJanuary 1998, transplanted into 0.33-L pots during the first week of February and then into 19-L bags on 1 Mar. at a density of 10 plants/ house. The bags contained 50% by volume of aged, 95 mm mesh screened pine bark and 50% ProMix BX, a growing medium containing sphagnum peat, perlite, vermiculite, starter nutrients, limestone, and a wetting agent (Premier Brands, New Rochelle, N.Y.). Fertilization was automatic with each watering (four times per day). Concentrations were (in mg·L–1) 165 N, 45 P, 310 K, 155 Ca, and 44 Mg. Before 1 May 1998, 10 fluorescence measurements were made on five plants in each house, two measurements per plant. After 1 May, an additional measurement was added in each house. The clips were applied to leaflets on one of the 10 youngest fully-expanded compound leaves on each plant, selected for full sun exposure. After dark adaption periods of varying lengths (see below), Fv/Fm measurements were made in both houses in a continuous session, taking measurements on the plants in the same order in which the clips were applied. Total measurement time for both houses was on the order of 10 min. The plants were ≈3 months old at the beginning of the tests (21 Apr.) and were ≈1.2 m tall. Leaf temperatures were measured in one of several ways, depending upon the objectives of a particular test. Early tests (before 29 Apr.) used small (0.076 mm) type-K thermocouples glued (see Seginer et al., 1997, for procedural details) to the underside of three leaves on two plants in each house that were not used for fluorescence testing, but which were similarly exposed to those that were. In later tests, six thermocouples in each house were inserted between the back-side of six clips and the enclosed leaves. The results made it clear that leaf temperatures were drastically modified by the presence of the clips. Marler and Lawton (1994) also noted that unshaded leaf temperatures rose rapidly inside their clips; however, their clips were black. Even though our clips were white (OptiSciences, Inc., Tyngsboro, Mass.), leaf temperatures under the clips exceeded those for leaves without clips by as much as 6 °C, even after a relatively short period of time. To alleviate this problem, subsequent tests used clips with a 9.5 mm hole drilled in the back, limiting temperature increases to <2 °C. Thermocouples were placed in the back of three drilled out clips in each house so that the measuring junctions were in contact with the leaflets about in the center of each hole. Three additional thermocouples per house were glued to nearby leaves that did not have clips, but which were similarly exposed. Preliminary measurements of Fv/Fm were made on leaves dark adapted for times ranging from 0 to 30 min in 1 min increments (following Bolhar-Nordenkampf et al., 1989). After 15 min, Fv/Fm became reasonably stable; therefore, 15 min was selected for the initial dark adaption period. Subsequent testing (three tests between 21 and 29 Apr.) produced data which did not correlate well with the laboratory tests. Additional testing pointed to the possibility that the dark adaption times may have been insufficient. In an attempt to bracket appropriate dark adaption times, a test was conducted in which the clips were attached at the beginning of the test and left attached to the same leaves all day. The resulting data (see results below) suggested that an intermediate time would be more appropriate, so 60 min dark adaption times were selected to correspond to those selected in the laboratory tests. The clips were attached at the beginning of the test, left in place for 1 h, then the readings were taken and the clips moved to a different location on the same or adjacent leaves. The plants were grown in containers rather than in the ground, so it was possible to move the plants within a limited area. For all but the last greenhouse test, the plants were.
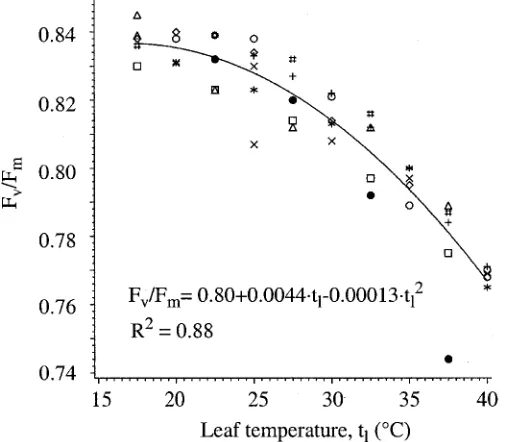
(4) Fig. 2. Laboratory data for 30 min readings. Individual symbols represent readings from individual compound leaves.. a quadratic equation fit both data sets well (R2 = 0.77 for 30 min; R2 = 0.88 for 60 min). The lower R2 for the 30 min readings is the result of a slightly higher level of noise in the data compared to the 60 min readings. In both cases, Fv/ Fm clearly declined with temperature, suggesting the leaf disc experienced increasing levels of heat stress as the plate temperature increased. When the equations were tested for differences, the intercepts were not found to be different but the coefficients for the linear and quadratic terms were (P > 0.95). The 60 min curve declined more rapidly than the 30 min curve, possibly because extended exposure to elevated temperatures increased heat stress. It seems unlikely, based on the end weights of the leaf discs, that tissue desiccation was a factor in this decline. GREENHOUSE TESTS. A representative dataset from the 15 min dark adaption period testing (three tests were done in all) is shown in Fig. 4, where outside solar insolation on a horizontal surface, Fv/Fm, and leaf temperature are plotted against time. All three tests in this group exhibited the same behavior. Initially, Fv/Fm declined rapidly, falling slightly faster in the test house, where leaf temperatures were high, than in the ‘control’ house. Shortly after solar noon, however, Fv/Fm began to recover in the high temperature house while in the control house it continued to fall. Within an hour the curves had crossed, with the plants in the hotter house exhibiting a higher Fv/Fm than those in the control house. At the end of the daylight period, plants in both houses had essentially fully ‘recovered’ from noontime lows (data not presented). A more rapid fall in Fv/Fm at higher leaf temperatures had been expected, but the difference in rate of decline observed was less than expected. Moreover, the more rapid recovery in the higher. Fig. 3. Laboratory data for 60 min readings. Individual symbols represent readings from individual compound leaves.. turned so that the tested leaves were in full sun. In the last test (15 May), plants were turned so that the tested leaves were either on the shaded side of the plant or in the sun, depending upon the leaf temperature desired. STATISTICAL ANALYSES. The GLM procedure of SAS (SAS Inst. Inc., Cary, N.C.) was used to regress Fv/Fm against leaf temperature in the laboratory tests. In the greenhouse tests, the least-squares means option of the GLM procedure was used to test the probability that the Fv/Fm values observed in the test and control houses during any given measurement period were from the same population. Results LABORATORY TESTS. Data for the 30 min readings (Fig. 2) showed more noise than those for the 60 min readings (Fig. 3), but. Fig. 4. Greenhouse data from 21 Apr. 1998. Dark adaption clips were left in place only 15 min. Fv/Fm points are means of 10 leaves on 5 plants. Leaf temperatures are means of thermocouples glued to 3 separate, but similarly exposed leaves. Probabilities that the Fv/Fm pairs are from the same population are shown. The sample leaves in both houses were kept in full sun for the entire day..
(5) temperature house was also not expected. Dynamic acclimation to high temperatures may explain why the high temperature leaves recovered; but it is not clear why the higher temperature leaves began to recover while the lower temperature leaves were still declining. In any event, interpretation of Fv/Fm relative to heat stress was made more difficult by this occurrence, since by earlyafternoon differences in Fv/Fm were opposite those of leaf temperature. Data from the all-day dark adaption test are presented in Fig. 5. The curves did not cross in this case, as they did in Fig. 4, but another problem suggested that shorter times should be used. At the end of the day, at ≈1800 HR, after the temperatures in both houses had been the same for a few hours, Fv/Fm had not yet returned to the starting levels, nor had the plants in the warm house recovered to the level of those in the control house. Leaving the clips in the same place on the leaves all night and taking a set of readings in the morning still showed the same values as the previous night (data not presented). Only when the clips were moved to adjacent portions of the same leaflets, followed by a dark adaption period of 20 min, was the expected recovery seen (data not presented). This suggests that leaving the clips in place all day is inappropriate and may produce spurious results. A typical test in which the clips were moved each hour is illustrated in Fig. 6. These curves are characterized by good separation and no cross-over until the stress was relieved. One notable characteristic, however, is that when leaf temperatures Fig. 5. Greenhouse data from 29 Apr. 1998. Dark adaption clips were left in place all day. Fv/Fm points are means of 11 leaves on 6 plants. Leaf temperatures are means under the clips taken over the periods between fluorescence readings. Probabilities that the Fv/Fm pairs are from the same population are shown for the first seven pairs. For all subsequent pairs, the probabilities were <0.0234. The sample leaves in both houses were kept in the sun for the whole day.. Fig. 6. Greenhouse data from 6 May 1998. Dark adaption clips were moved every hour. Fv/Fm points are means of 11 leaves on 6 plants. Leaf temperatures are means under the clips taken over the 1 h before each fluorescence reading. Probabilities that the Fv/Fm pairs are from the same population are shown. The sample leaves in both houses were kept in full sun for the entire day.. Fig. 7. Greenhouse data from 15 May 1998. Dark adaption clips were moved every hour. Fv/Fm points are means of 11 leaves on 6 plants. Leaf temperatures are means over the 1 h before each fluorescence reading taken under the clips. Probabilities that the Fv/Fm pairs are from the same population are shown. Numbers in the circles represent actions taken to increase or reduce leaf temperatures in the ‘stressed’ house: 1) plants turned so that the sample leaves were in the sun; 2) plants turned again so that the sample leaves were in the shade. The sample leaves in the both houses started in the shade. In the ‘control’ house they were kept in the shade for the entire day..
(6) laboratory data, but the slope of the best-fit line through the greenhouse data agrees more closely with that of the 60 min readings. Since change in heat stress is more important in judging the cost effectiveness of cooling alternatives than is absolute stress, the agreement between the 60 min readings from the laboratory data and the greenhouse data was judged to be most appropriate for the laboratory measurement of heat stress. Discussion. Fig. 8. Greenhouse data from 15 May 1998 (closed circles) and best-fit lines from the laboratory and greenhouse tests. The equation for the best-fit line of the greenhouse data (R2 = 0.86) is also shown.. were increased or decreased suddenly (i.e., when the heaters were turned on or off), Fv/Fm responded quite rapidly, a response resembling overcompensation. In the case of increasing temperature, this is clearly illustrated by the second stressed Fv/Fm point being considerably lower than the next four, despite a lower leaf temperature. In the case of decreasing temperature the effect was not so dramatic, but it is illustrated by the next to last stressed Fv/ Fm point being somewhat higher than the last despite experiencing a higher leaf temperature. The correlation between Fv/Fm and leaf temperature was quite good, with a correlation coefficient, R, of -0.82. Without the apparent overcompensation the correlation would have been much better. Results of the final test are illustrated in Fig. 7. Instead of leaving the measured leaves in the sun all day and subjecting the high temperature plants to sudden increases and decreases in leaf temperature, the plants were turned throughout the day to expose the measured leaves to either shade or sun (depending upon the treatment) such that the temperature changes were more gradual. This allowed good control of leaf temperature differences, but introduced differences in light exposure. The test leaves in both houses were turned toward the shaded side of the plants at the beginning of the test and left there when the heat was turned on. After ≈2 h, the tested leaves in the ‘stressed’ house were turned into the sun and the leaf temperatures increased accordingly, accompanied by a corresponding decrease in Fv/Fm. Two hours later, those same leaves were turned into the shade again. The leaf temperatures decreased and Fv/Fm increased. After two more hours, the heat was turned off and the temperatures allowed to return to ‘normal’. The resulting curves exhibit good separation, no overshoot, and Fv/Fm was well correlated with leaf temperature (R = –0.91). Although the response of the high temperature curve between points 1 and 2 was influenced heavily by both light and temperature differences, the responses before point 1 and after point 2 were not. During those periods the leaves in both houses were shaded equally so that any differences in Fv/Fm should be attributable to temperature differences alone. LABORATORY VS. GREENHOUSE COMPARISON. The best-fit lines from the laboratory data compared to the greenhouse data from 15 May, along with its best-fit line, are presented in Fig. 8. The values of the greenhouse data agree more closely with the 30 min. As mentioned previously, an issue of concern in our measurements was optimizing the dark acclimation period. The literature states that the period of dark adaptation must be sufficient that electron carriers are in the oxidized state and the levels of proton gradient and ATP formation are minimal (Vivader et al., 1991). Dark-adaptation periods ranging from 5 min to 2 h have been used in studies, although 15 to 30 min is normally considered sufficient (see Bolhar-Nordenkampf et al., 1989). In our laboratory tests, less noise was seen with the 60 min readings compared to readings taken more frequently, especially those taken at 15 min (data not presented). In the greenhouse tests, dark adaption periods of 15 min also produced confusing data, primarily at the higher temperatures. Increasing the dark adaption times to 60 min eliminated much of the confusing trends and produced results that agreed reasonably well with the laboratory data. One possible interpretation is that dark adaption times should be increased as temperatures increase. Valladares and Pearcy (1997), for example, measured continuing declines in Fv/Fm for up to 60 min when the leaves were exposed to a temperature of 48 °C. The all-day dark adaption periods used in this study also led to results that were difficult to interpret, in that stressed leaves did not fully recover when stress was removed. One explanation is that leaving the clips on so long may have made the covered portions of the leaf more susceptible to permanent heat damage than areas of the leaf at similar temperatures but exposed to light. In pea (Pisum sativum L.) leaves, Havaux et al. (1991) found that light at low levels protected leaves from heat stress compared to leaves kept in the dark. This effect was saturated at 65 µmol·m–2·s–1. On the other hand, light over 1000 µmol·m–2·s–1 increased heat sensitivity of the leaves. Although the plants used in our study were not exposed to light levels <65 µmol·m–2·s–1, as in the pea experiment of Havaux et al. (1991), it is possible that extended light exclusion played some role in the observed lack of recovery. One problem in interpreting chlorophyll fluorescence data is that it is difficult to distinguish between stress damage, which is irreversible, and temporary photoinhibition, which serves a protective or adaptive function. Both can result in decreased Fv/Fm (Mohammed et al., 1995; Osmond, 1994). Dark acclimation periods of 60 min probably represent a good compromise between reduced variability and irreversible injury. Even so, our experience suggests that leaf temperatures under the dark adaption clips should be monitored. Our results show clearly that increased leaf temperatures were well correlated with declines in Fv/Fm. The cause of fluorescence decline at high temperatures has been related to decline in the functioning of primary photochemical reactions, primarily involving inhibition of PSII, located in the thylakoid membrane system (Berry and Bjorkman, 1980; Weis and Berry, 1988). Decline in Fv/ Fm with stress generally involves an increase in Fo (Yamada, 1996), which was also observed in our study (data not presented). The agreement between our laboratory and greenhouse data suggests the possibility that laboratory testing can be used to estimate stress responses in greenhouses. Accordingly, the labora-.
(7) tory apparatus used here has been expanded to include additional temperature controlled modules such that five different leaf discs can be exposed to five different temperatures during the same 1 h exposure time. This should allow a more rapid assessment of the fluorescence response of greenhouse crops to temperature, which should provide better information for the design of greenhouse cooling systems. Literature Cited Andrews J.R., M.J. Fryer, and N.R. Baker. 1995. Characterization of chilling effects on photosynthetic performance of maize crops during early season growth using chlorophyll fluorescence. J. Expt. Bot. 46:1195–1203. American Society of Agricultural Engineers. 1995. Heating, ventilating and cooling greenhouses. ASAE engineering practice EP406.2. Amer. Soc. Agr. Eng., St. Joseph, Mich. American Society of Heating, Refrigeration, and Air-Conditioning Engineers. 1999. Environmental control for animals and plants, p. 21.1–21.24. In: 1999 ASHRAE handbook: Heating, ventilating and air-conditioning applications. Amer. Soc. Heat. Refrig. Air-Cond. Eng., Inc., Atlanta, Ga. Berry J. and O. Bjorkman. 1980. Photosynthetic response and adaptation to temperature in higher plants. Annu. Rev. Plant Physiol. 31:491–543. Bohanon, H.R., C.E. Rahilly, and J. Stout. 1985. The greenhouse climate control handbook. ACME Eng. & Mfg. Corp., Hort. Div., Muskogee, Okla. Bolhar-Nordenkampf, H.R., S.P. Long, N.R. Baker, G. Oquist, U. Schreiber, and E.G. Lechner. 1989. Chlorophyll fluorescence as a probe of the photosynthetic competence of leaves in the field: A review of current instrumentation. Functional Ecol. 3:497–514. Burke J.J. 1990. Variation among species in the temperature dependence of the reappearance of variable fluorescence following illumination. Plant Physiol. 93:652–656. Burke J.J., J.R. Mahan, and J.L. Hatfield. 1988. Crop-specific thermal kinetic windows in relation to wheat and cotton biomass production. Agron. J. 80:553– 556. Burke J.J. and M.J. Oliver. 1993. Optimal thermal environment for plant metabolic processes (Cucumis sativus L.). Plant Physiol. 102:295–302. Ferguson D.L. and J.J. Burke. 1991. Influence of water and temperature stress on the temperature dependence of the reappearance of variable fluorescence following illumination. Plant Physiol. 97:188–192. Fracheboud, Y., P. Haldlmann, J. Leipner, and P. Stamp. 1999. Chlorophyll fluorescence as a selection tool for cold tolerance of photosynthesis in maize (Zea mays L.). J. Expt. Bot. 50:1533–1540. Havaux M., M. Ernez, and R. Lannoye. 1988. Tolerance of poplar (Populus sp.) to environmental stresses: I. Comparative study of poplar clones using the in vivo chlorophyll fluorescence method. Acta Oecologia/Oecologia Plant. 9:161– 172. Havaux M., H. Greppin, and R.J. Strasser. 1991. Functioning of Photosystem-I and Photosystem-II in pea leaves exposed to heat-stress in the presence or absence of light analysis using in vivo fluorescence, absorbency, oxygen and photoacoustic measurements. Planta 186:88–98. He, D. and G.E. Edwards. 1996. Evaluation of the potential to measure photosynthetic rates in C3 plants (Flaveria pringlei and Oryza sativa) by combining chlorophyll fluorescence analysis and a stomatal conductance model. Plant Cell Environ. 19:1272–1280. Janssen, L.H.J. and P.R. van Hasselt. 1994. Temperature effects on chlorophyll fluorescence induction in tomato. Plant Physiol. 144:129–135. Kitajima M. and W.L. Butler 1975. Quenching of chlorophyll fluorescence and primary photochemistry in chloroplasts by dibromothymoquinone. Biochem. et Biophys. Acta 376:105–115. Larcher W. 1994. Photosynthesis as a tool for indicating temperature stress events, p. 261–277. In: E.-D. Schulze and M.M. Caldwell (eds.). Ecophysiology of photosynthesis. Ecological studies 100. Springer-Verlag, Berlin. Marler, T.E. and P.D. Lawton. 1994. Error in interpreting field chlorophyll. fluorescence measurements—Heat gain from solar-radiation. Hortscience 29:1172–1174. Mohammed G.H, W.D. Binder, and S.L. Gillies 1995. Chlorophyll fluorescence: A review of its practical forestry applications and instrumentation. Scand. J. For. Resources 10:383–410. Osmond, C.B. 1994. What is photoinhibition? Some insights from comparisons of shade and sun plants, p. 1–24. In: N.R. Baker and J.R. Bowyer (eds.). Photoinhibition of photosynthesis, from molecular mechanisms to the field. Bios Scientific Publishers, Oxford, United Kingdom. Pearson, S., P. Hadley, and A.E. Wheldon. 1993. A re-analysis of the effects of temperature and irradiance on time to flowering in chrysanthemum (Dendranthema grandiflora). J. Hort. Sci. 68:89–97. Peet, M.M., D.H. Willits, and R. Gardner. 1997. Response of ovule development and post-pollen production processes in male-sterile tomatoes to chronic, subacute high temperature stress. J. Expt. Bot. 48:101–112. Ranney T.G. and J.M. Ruter. 1997. Foliar heat tolerance of three holly species (Ilex spp.): Responses of chlorophyll fluorescence and leaf gas exchange to supraoptimal leaf temperatures. J. Amer. Soc. Hort. Sci. 122:499–503. Ruter J.M. 1993. Foliar heat tolerance of two hybrid hollies. HortScience 28:650– 652. Schreiber U. and W. Bilger. 1987. Rapid assessment of stress effects on plant leaves by chlorophyll fluorescence measurements, p. 27–53. In: J.D. Tenhunen, F.M.Cararino, O.L. Lange, and W.D. Oechel (eds.). Plant response to stress. Springer-Verlag, New York. Schreiber U. and W. Bilger. 1993. Progress in chlorophyll fluorescence research during the past years in retrospect. Prog. Bot. 54:151–173. Schreiber U., W. Bilger, and C. Neubauer. 1994. Chlorophyll fluorescence as a non-destructive indicator for rapid assess assessment of in vivo photosynthesis, p. 49–70. In: E.-D. Schulze and M.M. Caldwell (eds.). Ecophysiology of photosynthesis. Ecological studies 100. Springer-Verlag, Berlin. Seginer I., D.H. Willits, M. Raviv, and M.M. Peet. 1997. Transpirational cooling of greenhouse crops. Annu. Rpt. Project IS-2538-95R, United States–Israel Binational Agr. Res. and Dev. Fund, Bet Dagan, Israel. Smillie R.M. and R. Nott. 1979. Assay of chilling injury in wild and domestic tomatoes based on photosystem activity of the chilled leaves. Plant Physiol. 63:796–801. Srinivasan A., H. Takeda, and T. Senboku. 1996. Heat tolerance in food legumes as evaluated by cell membrane thermostability and chlorophyll fluorescence techniques. Euphytica 88:35–45. Valladares F. and R.W. Pearcy. 1997. Interactions between water stress, sun– shade acclimation, heat tolerance and photoinhibition in the sclerophyll Heteromeles arbutifolia. Plant, Cell Environ. 20:25–36. Vidaver, W.E., G.R. Lister, R.C. Brooke, and W.D. Binder. 1991. A manual for the use of variable chlorophyll fluorescence in the assessment of the ecophysiology of conifer seedlings. British Columbia Ministry of Forests, Victoria, British Columbia, Canada. FRDA Rpt 163. Walker, J.N., R.A. Aldrich, and T.H. Short. 1983. Quantity of air flow for greenhouse structures. In: M.A. Hellickson and J.N. Walker (eds.). Ventilation of agricultural structures. Amer. Soc. Agr. Eng. Monogr. 6. Weis E. and J. Berry. 1988. Plants and high temperature stress, p. 329–346. In: S.P. Long and F. I. Woodward (eds.), Symp. Soc. Expt. Biol. No. XXXXII, Cambridge Univ. Press, Cambridge, United Kingdom. Willits, D.H. 2000. Constraints and limitations in greenhouse cooling: Challenges for the next decade. Acta Hort. 534:57–66 Willits, D.H. and D.A. Bailey. 2000. The effect of night temperature on chrysanthemum flowering: Heat-tolerant vs. heat-sensitive cultivars. Scientia Hort. 83:325–330. Willits, D.H. and M.M. Peet. 1999. Using chlorophyll fluorescence to model leaf photosynthesis in greenhouse pepper and tomato. Acta Hort. 507:311–315. Yamada M., T.Hidaka, and H. Fukamachi. 1996. Heat tolerance in leaves of tropical fruit crops as measured by chlorophyll fluorescence. Scientia Hort. 67:39–48. Yamane, Y, Y. Kashino, H. Koike, and K. Satoh. 1997. Increases in the fluorescence Fo level and reversible inhibition of Photosystem II reaction center by high-temperature treatments in higher plants. Photosyn. Res. 52:57–64..
(8)
Figure


Related documents
This study aimed to determine if speci fi c foods are associated with YFAS food addiction ‘ diagnosis ’ or ‘ symptom scores ’ and to subsequently describe the nutrient intake pro
Given the availability of 2 oral cholera vaccines and data on their efficacy, field effectiveness, feasibility and acceptance in cholera-affected populations, immunization with
A countermeasure against spoofing and alternation is to append a MAC (Message Authentication Code) after the message. By adding a MAC to the message, the receivers
We have audited the consolidated financial statements prepared by TAKKT AG, Stuttgart, comprising the balance sheet, statement of income, statement of comprehensive income,
In the Penitentiary of Pistoia, a multidisciplinary staff collected socio-demographic and clinical information of the new inmates, and estimated the suicide risk administering
The North East India’s folk art is practices by most of the regions of India featuring its..
study seeks to examine the transfer student experience at two elite universities, one public (UC.. Berkeley) and one private (Stanford University).. This study provides insight into
The broad elements of this general periodization of the women’s movement incorporates the suggestion of: a first wave movement associated with liberal democratic political
