ABSTRACT
MUTHADI, NARESH REDDY. Local Calibration of the MEPDG for Flexible Pavement Design. (Under the direction of Dr. Y. Richard Kim.)
The 1993 American Association of State Highway and Transportation Officials (AASHTO) Guide for Design of Pavement Structures is a mere modification of the empirical methods found in its earlier versions that are based on regression equations relating simple material and traffic inputs. Although the various editions of the AASHTO design guide have served well for several decades, they contain too many limitations to be continued as the nation’s primary pavement design procedures. The Mechanistic-Empirical Pavement Design Guide (MEPDG) procedure, on the other hand, provides the tools for evaluating the effect of variations in input data on pavement performance. The design method in the MEPDG is mechanistic because it uses stresses and strains in a pavement system calculated from the pavement response model to predict the performance of the pavement. The empirical nature of the design method stems from the fact that the pavement performance predicted from laboratory-developed performance models is adjusted based on the observed performance from the field to reflect the differences between predicted and actual field performance.
and 14 rehabilitated sections, and 23 North Carolina Department of Transportation (NCDOT) sections. All the necessary data were obtained from the LTPP and the NCDOT databases. To provide reasonable values in cases where data were missing, MEPDG defaults, NCDOT typical range of values, and engineering judgment were employed. Finally, an experimental matrix is developed to identify any bias resulting from the use of local materials and conditions. The NCDOT currently relies on a subjective rating or non-numeric rating system of the permanent deformation data, which presented difficulties in the conversion to the MEPDG format.
Local Calibration of the MEPDG for Flexible Pavement Design
by
Naresh Reddy Muthadi
A thesis submitted to the Graduate Faculty of North Carolina State University
in partial fulfillment of the requirements for the Degree of
Master of Science
Civil Engineering
Raleigh, North Carolina 2007
APPROVED BY:
_________________________ _________________________ Dr. Murthy N. Guddati Dr. T. Matthew Evans
________________________________ Dr. Y. Richard Kim
DEDICATION
BIOGRAPHY
TABLE OF CONTENTS
LIST OF TABLES... vi
LIST OF FIGURES...vii
CHAPTER 1 INTRODUCTION ... 1
1.1 Research Needs and Significance ... 1
1.2 Research Objectives... 3
1.3 Thesis Organization ... 3
CHAPTER 2 DESIGN PRACTICES ... 5
2.1 Introduction... 5
2.2 Current NCDOT Design Practice ... 5
2.2.1 Pavement Management Unit... 6
2.2.2 Traffic Survey and Traffic Forecasting Units... 12
2.2.3 Materials & Tests Unit... 16
2.2.4 Geotechnical Engineering Unit... 17
2.3 MEPDG Design Practice ... 19
2.3.1 Traffic ... 19
2.3.2 Materials ... 20
2.3.3 Climate... 20
2.3.4 Inputs Required by the MEPDG ... 21
2.3.5 Input Level Hierarchy ... 29
2.3.6 DG 2002 Software ... 30
2.4 Summary... 32
CHAPTER 3 DATA COLLECTION ... 33
3.1 Introduction... 33
3.2 LTPP Database ... 33
3.2.1 North Carolina Data Extraction ... 34
3.2.2 LTPP Section Performance Data ... 36
3.3 NCDOT Database ... 37
3.3.1 Traffic ... 38
3.3.2 Materials ... 38
3.3.3 Climate... 39
3.3.4 NCDOT Section Performance Data... 39
3.4 Summary... 42
CHAPTER 4 SENSITIVITY ANALYSIS ... 44
4.1 Introduction... 44
4.2 Literature Review ... 44
4.2.1 Rigid Pavements ... 44
4.2.2 Flexible Pavements ... 46
4.2.3 Traffic Sensitivity ... 47
4.2.4 Insensitive Input Parameters ... 47
4.3 Sensitivity Analysis Plan ... 49
4.3.1 Selection of Pavements ... 50
4.3.3 Determination of the Sensitivity of Input Parameters... 56
4.4 Results and Analysis... 58
4.4.1 Material Sensitivity... 58
4.4.2 Traffic Sensitivity ... 58
4.4.3 Climate Sensitivity... 58
4.4.4 Summary ... 59
4.4.5 Input Data Collection Strategy... 62
4.4.6 Limitations ... 65
4.5 Recommended Implementation Guidelines... 67
4.5.1 General Recommendations ... 67
4.5.2 Specific Recommendations... 68
4.6 Summary... 69
CHAPTER 5 DEVELOPMENT OF LOCAL CALIBRATION FACTORS ... 70
5.1 Introduction... 70
5.2 Literature Review ... 70
5.2.1 Verification ... 71
5.2.2 Calibration Refinement... 72
5.2.3 Permanent Deformation Model... 73
5.2.4 Bottom-Up Fatigue Cracking Model ... 76
5.2.5 National Calibration Procedure... 79
5.3 Local Calibration Plan ... 85
5.3.1 Verification ... 85
5.3.2 Calibration... 86
5.3.3 Validation... 86
5.4 Summary... 87
CHAPTER 6 RESULTS AND ANALYSIS... 88
6.1 Introduction... 88
6.2 Data Extraction and Evaluation ... 88
6.3 Verification ... 91
6.4 Calibration ... 94
6.5 Validation... 99
6.6 Summary... 101
CHAPTER 7 CONCLUSIONS AND RECOMMENDATIONS ... 103
7.1 Conclusions... 103
7.2 Recommendations... 104
REFERENCES .. ... 106
APPENDIX A: LOCAL CALIBRATION DATABASE ... 110
LIST OF TABLES
Table 2-1 Lane Distribution Factor... 8
Table 2-2 Truck Loading Factors ... 8
Table 2-3 Terminal Serviceability Index ... 10
Table 2-4 Analysis Parameters for Rigid and Flexible Pavements... 23
Table 2-5 Layer Inputs... 24
Table 3-1 List of LTPP Test Sections in North Carolina According to Pavement Type... 35
Table 4-1 Insensitive Parameters, from Literature Review ... 48
Table 4-2 Pavement Classification According to Climate and Structure ... 50
Table 4-3 Traffic Sensitivity Analysis Plan... 53
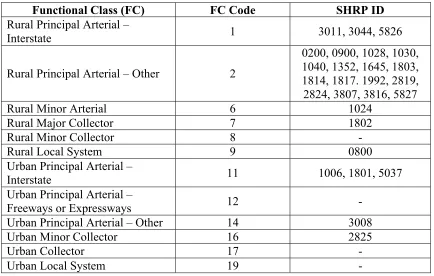
Table 4-4 Pavement Classification According to Functional Class... 53
Table 4-5 Final Clusters for Axle Load Distribution... 55
Table 4-6 Final Clusters for Vehicle Class Distribution... 55
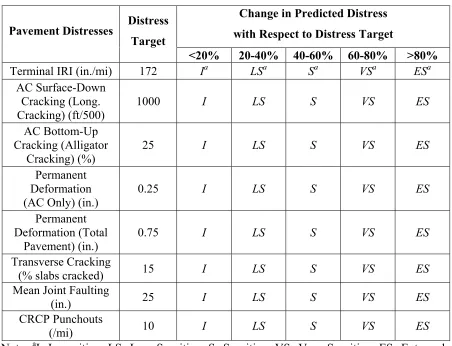
Table 4-7 Sensitivity Classification ... 57
Table 4-8 Flexible Pavements – Sensitive Inputs ... 62
Table 4-9 Rigid Pavements – JPCP – Sensitive Inputs... 62
Table 4-10 Rigid Pavements – CRCP – Sensitive Inputs ... 62
Table 6-1 Experimental Matrix... 90
Table 6-2 Verification Results - Summary of Statistics for the Permanent Deformation Predictions... 92
Table 6-3 Verification Results - Summary of Statistics for Alligator Cracking Predictions.. 93
Table 6-4 Calibration Results - Summary of Statistics for the Permanent Deformation Predictions... 95
Table 6-5 Calibration Results – Summary of Statistics for Alligator Cracking Predictions .. 98
Table 6-6 Calibration Results - Null Hypothesis Test for Standard Error... 99
Table 6-7 Validation Results – Summary of Statistics for the Permanent Deformation and Alligator Cracking Predictions ... 100
Table 6-8 Validation Results - Null Hypothesis Test for Standard Error... 100
LIST OF FIGURES
Figure 3-1 Locations of Flexible Pavement Sections Included in the Study... 43
Figure 5-5-1 Permanent Deformation in the Flexible Pavement Structure ... 73
Figure 5-5-2 Bottom-up Fatigue Cracking in the Flexible Pavement Structure... 76
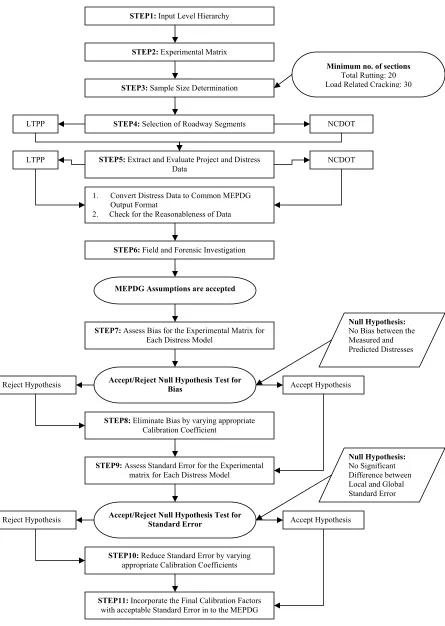
Figure 6-1 Flow Chart showing the Local Calibration Plan ... 89
Figure 6-2 Verification Results - Total Measured Rut Depth vs. Predicted Rut Depth ... 93
Figure 6-3 Estimated measured rut depth vs. predicted rut depth: (a) HMA before calibration; (b) HMA after calibration; (c) granular base before calibration; (d) granular base after calibration; (e) subgrade before calibration; and (f) subgrade after calibration ... 96
Figure 6-4 Measured vs. predicted distresses before and after calibration: (a) total rut depth before calibration; (b) total rut depth after calibration; (c) alligator cracking before calibration; and (d) alligator cracking after calibration ... 97
Figure 6-5 Estimated measured rut depth vs. predicted rut depth from validation: (a) HMA; (b) granular base; (c) subgrade; and (d) total... 100
CHAPTER 1 INTRODUCTION
1.1Research Needs and Significance
The 1993 American Association of State Highway and Transportation Officials (AASHTO) Guide for Design of Pavement Structures is a mere modification of the empirical methods found in its earlier versions that are based on regression equations relating simple material and traffic inputs. Although the various editions of the AASHTO design guide have served well for several decades, they contain too many limitations (NCHRP, 2004.a) to be continued as the nation’s primary pavement design procedures. Besides the empirical nature of the 1993 Guide, the performance equations that are its foundation are derived from the AASHO Road Test that took place during 1958-1961 in Ottawa, Illinois. Several limitations have been noted in the procedures from then on, including 1950’s traffic loading, one climatic zone, one material type for each pavement layer, and 1950’s construction and drainage.
materials, aging, climate, and present day vehicle loadings, the variations in performance in relation to design life should be reduced.
Several benefits are associated with the implementation of the National Cooperative Highway Research Program (NCHRP) 1-37A Mechanistic Empirical Pavement Design Guide (MEPDG). The design method in the MEPDG is mechanistic because it uses stresses and strains in a pavement system calculated from the pavement response model to predict the performance of the pavement. The empirical nature of the design method stems from the fact that the pavement performance predicted from laboratory-developed performance models is adjusted based on the observed performance from the field to reflect the differences between predicted and actual field performance. These models require user inputs for the following four modules: materials, traffic, environment and pavement structure. The MEPDG is hierarchical in nature in that the level of sophistication for different input requirements changes according to the importance of the project in question.
The local calibration guide developed during the NCHRP 1-40B project (NCHRP, 2007) provides necessary recommendations and guidelines to ensure proper recalibration and validation to the local materials and conditions.
1.2Research Objectives
The primary objective of the research project is to calibrate the MEPDG for flexible pavement design in North Carolina. To accomplish this objective, the following tasks are performed in this study:
1. Develop a summary of design practices outlined in the MEPDG that differ from the current design practices followed by the NCDOT;
2. Perform a sensitivity analysis on the design input parameters using realistic input ranges;
3. Develop input data collection strategy along with a set of implementation guidelines and recommendations;
4. Develop a database for the NCDOT materials, traffic and climate; and
5. Calibrate and validate the two performance prediction models (permanent deformation and alligator cracking models) in the MEPDG for local conditions and materials.
1.3Thesis Organization
CHAPTER 2 DESIGN PRACTICES
2.1Introduction
The main focus of this chapter is to develop a summary of design practices outlined in the MEPDG that differ from the current design practice followed by NCDOT. This study will help pavement design engineers understand the basic principles behind the design guide methodology, DG (Design Guide) 2002 software and its input requirements, thus allowing a smoother adaptation of the MEPDG by the NCDOT.
A review of the NCDOT’S current pavement design practices and existing input data constitutes the first task of the research; these practices and data include the material inputs, traffic inputs, climatic inputs, design reliability levels, performance criteria, and pavement structures. Information collected in this review includes: (1) types and formats of input data for current NCDOT design practices; (2) actual values and their variations for various input data; and (3) data collection methods.
Similarly, a summary of the study of the MEPDG design guide methodology along with the input requirements by the new MEPDG software are provided in this chapter. It also discusses the flexibility associated with the hierarchical design input levels approach in the MEPDG.
2.2Current NCDOT Design Practice
NCDOT. These units include the Pavement Management Unit (PMU), Geotechnical Engineering Unit, Materials & Tests Unit (M&T Unit), Traffic Forecasting Unit, and Traffic Survey Unit (TSU).
The current design practices follow AASHTO design equations, as presented in the 1972 AASHTO Interim Guide for Design of Pavement Structures, for the design of both flexible and rigid pavements. For flexible pavement designs, the inputs required are regional factors and soil support values, as determined from laboratory CBR tests. For rigid pavement designs, the input required is the modulus of the subgrade reaction.
The findings from the review and interviews are summarized below.
2.2.1 Pavement Management Unit
Pavement designs are created by the PMU and follow the NCDOT’s Interim Pavement Design Procedure (IPDP) dated April 1, 2000. The IPDP is based on the 1972 AASHTO Interim Pavement Design Guide with some modifications. In the following, the procedures in the IPDP are summarized, along with the findings from the interviews with the PMU engineers.
2.2.1.1Design Life
The design life for new flexible and rigid pavements is 20 and 30 years, respectively.
2.2.1.2Traffic Inputs
The term Dual represents single-unit trucks, whereas TTST represents multiple unit trucks including both single and twin trailer combinations.
The current NCDOT procedure is based on the following traffic growth law:
0
(1 ) 100
DL
i
i
GR Total ESALs IESAL
=
=
∑
× + , (2-1)where;
DL = design period in years; IESAL = first year ESALs; and GR = growth rate, percent.
Eq. (2-1) can be further refined using various traffic factors, as shown below:
365.25 ( ) 365.25
1 1 1
100 365.25 365.25 100
DL CY IY
GR GR
Total ESALs AE IADT
× − ×
= + × + − × +
× ×
100 100 100 ln 1
100 365.25
PTT PD DDP LD
FTT FD
GR
× × + × × ×
+
×
, (2-2)
where;
AE = additional ESALs, such as military loadings;
GR = growth rate, percent;
DL = design life, year (flexible pavement = 20 and rigid pavement = 30);
IADT = initial year ADT;
CY = construction year;
IY = initial year;
PTT = TTST, percent;
FTT = truck factor for TTST (Table 2-2); PD = Duals, percent;
FD = truck factor for Duals (Table 2-2); DDP = directional distribution, percent; and LN = natural logarithm.
The projected year ADT is normally for a 20-year period. The 20-year growth rate should be used to project traffic counts to the 30-year mark, unless the Traffic Forecast Unit provides 30-year projections. Loadings from automobiles are considered to be negligible. The lane distribution factors and the truck factors are tabulated in Table 2-1 and Table 2-2, respectively. A lane distribution factor of 0.5 will be used for the design of the inside (median) lane widening of existing facilities that have 2 or more lanes per direction.
Table 2-1 Lane Distribution Factor
Lane Distribution Factor No. of Lanes in One Direction
1.0 1 0.9 2
0.8 3 or more
Table 2-2 Truck Loading Factors
Truck Loading Factors
Flexible Pavement Rigid Pavement
Road Type Duals (FD) TTST (FTT) Duals (RD) TTST (RTT)
Rural Freeway 0.30 1.15 0.30 1.60
Rural Other 0.30 0.95 0.35 1.30
Urban Freeway 0.30 0.85 0.35 1.20
Urban Other 0.25 0.80 0.25 1.10
ADT, %TTST, and %Dual are obtained for the construction year and for the design life based on the projection from the Traffic Forecasting Unit.
When the project is composed of multiple segments, the highest traffic data are used
for the entire project.
Class 4 and Class 9 trucks are the major vehicle types in North Carolina. Eq. 2-2 is used to determine the ESALs.
Truck factors are developed from weigh station data.
Fifty percent is normally used to convert two-way traffic to one direction for
pavement design.
Based on the PMU’s mid-day vehicle and truck counts and visual observation at
project sites, it has been noticed that traffic forecast truck percentages are lower than truck percentages based on these observations.
2.2.1.3Soil Support Value (SSV)
The SSV is determined from the following equation (NCDOT, 2000): 5.32 log( ) 1.49
SSV = × CBR − (2-3) The pavement design engineer will determine the final SSV value based on the laboratory CBR test results, deflection data (if any), and information from the Geotechnical Engineering Unit, including the soil classification and Dynamic Cone Penetrometer (DCP) results.
2.2.1.4Terminal Serviceability Index
Table 2-3 Terminal Serviceability Index
Traffic Level Terminal Serviceability
Index
20-year traffic projection exceeds 50,000 ADT with a high
heavy truck volume 2.75 20-year traffic projection exceeds 80,000 ADT with a high
heavy truck volume 3.0 All other roadways 2.5
2.2.1.5Regional Factors
The minimum values for the regional factors for different counties in North Carolina are given on page 4 of the IPDP (NCDOT, 2000). These values are used unless higher values are provided by the Geotechnical Engineering Unit.
2.2.1.6Layer Coefficients
Layer coefficients for different materials are given on page 4 of the IPDP (NCDOT, 2000). It is noted that one structural coefficient value is used for all the surface and binder hot-mix asphalt (HMA) mixes.
2.2.1.7Drainage
For rigid pavements, a permeable asphalt drainage layer (PADL) over a stabilized subgrade is typically used under the concrete slab to provide uniform support and positive drainage. In the past, NCDOT had specific mix types that consisted of coarse aggregate and asphalt cement only, and were not dense-graded. These mix types were identified as PADL/PADC. A separating layer of S9.5A (30 mm thick) or S9.5B (40 mm thick) is placed between the PADL and the stabilized subgrade.
greater than 5%. For projects with an ADT greater than 50,000 and a heavy truck percentage greater than 15%, shoulder drains are highly recommended. For flexible pavements, shoulder drains are recommended for locations that have a slope of less than 1% and poor draining soils.
2.2.1.8Cost Analysis
According to the IPDP, the unit costs for pavement pay items are obtained from the Project Services Unit, and the request for unit costs should include the project location and description and a complete listing and total quantities of the pay items.
2.2.1.9Asphalt Overlay on Flexible Pavements
The falling weight deflectometer (FWD) data are used to determine the overlay thicknesses. The detailed mathematical procedure is given on pages 10 and 11 of the IPDP. Traffic estimates for smaller overlay jobs and widening projects are provided by the PMU.
The modulus of an AC overlay is assumed to be 500,000 psi. Coring is often undertaken to determine layer thicknesses.
2.2.1.10 Asphalt Overlay on Rigid Pavements
The design of asphalt overlay on rigid pavements is mainly experience-based.
2.2.1.11 Concrete Overlay on Rigid Pavements
CRCP pavements that are not in good condition, patching will be done to restore them. It is the most preferred treatment which is done with concrete using mechanical couplers and is then overlaid with 5 inches of HMA.
The unbonded overlay requires a substantially thicker overlay than the bonded overlay but much lower risk. The additional thickness of an unbonded overlay often becomes a problem because of geometric constraints. Bridge clearances are the main constraint.
2.2.1.12 Rubblization
The layer coefficient for rubblized concrete is given on page 5 of the IPDP. The SSV values are obtained from the Geotechnical Engineering Unit. Rubblization projects are treated as new flexible pavement design projects.
2.2.2 Traffic Survey and Traffic Forecasting Units
2.2.2.1Data type
The TSU has six types of traffic data products that may be used in the development of traffic forecasts. These are:
Annual Average Daily Traffic (AADT)
The unit operates a coverage count program to provide comprehensive monitoring of traffic volume on all primary and on some secondary and local routes. Data are collected in daily counts on highway segments that are factored for axle correction and seasonal adjustment to generate AADT volume estimates. These data are used to generate base year AADT estimates and for trend analyses to develop future year estimates.
Turning Movements (TMs)
forecast classification formats are collected for one leg of the intersection. Data are collected in two shifts, typically on two different days. Surveyed turning volumes and truck volumes are expanded from partial day to 24-hour estimates. These values are treated as average weekday volumes.
Manual Classification (MC)
Manual classification is similar to turning movements, but data are collected on a segment where traffic is classified in both directions. Truck percentages are generated for surveyed traffic only. These volumes are not expanded to 24-hour estimates. Surveyed truck percentages are considered representative of average weekday truck percentages. The manual classification is typically used when conditions do not allow collection of an electronic vehicle classification count.
Daily Volume Counts
Daily volume counts are the same type of count as collected for AADT. Data are provided as requested for small-scale projects, but are unfactored. Data are factored for large-scale urban transportation modeling projects (validation counts). These counts are typically collected on weekdays. Factoring means converting Short duration counts to represent the average traffic condition, which is usually done using the continuous counter data from other locations.
Hourly Volume Counts
Hourly Vehicle Classification Counts
Hourly vehicle classification counts are electronic counts collected in the FHWA 13 vehicle classification scheme in hourly totals. These counts are collected and reported by lane. Data must be aggregated by the user for two-way totals and then aggregated by class to generate the NCDOT truck percentages. The correlation between the schemes is Duals = Class 4-7 and TTST = Class 8-13. Daily totals are sometimes factored as daily counts. These counts are typically collected on weekdays.
2.2.2.2Data Collection Methods
In estimating the traffic volume for new roads, computer programs are used to predict the future traffic once the new road is opened to traffic. The PMU uses the default truck loading factors from Table 2-2 to determine percentage of Duals and percentage of TTSTs for different road categories. Currently, axle load information is not generated from the TSU.
2.2.2.3Equipment
The TSU uses the following equipment to collect various traffic data: Daily counter – TT6 (pneumatic tube) – manual data transfer
Vehicle classifier - PEEK ADR-1000 – hourly volume and vehicle classification – requires programming for operation
Manual counter – Jamar’s DB400
Continuous volume monitoring site – PEEK ADR-3000 with inductance loops
Continuous WIM – PEEK ADR-3000 with inductance loops and piezoelectric sensors
2.2.2.4Forecasting
extrapolation, and land use information are used to predict the future AADTs and truck percentages. It is noted that ESALs are calculated by the PMU using Eq. (2-2).
2.2.2.5Existing Data and Research Needs
Weigh-In-Motion (WIM) sites are classified into two types:
TMG: These sites are compliant with the recommendations of the Traffic Monitoring Guide (TMG) where vehicle classification and truck weight data are collected in all lanes in both directions continuously. This procedure meets the requirements for generating class and load spectra.
LTPP: Data are collected only in the lanes with test sections.
2.2.3 Materials & Tests Unit
2.2.3.1Design of New Pavements
It is common that specific information about layer materials is not known during the pavement design stage and, therefore, participation by the M&T Unit in the design of new pavements is mostly limited to the characterization of existing subgrade soils. Since the NCDOT is currently using the 1972 AASHTO Design Guide, the primary parameter that represents the strength of the subgrade soil is the Soil Support Value (SSV). This value is determined from the soil classification and/or CBR values of soils sampled from the project site.
The M&T Unit performs unconfined compressive strength tests on cement-treated base and stabilized soils to determine the amount of cement or lime in the layers. The minimum thicknesses of lime- and cement-stabilized layers are 8 and 7 in., respectively. A 6" thick cement stabilized layer can also be used, if road mixed. Currently, no testing is being conducted on HMA mixtures for the design of new pavements.
For the design of new concrete pavements, no testing is being conducted on any layer materials.
For the design of overlay, no testing is being performed on the overlay materials regardless of the material type (i.e., asphalt or concrete overlay). Cores are taken from existing concrete and asphalt pavements to determine compressive strength, layer thickness, and/or layer condition, such as honeycombing and stripping. Cores have always been part of the overlay construction QC/QA check.
2.2.3.2Data Collection Methods
For HMA Mixtures:
2 Troxler gyratory compactors
Asphalt Pavement Analyzer
Pine Marshall Press for TSR testing For Aggregate Base and Subgrade:
2 Humboldt HM3000s for CBR testing
1 Instron closed-loop servo-hydraulic machine for Resilient Modulus (MR) testing of
soil, aggregate, and stabilized materials. Acquired in 2004. Computer controlled. Uses pre-programmed software to run tests.
For Concrete:
Reinhart loading machine for flexural strength testing
UTM (Hydraulic) for compressive strength determination
2.2.4 Geotechnical Engineering Unit
2.2.4.1Design of New Pavements
The following information is generated in the Geotechnical Engineering Unit for new pavement design regardless of the pavement type (i.e., flexible vs. rigid):
Subsurface plan, including information on slopes, embankments, soil type, etc.
County soil maps
CBR values of soils and the SSV estimated from the CBR values
Chemical stabilization
Shelby tube samples for MR determination by the M&T Unit
2.2.4.2Overlay on Flexible Pavement
Visual survey of pavement cores and conditions
Determination of SSV values from:
9 Dynamic Cone Penetrometer values, obtained through the aggregate base course
(ABC) and 18 in. into subgrade
9 Augering, to determine the depth of the ABC and to obtain soil samples 9 Soil classification and the moisture content of soil samples
9 CBR values
Determination of regional factors, based on the water table, frost susceptibility, and
soil type (typically 1.5 for the mountain region, 1 for the piedmont, and 0.5 for the coastal region)
2.2.4.3Overlay on Rigid Pavement
No work is required to support the design of this pavement type.
2.2.4.4Rubblization
The following tasks are performed for rubblization projects:
Coring DCP testing
Determining moisture content
Augering to determine the depth of water table Visual condition survey
2.3MEPDG Design Practice
The MEPDG design approach (NCHRP, 2004.a) differs significantly from the earlier AASHTO design procedures which are empirically based on the performance equations developed using the 1950’s AASHO Road Test data. MEPDG involves more of a mechanistic approach which refers to application of principles of engineering resulting in a more rational design process. A brief discussion of the principles and methodology involved in the new design guide is provided below.
2.3.1 Traffic
Traffic data is one of the four key input data elements for the pavement analysis and design process. Traffic data are typically collected using various data acquisition technologies i.e., Weigh-In-Motion (WIM), Automatic Vehicle Classifier (AVC), and Automatic Traffic Recorder (ATR). Traffic data that are unavailable at a particular site are usually borrowed from the other sites that exhibit similar traffic patterns. Due to differences in the data collection techniques, i.e., continuous coverage to simple 48 hr coverage, wide variation can be expected in the traffic data between pavement design sites.
approach and its significance are presented towards the end of this chapter. The list of traffic inputs required for the design process is provided in Section 2.3.4.
2.3.2 Materials
In the previous AASHTO flexible pavement design procedures, the only material property included was layer coefficient ‘a’, a parameter empirical by nature. It was realized (NCHRP, 2004.a) that this lack of material property consideration leads to early or premature failures. Because some materials are time-temperature dependent (e.g., asphalt concrete modulus) and some are stress state dependent (e.g., unbound materials), it is important to include these factors in the M-E analysis. The design guide considers factors like these and many more in the design process resulting in more appropriate structural responses for different pavement distress modes. The material properties that are required to predict the stresses, strains and the displacements within the pavement structure when subjected to external loading (e.g., wheel load) include elastic modulus and Poisson’s ratio of the material.
Apart from the material properties, the other materials-related inputs that play a significant role are engineering index properties, thermal properties, gradation parameters. These properties help determine the temperature and moisture profiles throughout the pavement cross-section.
2.3.3 Climate
The MEPDG uses an approach to study the effects of changing temperatures and moisture profiles in the pavement structure and subgrade using a sophisticated climatic modeling tool called the Enhanced Integrated Climatic Model (EICM). It simulates the behavior and characteristics of the pavement and subgrade under heat and moisture flow over the changing climatic conditions.
Most of the inputs to accomplish the climatic analysis are acquired from the weather station located near the project site using the software. The software requires at least 24 months of weather data to carry out the computations. In case of absence of a weather station near the project site, a virtual weather station can be identified from a combination of nearby weather stations.
2.3.4 Inputs Required by the MEPDG
In an effort to identify the types of input parameters for the MEPDG, the MEPDG report (NCHRP, 2004.a) and software program were studied. In the following, all the required input parameters that are needed to perform analyses using the MEPDG software are summarized.
2.3.4.1General Information
1. Design life (years)
2. Existing pavement construction (month, year) 3. Pavement overlay construction (month, year) 4. Traffic open date (month, year)
5. Type of design
a. Flexible pavement
c. Continuously reinforced concrete pavement (CRCP) 6. Restoration
a. JPCP 7. Overlay
a. Asphalt concrete (AC) − AC over AC
− AC over JPCP − AC over CRCP
− AC over JPCP (fractured) − AC over CRCP (fractured) b. Portland cement concrete (PCC)
− Bonded PCC/CRCP − Bonded PCC/JPCP
− JPCP over JPCP – Unbonded − JPCP over CRCP – Unbonded − CRCP over CRCP – Unbonded − CRCP over JPCP – Unbonded − JPCP over AC
− CRCP over AC
2.3.4.2Site/Project Identification
1. Location 2. Project ID
4. Section ID
5. Station/Milepost format (ft/miles/(latitude, longitude)) 6. Station/Milepost begin
7. Station/Milepost end 8. Traffic direction (E/W/N/S)
2.3.4.3Analysis Parameters
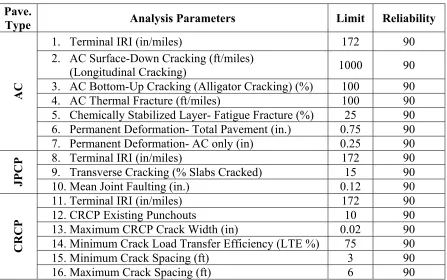
1. Initial IRI (in/miles) 2. Performance criteria
Table 2-4 Analysis Parameters for Rigid and Flexible Pavements
Pave.
Type Analysis Parameters Limit Reliability
1. Terminal IRI (in/miles) 172 90 2. AC Surface-Down Cracking (ft/miles)
(Longitudinal Cracking) 1000 90 3. AC Bottom-Up Cracking (Alligator Cracking) (%) 100 90
4. AC Thermal Fracture (ft/miles) 100 90 5. Chemically Stabilized Layer- Fatigue Fracture (%) 25 90 6. Permanent Deformation- Total Pavement (in.) 0.75 90
AC
7. Permanent Deformation- AC only (in) 0.25 90 8. Terminal IRI (in/miles) 172 90
9. Transverse Cracking (% Slabs Cracked) 15 90
JPCP 10.Mean Joint Faulting (in.) 0.12 90
11.Terminal IRI (in/miles) 172 90 12.CRCP Existing Punchouts 10 90 13.Maximum CRCP Crack Width (in) 0.02 90 14.Minimum Crack Load Transfer Efficiency (LTE %) 75 90 15.Minimum Crack Spacing (ft) 3 90
CRCP
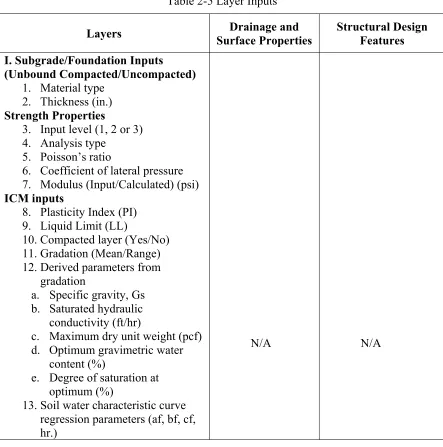
2.3.4.4Structure Inputs
Table 2-5 Layer Inputs
Layers Drainage and
Surface Properties
Structural Design Features I. Subgrade/Foundation Inputs
(Unbound Compacted/Uncompacted)
1. Material type 2. Thickness (in.)
Strength Properties
3. Input level (1, 2 or 3) 4. Analysis type
5. Poisson’s ratio
6. Coefficient of lateral pressure 7. Modulus (Input/Calculated) (psi)
ICM inputs
8. Plasticity Index (PI) 9. Liquid Limit (LL)
10.Compacted layer (Yes/No) 11.Gradation (Mean/Range) 12.Derived parameters from
gradation
a. Specific gravity, Gs b. Saturated hydraulic
conductivity (ft/hr)
c. Maximum dry unit weight (pcf) d. Optimum gravimetric water
content (%)
e. Degree of saturation at optimum (%)
13.Soil water characteristic curve regression parameters (af, bf, cf, hr.)
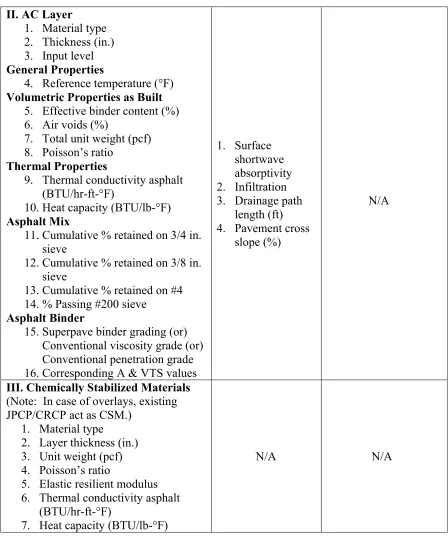
Table 2-5 (Continued) Layer Inputs
II. AC Layer
1. Material type 2. Thickness (in.) 3. Input level
General Properties
4. Reference temperature (°F)
Volumetric Properties as Built
5. Effective binder content (%) 6. Air voids (%)
7. Total unit weight (pcf) 8. Poisson’s ratio
Thermal Properties
9. Thermal conductivity asphalt (BTU/hr-ft-°F)
10.Heat capacity (BTU/lb-°F)
Asphalt Mix
11.Cumulative % retained on 3/4 in. sieve
12.Cumulative % retained on 3/8 in. sieve
13.Cumulative % retained on #4 14.% Passing #200 sieve
Asphalt Binder
15.Superpave binder grading (or) Conventional viscosity grade (or) Conventional penetration grade 16.Corresponding A & VTS values
1. Surface shortwave absorptivity 2. Infiltration 3. Drainage path
length (ft) 4. Pavement cross
slope (%)
N/A
III. Chemically Stabilized Materials
(Note: In case of overlays, existing JPCP/CRCP act as CSM.)
1. Material type
2. Layer thickness (in.) 3. Unit weight (pcf) 4. Poisson’s ratio
5. Elastic resilient modulus 6. Thermal conductivity asphalt
(BTU/hr-ft-°F)
7. Heat capacity (BTU/lb-°F)
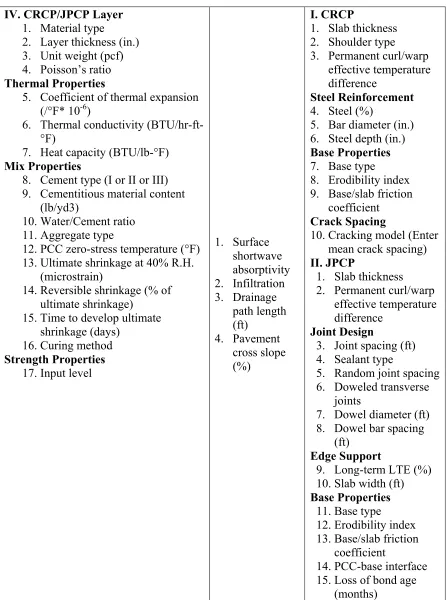
Table 2-5 (Continued) Layer Inputs
IV. CRCP/JPCP Layer
1. Material type
2. Layer thickness (in.) 3. Unit weight (pcf) 4. Poisson’s ratio
Thermal Properties
5. Coefficient of thermal expansion (/°F* 10-6)
6. Thermal conductivity (BTU/hr-ft-°F)
7. Heat capacity (BTU/lb-°F)
Mix Properties
8. Cement type (I or II or III) 9. Cementitious material content
(lb/yd3)
10.Water/Cement ratio 11.Aggregate type
12.PCC zero-stress temperature (°F) 13.Ultimate shrinkage at 40% R.H.
(microstrain)
14.Reversible shrinkage (% of ultimate shrinkage)
15.Time to develop ultimate shrinkage (days)
16.Curing method
Strength Properties
17.Input level
1. Surface shortwave absorptivity 2. Infiltration 3. Drainage path length (ft) 4. Pavement cross slope (%) I. CRCP
1. Slab thickness 2. Shoulder type 3. Permanent curl/warp
effective temperature difference
Steel Reinforcement
4. Steel (%)
5. Bar diameter (in.) 6. Steel depth (in.)
Base Properties
7. Base type
8. Erodibility index 9. Base/slab friction
coefficient
Crack Spacing
10.Cracking model (Enter mean crack spacing)
II. JPCP
1. Slab thickness 2. Permanent curl/warp
effective temperature difference
Joint Design
3. Joint spacing (ft) 4. Sealant type
5. Random joint spacing 6. Doweled transverse
joints
7. Dowel diameter (ft) 8. Dowel bar spacing
(ft)
Edge Support
9. Long-term LTE (%) 10.Slab width (ft)
Base Properties
11.Base type
12.Erodibility index 13.Base/slab friction
coefficient
14.PCC-base interface 15.Loss of bond age
2.3.4.5Flexible Rehabilitation
1. Rehabilitation level 2. Milled thickness (in.)
3. Geotextile present on existing surface (Yes/No)
4. Pavement rating (Very poor/ Poor/ Fair/ Good/ Excellent) 5. Total rutting (in.)
2.3.4.6Thermal Cracking
1. Input level
2. Average tensile strength at 14°F (psi) 3. Creep compliance (1/psi)
4. Compute mix coefficient of thermal contraction a. Mixture VMA (%)
b. Aggregate coefficient of thermal contraction c. Mix coefficient of thermal contraction (in./in./°F)
2.3.4.7Climate Inputs
1. Latitude (degrees.minutes) 2. Longitude (degrees.minutes) 3. Elevation (ft)
4. Depth of water table (ft)
2.3.4.8Traffic Inputs
1. General
(b) Number of lanes in design direction (c) Trucks in design direction (%) (d) Trucks in design lane (%) (e) Operational speed (mph) 2. Traffic volume adjustment factors
1. Monthly adjustment factors i) Input level
2. Vehicle class distribution i) Input level
ii) AADTT distribution by vehicle class 3. Hourly distribution
i) Hourly truck distribution by period 4. Traffic growth factors
i) No growth/ Linear growth/ Compound growth ii) Default growth rate (%)
3. Axle load distributions 1. Input level
2. View (cumulative distribution or distribution) 3. Axle types (Single/ Tandem/ Tridem/ Quad) 4. General traffic inputs
1. Lateral traffic wander
iii) Design lane width (ft) 2. Number of axles/truck
3. Axle configuration
i) Average axle width (edge-edge, outside dimension (ft)) ii) Dual tire spacing (in.)
iii) Tire pressure (psi)
iv) Axle spacing (tandem/tridem/quad) 4. Wheel spacing
i) Average axle spacing (ft) ii) Trucks (%)
2.3.4.9Rigid Rehabilitation
(In case of overlays, over JPCP/CRCP) 1. Existing distress
a. Before restoration: percentage of slabs with transverse cracks plus percentage of previously repaired/replaced slabs
b. After restoration: total percentage of slabs repaired/replaced c. CRCP Punchouts (per mi)
2. Foundation support
a. Dynamic modulus of subgrade reaction (psi/in.) b. Modulus of subgrade reaction (month)
2.3.5 Input Level Hierarchy
of the project. Three levels of input systems are available in the MEPDG. This hierarchical approach (NCHRP, 2004.a) can be employed with regard to traffic, materials, and environmental inputs. The Level 1 input system involves comprehensive laboratory testing or field tests providing the highest level of accuracy (and thus lowest level of uncertainty or error) and also consuming more time and resources. Level 2 inputs are usually estimated through the correlations or derived from limited testing programs. For example, asphalt concrete modulus can be estimated from the binder, aggregate and mix properties. Level 3 allows the designer to estimate the most appropriate design value of the material property based on experience with little or no testing involved. There are several advantages with this hierarchical approach, including greater flexibility in selecting the appropriate engineering effort and cost-effective design.
2.3.6 DG 2002 Software
The new version of the software (0.9 and 1.0) released by the NCHRP incorporates many corrections, technical improvements and enhancements. Major changes (NCHRP, 2006.a) include software changes (such as changes to traffic data and other general topics), changes in the integrated climatic model, changes in flexible pavement design and analysis, and changes in rigid pavement design and analysis. Recommendations for the new version of software include a new climatic database, which is now substantially larger and enhanced, and verification of each input prior to re-running old files (i.e., ones generated with versions 0.7 and 0.8).
of runs) are desired. Also, the time period required for each run is reduced to 30 minutes, compared to 40-plus minutes previously, thus saving a significant amount of time.
The integrated climatic model has been modified and enhanced and is now referred to as the Enhanced Integrated Climatic Model (EICM). The EICM is based on the results of the NCHRP 9-23 “Environmental Effects in Pavement Mix and Structural Design Systems” project. A new set of weather station files with up to 9 years of hourly data has been added to 851 stations; it is recommended that old weather station files be deleted and not used with the new software version. Several errors related to the original integrated climatic model (ICM) stability check have been fixed.
Several changes have been made to the software to enhance the design of flexible pavements. The analysis period (design life) has been increased from 25 to 50 years. Errors related to usage of level 1 |E*| characterization in the HMA analysis have been fixed. Also, errors related to Level 2 seasonal modulus analyses of unbound materials have been corrected.
2.4Summary
CHAPTER 3
DATA COLLECTION
3.1Introduction
The data collection process was the major hurdle during the research with the amount of data, number of data sources (different units of NCDOT, i.e., Traffic unit, Pavement Management unit, Geotechnical Engineering unit, Pavement Construction unit), and the time constraints involved. Also the quality of the data plays a major role in the calibration process and hence more efforts and time were expended in obtaining the data from the NCDOT and LTPP database. LTPP database (FHWA, 2007) provided complete data set for 30 flexible pavement sections (16 new and 14 rehabilitated sections) whereas NCDOT provided the data for 23 flexible pavement sections to be used in this local calibration and validation process. It was noted that there are significant differences in the data collection methods by LTPP and the NCDOT. For example, the pavement performance data collection methodology for the alligator cracking distress; LTPP directly measures (FHWA, 2003) the area cracked under the distress whereas NCDOT measures (NCDOT, 2006) the length of the crack with the appropriate severity rating. Hence NCDOT monitored performance data is converted into the MEPDG format before even the calibration is begun.
A complete set of database that has been developed and used in the calibration-validation process is appended (APPENDIX A: Local Calibration Database) to the thesis. The following sections explain the data collection efforts.
3.2LTPP Database
wide range of pavement information needs. LTPP program was developed mainly to gain technical knowledge as well as to seek models that help better explain the pavement performance. It was also used to study the effects of materials, loading, environmental, specific design features on the performance of the pavement.
LTPP database was the most comprehensive and reliable source (FHWA, 2007) of the pavement data for North Carolina which includes all the material, traffic and climatic data along with the performance data. Apart from the rigid pavement sections, 30 of the flexible pavement sections were extracted from the database for use in the local calibration of MEPDG. All of these pavement sections are of standard length of 500 ft and are continuously monitored for the performance data.
3.2.1 North Carolina Data Extraction
As a part of the data collection process, the LTPP database has been examined in order to extract data relevant to North Carolina. The LTPP database called the Information Management System (IMS) contains the performance data that have been collected since 1989 on approximately 2500 test sections located across North America. Currently, the LTPP IMS (FHWA, 2004) consists of 16 general data modules with 430 tables containing more than 8,000 unique data elements.
For SPS sections, the second character represents the experiment number, shown in Table 3-1, and the third and fourth characters identify the sections at the project. Every section that enters the LTPP program is first assigned a construction number of 1. The construction number is incremented by 1 whenever maintenance or rehabilitation activity takes place, regardless of its impact on the pavement.
For example, 37-0201-1 (State code – SHRP ID – construction number) represents Section No. 01 of the SPS-2 pavement in North Carolina that has not had any maintenance or rehabilitation activity since it entered the LTPP program.
Table 3-1 List of LTPP Test Sections in North Carolina According to Pavement Type
Pavement Type [SHRP ID]-[Construction Number]
JPCP over Unbound Base 0201-1, 0202-1, 0203-1, 0204-1, 3044-1 JPCP Over Non-Bituminous
Treated Base
0205-1, 0206-1, 0207-1, 0208-1, 0260-1, 3008-2, 3807-1, 3816-1
JPCP Over Bituminous Treated Base 0209-1, 0210-1, 0211-1, 0212-1, 0259-1, 3011-2 AC with Granular Base
0801-1, 0802-1, 0859-1, 1006-3, 1024-2, 1028-2, 1030-1, 1040-2, 1352-3, 1801-2, 1802-2, 1803-3,
1814-2, 1817-5, 1992-2 AC with Bituminous Treated Base 0901-1, 0902-1, 0903-1
AC Overlay on AC Pavement 0960-2, 0961-2, 0962-2, 0963-2, 0964-2, 0965-2 AC with Non-Bituminous Treated
Base 1645-2, 2819-3, 2824-3, 2825-1 CRCP - Over Unbound Base 5037-1, 5826-2, 5827-4
shrinkage at 40% relative humidity, reversible shrinkage, time to develop ultimate shrinkage, drainage and surface properties, permanent curl/warp effective temperature difference, erodibility index, base/slab friction coefficient, cracking model, long-term load transfer efficiency, PCC-base interface, loss of bond age, depth of water table, etc.
Because the data are not available for these parameters, MEPDG recommendations (NCHRP, 2004.a) are followed. Parameters such as the erodibility index, base/slab friction coefficient, PCC-base interface, and drainage and surface properties are considered to be less sensitive and, hence, their default values are considered. If the specific gravity of the bitumen is not available in the LTPP database, a value of 1.01 is recommended (PCS/Law Engineering, 1993). Similarly if not enough data are available to calculate Vbe, a rough correlation with Pb, i.e., Vbe = 2*Pb is recommended (NCHRP, 2003.a).
3.2.2 LTPP Section Performance Data
3.2.2.1Fatigue Cracking
The LTPP database provides the fatigue cracking data for each LTPP section according to severity (low, medium and high). The three fatigue cracking severity values will be summed arithmetically (NCHRP, 2003.a) to obtain the total fatigue cracking, without using any weights for each category. Note: Each LTPP section has a length of 500 ft. For the bottom-up cracking, the summation of the measured alligator cracking will be divided by the total area of the lane (12 ft x 500 ft = 6000 ft2) to calculate the percentage area cracked.
3.2.2.2Rut Depth
used for comparison to the predicted total rut depth in the analysis. The percentage from the predicted sublayer rutting will be multiplied by the average total rutting to approximate the true field rutting in each layer. This approach will be applied to estimate rutting in the base/sub-base and subgrade layers. This assumption is necessary in the rutting model development when the trench data are not available.
3.3NCDOT Database
Data for the 12 pavement sections that were constructed in the year 1993 as well as the 11 sections that were constructed in 1999 are obtained from the NCDOT Pavement Management Unit (PMU) and reviewed. From the review of the data, it is understood that not all the required MEPDG inputs are available for the given sections and, hence, engineering judgment may have to be used during the calibration. The lack of reliable data from these pavements makes the calibration depend more heavily on the LTPP sections, as they are more consistent and reliable in terms of design and performance data.
sections) to calibrate the MEPDG for a wide range of distresses. Also, no information was obtained regarding rehabilitation – if any – of the sections. It is observed also that the sections constructed in 1999 represent the transition from Marshall mix designs to Superpave mix designs.
3.3.1 Traffic
The traffic data that are required for running the MEPDG are: Average Annual Daily Truck Traffic (AADTT) data, vehicle classification, axle load distribution, and number of axles per truck. For the NCDOT sections, the Traffic Unit has provided a list of WIM (Weigh-in-Motion) station locations on or near the project along with the necessary data (C-card and W-(C-card) and recommendations. The raw data files (C-(C-card and W-(C-card) are then processed using the TrafLoad software version 1.08 (NCHRP, 2004.d) to obtain the vehicle classification, axle load distribution and number of axles per truck data. For projects where the WIM stations are located at the pavement sites, these data serve as Level 1 inputs to the MEPDG.
3.3.2 Materials
3.3.3 Climate
Climatic data (location coordinates) were missing for each of the 23 pavement sections provided by NCDOT. Google Earth software was used to estimate the latitude, longitude and the elevation data for these sections. Ground Water Table (GWT) depth values for most of the sections are provided by the NCDOT Geotechnical Unit. For those sections with missing data, the US Geological Survey (USGS, 2007) is consulted to obtain the GWT data using the latitude-longitude data.
3.3.4 NCDOT Section Performance Data
Pavement performance ratings for the 23 pavement sections are obtained from the NCDOT. The NCDOT Pavement Condition Survey Manual 2006 (NCDOT, 2006) was studied in order to understand the performance ratings given for alligator cracking and rutting. During the study, several issues are identified that need to be resolved even before the calibration process begins. One of the major issues is the difference in the methodology of collecting the distress data by LTPP and the NCDOT agencies
Therefore, it is inevitable that the NCDOT performance ratings are to be converted to a format that is easily comparable to the MEPDG predicted distresses. This conversion is necessary because the LTPP and NCDOT use different distress measurement processes. The LTPP program measures (FHWA, 2003) alligator cracking by directly measuring the area affected in the lane, whereas the NCDOT measures (NCDOT, 2006) it by assigning a rating based on the length of the section cracked.
The following facts about the pavement performance rating procedure (NCDOT, 2006) that is used by the Pavement Management Unit are to be noted:
2. It is observed that 90% of the time, the most distressed lane is the outer lane.
3. If the outer wheel path is continuously cracked, the section is rated as 100%, even if the inner wheel path exhibits some cracks; i.e., there is no way to quantify the cracking in the inner wheel path.
4. From 2002, the measurement of edge cracking (caused by the movement of soil beneath the pavement) has been combined with that of alligator cracking (caused by repeated traffic loading); i.e., there is no way to quantify or separate one type of cracking from the other.
5. The performance ratings do not indicate how much of each lane of a two-lane roadway (in an undivided case) contributes to the rating. For example, a rating of 8 for a section may mean:
a. 4 (one lane of a two-lane roadway) + 4 (the other lane), or b. 5 + 3, or any other combination.
3.3.4.1Converting the NCDOT Performance Rating to the MEPDG Format
Alligator Cracking
After reviewing the performance ratings for alligator cracking in the Pavement
For the outer lane or most distressed lane,
% Area Cracked = (NCDOT Rating×Length of the section) × (Wheel path width) ×100/Section area
= (NCDOT Rating×Length of the section) × (Wheel path width) ×100/(Length of the section×Lane width)
= (NCDOT Rating×Wheel path width) ×100/(Lane width)
= (NCDOT Rating×2.5 ft×100)/(12 ft) [Standard wheel path width = 2.5 ft; Standard lane width = 12 ft]
= (NCDOT Rating×0.20833)
For the LTPP sections in North Carolina, it is noted that the distresses are monitored only in the outer lane. For the NCDOT sections, as observed from the NCDOT pavement condition survey files, it is difficult to say whether the distresses identified are in the most distressed lane or the outside lane, even considering the fact that the distressed lane is the outside lane 90% of the time.
Rutting
3.4Summary
This chapter describes the data collection effort expended in obtaining the data from the LTPP and NCDOT databases. Thirty LTPP pavements (16 new flexible pavement sections and 14 rehabilitated sections) and 23 NCDOT pavement sections were obtained for use in the calibration process. The required data for the LTPP sections were obtained from the LTPP database, whereas data for the NCDOT sections were obtained from the Pavement Management Unit (structure, pavement condition survey files), Construction Unit (material and volumetric data – Job Mix Formulas, i.e., JMFs), Traffic Unit (AADTT, C-card and W-card data files) and the Geotechnical Unit (subgrade and ground water table depth data) of the NCDOT. The traffic data obtained from the NCDOT were processed using the TrafLoad (Version 1.08) software that was developed under the NCHRP 1-39 project. The map in Figure 3-1 below shows all the pavement sections (both LTPP and NCDOT) located in three distinct geographic areas (mountain, piedmont, and coastal regions, from left to right, respectively).
Figure 3-1 Locations of Flexible Pavement Sections Included in the Study Mountain
Region Piedmont
Region
CHAPTER 4 SENSITIVITY ANALYSIS
4.1Introduction
The MEPDG has been developed to be relevant to climatic and material conditions for the whole nation and, therefore, includes variables that may or may not be pertinent to North Carolina. Hence, a sensitivity analysis has been conducted in order to determine which variables are appropriate for North Carolina. Based on this analysis, an importance ranking can be assigned to each input; such a ranking significantly helps to reduce the effort and cost in obtaining the inputs that are less sensitive to the pavement performance. This study also provides a better understanding of the design parameters that affect certain pavement performances the most, thus stressing the importance of careful consideration for these parameters before the design process even begins.
Several papers have been presented at the Transportation Research Board (TRB) 2006 annual meeting regarding the MEPDG’s sensitivity analysis of various input parameters for both flexible and rigid pavements. A brief summary of these papers is provided below.
4.2Literature Review
4.2.1 Rigid Pavements
sensitivity plots. The numerical criteria used to differentiate the sensitivity levels are not presented in the paper. In general, the curl/warp effective temperature difference, the coefficient of thermal expansion, and the thermal conductivity exhibit the greatest impacts on the distresses.
In another study (Hall and Beam, 2005), 29 inputs were evaluated one at a time. This study reports that three models (cracking, faulting, and roughness) are sensitive for only 6 out of 29 inputs and insensitive to 17 out of 29 inputs, resulting in combinations of only one or two of the distress models sensitive to 6 out of 29 inputs. However, changing only one variable at a time results in little information regarding the interaction among the variables. That is, it is not known whether the distress prediction may show sensitivity to a particular variable for all the values of the remaining variables. The sensitivity criteria used in this study for the faulting model is that the differences in total faulting after 20 years exceeding 0.1 in. were judged significant. For the cracking model, differences in the percentage of slabs cracked after 20 years exceeding 25% were judged significant. For the smoothness model, differences after 20 years exceeding 30 in./mile were judged significant. It is also mentioned that the specific numerical criteria used in this study were chosen arbitrarily, based primarily on the author’s experience.
reasonable predictions of the pavement performance.
4.2.2 Flexible Pavements
A sensitivity analysis study (Ceylan and Coree, 2006) evaluates 20 input parameters varying them one at a time, by using 50% reliability. As part of their study, a limited study on 2-way interactions among the inputs was also carried out by varying two inputs at a time, but no input parameter was found to be sensitive to all the performance measures. The same criteria used to determine the sensitivity level of the input parameters in rigid pavements (Section 4.2.1) was applied to flexible pavement input parameters.
Another study (Graves and Mahboub, 2006) employs global sensitivity analysis using a random sampling based technique over the entire input parameter range. A total of 100 design sections were randomly sampled using the Monte Carlo sampling routine from these input parameters, and the resulting predicted performances were analyzed using the Pearson and Spearman correlation coefficients. The results indicate that this type of sensitivity analysis may be used to identify important input parameters across the entire parameter space, utilizing a sampling-based technique where the entire input parameter space of selected input variables is sampled. These samples are then used to create a matrix of design scenarios which are then run through the MEPDG software which, in turn, predicts the various performance parameters of each design scenario. These performance outputs and the corresponding input parameters are then analyzed to evaluate the sensitivity of each input parameter with respect to each predicted distress. As the number of inputs to be evaluated increase, the number of scenarios increases significantly.
cracking. The influence of these properties on alligator cracking is approximately half of that on longitudinal cracking. The study also indicates that the granular base material properties do not seem to have an influence on the permanent deformation of the pavement. However, one study (Graves and Mahboub, 2006) shows that this type of analysis does not reflect the influence of the variation of the other parameters in the model because the inputs are varied one at a time, thus keeping the other inputs constant. Further, if predicted alligator cracking changes from 2% to 3% due to the change in a given input variable, then such a change represents a significant finding since the cracking changes by 50 percent. However, in terms of evaluating a particular design, neither 2% nor 3% is significant in selecting a pavement structure.
4.2.3 Traffic Sensitivity
A traffic sensitivity analysis study (Papagiannakis and Bracher, 2006) evaluates the potential sensitivity of the various hierarchal levels and sampling schemes for the MEPDG traffic inputs. These hierarchal levels deal with the source of traffic data that are utilized in the design, site-specific WIM, classification, volume, etc., or regional and national average values. The study illustrates that the variability of traffic data may have a significant impact on the predicted performance of the pavement system. It also shows that regional WIM data generally provide designs that overestimate the base case (continuous site-specific data) by less than 20 percent.
4.2.4 Insensitive Input Parameters
assume that these inputs do not have significant effects for North Carolina. These inputs are described below.
4.2.4.1Rigid Pavements
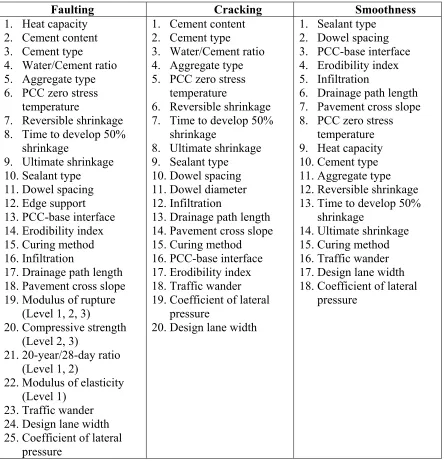
The following is a list of inputs which are found to be insensitive in all the referred studies.
Table 4-1 Insensitive Parameters, from Literature Review
Faulting Cracking Smoothness
1. Heat capacity 2. Cement content 3. Cement type
4. Water/Cement ratio 5. Aggregate type 6. PCC zero stress
temperature
7. Reversible shrinkage 8. Time to develop 50%
shrinkage
9. Ultimate shrinkage 10.Sealant type 11.Dowel spacing 12.Edge support 13.PCC-base interface 14.Erodibility index 15.Curing method 16.Infiltration
17.Drainage path length 18.Pavement cross slope 19.Modulus of rupture
(Level 1, 2, 3)
20.Compressive strength (Level 2, 3)
21.20-year/28-day ratio (Level 1, 2)
22.Modulus of elasticity (Level 1)
23.Traffic wander 24.Design lane width 25.Coefficient of lateral
pressure
1. Cement content 2. Cement type
3. Water/Cement ratio 4. Aggregate type 5. PCC zero stress
temperature
6. Reversible shrinkage 7. Time to develop 50%
shrinkage
8. Ultimate shrinkage 9. Sealant type 10.Dowel spacing 11.Dowel diameter 12.Infiltration
13.Drainage path length 14.Pavement cross slope 15.Curing method 16.PCC-base interface 17.Erodibility index 18.Traffic wander 19.Coefficient of lateral
pressure
20.Design lane width
1. Sealant type 2. Dowel spacing 3. PCC-base interface 4. Erodibility index 5. Infiltration
6. Drainage path length 7. Pavement cross slope 8. PCC zero stress
temperature 9. Heat capacity 10.Cement type 11.Aggregate type 12.Reversible shrinkage 13.Time to develop 50%
shrinkage
14.Ultimate shrinkage 15.Curing method 16.Traffic wander 17.Design lane width 18.Coefficient of lateral
The inputs that are found to be common to all three distresses are cement type, aggregate type, PCC-zero stress temperature, reversible shrinkage, time to develop 50% shrinkage, ultimate shrinkage, curing method, sealant type, infiltration, drainage path length, pavement cross slope, dowel spacing, PCC-base interface, erodibility index, traffic wander, design lane width, and coefficient of lateral pressure.
4.2.4.2Flexible Pavements
Five performance measures (alligator cracking, longitudinal cracking, rutting, transverse cracking, and IRI) are studied in all the sensitivity analyses for flexible pavements. The following parameters are found to be insensitive:
1. Aggregate thermal coefficient
2. Type of sub-base 3. Traffic wander
4.3Sensitivity Analysis Plan
not necessarily indicate that they are not important; rather, they may turn out to be very sensitive for the pavement performance. Hence an input range has been developed based on a typical range of values as specified by the MEPDG, best guesses and values that are typically used by the NCDOT.
4.3.1 Selection of Pavements
North Carolina is divided into three distinct geographical areas – the coastal plain in the east, the piedmont in the center, and the mountains in the west – and thus experiences a wide variety of climatic conditions. All the LTPP sections are categorized according to pavement type and climatic region, as shown in Table 4-2.
Table 4-2 Pavement Classification According to Climate and Structure
Climatic Regions
No. Pavement
Type Mountains Piedmont Coastal Plain
1 AC with Granular Base
1801-2, 1803-3, 1040-2, 1814-2,
1024-2
1817-5, 1352-3, 1992-2, 1802-2, 1006-3
0801-1, 0802-1, 0859-1 2 Bituminous AC with
Treated Base
0901-1, 0902-1, 0903-1 1030-1, 1028-2
3
AC with Non-Bituminous Treated Base
2819-3, 2824-3, 2825-1 1645-2
4 Unbound base JPCP over 0201-1, 0202-1, 0203-1, 0204-1, 3044-1
5
JPCP over Bituminous Treated Base
0209-1, 0210-1, 0211-1,
0212-1, 0259-1 3011-2
6
JPCP over Non-Bituminous Treated Base
0205-1, 0206-1, 0207-1, 0208-1, 0260-1, 3008-2,
3807-1, 3816-1 7 Unbound Base CRCP over 5037-1, 5826-2 5827-4
For sensitivity analysis, pavements are selected from each cell of the above table so that the structure and climatic inputs are the same among the selected pavements. Therefore, the only inputs that are left to be studied for the analysis are the traffic and material inputs.
4.3.1.1Material Sensitivity Analysis
One LTPP section is selected from each cell in Table 4-2 above as a base case, and the variation of each material input parameter is studied for the remaining pavements in the same cell, resulting in minimum and maximum values for each input along with the base value (from the base case). Site-specific traffic data from the base pavement are used throughout the material sensitivity analysis.
For the HMA dynamic modulus, an analysis is performed to assess the use of different levels of input. Level 1 includes the input of dynamic modulus |E*| values for different temperatures and frequencies obtained from the earlier NCDOT project (Kim, King and Momen, 2004). It also includes the input of G* and phase angle data for different temperatures. Level 2 requires only the input of the mix gradation and G* values. Level 3 includes the input of the mix gradation and binder viscosity obtained from the same NCDOT project (Kim, King and Momen, 2004). Here it is assumed that the |E*|, G*, and mix gradation values represent the site-specific material properties for the LTPP sections, so that the effect of using Level 1 inputs versus the Level 3 inputs can be identified.
4.3.1.2Traffic Sensitivity Analysis