INVESTIGATION HIGHLIGHTED ARTICLE
Modular Skeletal Evolution in Sticklebacks
Is Controlled by Additive and Clustered
Quantitative Trait Loci
Craig T. Miller,*,†,1,2Andrew M. Glazer,*,1Brian R. Summers,†Benjamin K. Blackman,†,3Andrew R. Norman,†,4 Michael D. Shapiro,†,5Bonnie L. Cole,†,6Catherine L. Peichel,†,7Dolph Schluter,‡and David M. Kingsley†,2
*Molecular and Cell Biology Department, University of California, Berkeley, California 94720,†Department of Developmental
Biology and Howard Hughes Medical Institute, Stanford University, Stanford, California 94305, and‡Department of Zoology,
University of British Columbia, Vancouver, British Columbia V6T 1Z4, Canada
ABSTRACTUnderstanding the genetic architecture of evolutionary change remains a long-standing goal in biology. In vertebrates, skeletal evolution has contributed greatly to adaptation in body form and function in response to changing ecological variables like diet and predation.
Here we use genome-wide linkage mapping in threespine sticklebackfish to investigate the genetic architecture of evolved changes in many
armor and trophic traits. We identify.100 quantitative trait loci (QTL) controlling the pattern of serially repeating skeletal elements, including gill rakers, teeth, branchial bones, jaws, medianfin spines, and vertebrae. We use this large collection of QTL to address long-standing questions about the anatomical specificity, genetic dominance, and genomic clustering of loci controlling skeletal differences in evolving populations. We
find that most QTL (76%) that influence serially repeating skeletal elements have anatomically regional effects. In addition, most QTL (71%) have at least partially additive effects, regardless of whether the QTL controls evolved loss or gain of skeletal elements. Finally, many QTL with high LOD scores cluster on chromosomes 4, 20, and 21. These results identify a modular system that can control highly specific aspects of skeletal form. Because of the general additivity and genomic clustering of major QTL, concerted changes in both protective armor and trophic traits may occur
when sticklebacks inherit either marine or freshwater alleles at linked or possible“supergene”regions of the stickleback genome. Further
study of these regions will help identify the molecular basis of both modular and coordinated changes in the vertebrate skeleton.
U
NDERSTANDING the quantitative genetic architectureunderlying evolutionary change in nature remains a ma-jor goal in genetics. The past two decades have seen a rapid
increase in experimental data from various model systems, generating vigorous debate over the relative importance of
coding vs. regulatory alleles, the prevalence of pleiotropy,
and the role of large-effect mutations during adaptation to new environments (Stern and Orgogozo 2008; Streisfeld and Rausher 2011; Rockman 2012).
One particularly interesting genetic architecture found in several natural systems is close linkage of loci controlling multiple, often coadaptive, phenotypes. Such trait clusters,
sometimes called “supergenes,” have been observed in
primroses (Darwin 1877; Mather 1950; Liet al.2011),
but-terflies (Clarkeet al.1968; Mallet 1989; Joronet al.2006),
snails (Murray and Clarke 1976), and fish (Winge 1927;
Protas et al. 2008; Roberts et al. 2009; Tripathi et al.
2009). Trait clusters could result from recombination
sup-pression (Noor et al. 2001), for example through
chromo-somal inversions (Lowry and Willis 2010; Joronet al.2011;
Fishmanet al.2013). Alternatively, trait clusters could result
from tightly linked loci or pleiotropic effects of individual genes (Mallet 1989; Studer and Doebley 2011). Having
Copyright © 2014 by the Genetics Society of America doi: 10.1534/genetics.114.162420
Manuscript received January 31, 2014; accepted for publication February 22, 2014; published Early Online March 19, 2014.
Supporting information is available online athttp://www.genetics.org/lookup/suppl/ doi:10.1534/genetics.114.162420/-/DC1.
1These authors contributed equally to this work.
2Corresponding authors: Department of Molecular and Cell Biology, 142 Life Sciences
Addition, University of California, Berkeley, CA 94720. E-mail: [email protected]; and Department of Developmental Biology, 279 Campus Dr., Howard Hughes Medical Institute and Stanford University School of Medicine, Stanford, CA 94305. E-mail: [email protected]
3Present address: Department of Biology, University of Virginia, Charlottesville, VA
22904.
4Present address: Department of Biochemistry, University of California, San
Francisco, CA 94158.
5Present address: Department of Biology, University of Utah, Salt Lake City, UT
84112.
6Present address: Department of Anatomic Pathology, University of Washington,
and Department of Laboratories, Seattle Children’s Hospital, Seattle, WA 98105.
7Present address: Divisions of Human Biology and Basic Sciences, Fred Hutchinson
Cancer Research Center, Seattle, WA 98109.
multiple different phenotypes controlled by the same geno-mic region could greatly facilitate rapid adaptive evolution
(Kirkpatrick and Barton 2006; Feder et al. 2011; Yeaman
and Whitlock 2011).
Adaptive mutations may arisede novoor be selected from
preexisting standing variants that become favorable following environmental change. When selection acts on newly arising mutations, dominant alleles should have a higher probability
offixation than recessive alleles (Haldane 1927). However, if
previously unfavorable standing variant alleles become ad-vantageous following environmental change, there is little bias in the likelihood of alleles of different dominances to
sweep to fixation (Orr and Betancourt 2001). Therefore in
systems where selection from standing variation predomi-nates, the observed distribution of dominances should largely
reflect the underlying distribution of dominances of
advanta-geous mutations. Although most new mutations are recessive (Fisher 1928; Orr 1991), advantageous mutations may have a different distribution of dominances than all mutations. Dominance distributions of adaptive mutations are still poorly characterized, particularly for alleles underlying morphologi-cal traits in natural vertebrate populations.
Cis-regulatory changes may predominate during
morpho-logical evolution because of the highly pleiotropic effects of developmental regulatory genes (Stern 2000; Carroll 2008).
Protein-coding changes in such genes will alter the gene’s
function at all sites of expression. In contrast,cis-regulatory
changes can alter expression at highly specific times or
loca-tions, limiting phenotypic effects to subdomains of a gene’s
function. This idea predicts that quantitative trait loci (QTL) controlling adaptive morphological changes may typically act in subsets of anatomical regions. Although this idea
can be tested by looking for regionalvs.global effects among
evolutionary QTL that influence serially repeating
morphol-ogy, few studies have examined large numbers of traits to test the prevalence of modular genetic effects in naturally
evolved species (Wagneret al.2007).
The threespine stickleback (Gasterosteus aculeatus) species
complex provides a powerful system for forward genetic dis-section of repeated evolution in nature. Migratory marine sticklebacks colonized thousands of new freshwater lakes and streams following the last Ice Age. Newly established freshwater populations evolved similar phenotypes in re-sponse to similar ecological conditions, providing strong evidence that the corresponding traits evolve by natural selection (Schluter 2000). Despite dramatic morphological and physiological differences among sticklebacks, intercrosses between populations produce viable and fertile offspring, making it possible to study the genetic and genomic mecha-nisms that underlie adaptive evolution in new environments
(reviewed in Kingsley and Peichel 2007; Schluteret al.2010).
The remarkably compact genome size (460 Mb) has
facili-tated a high-quality genome assembly and resequencing of
fish from 20 different populations, revealing abundant reuse
of standing variants as one of several mechanisms underlying
evolutionary differences in this system (Joneset al.2012b).
Previous studies have identified many trophic and defensive
armor traits that evolve repeatedly in freshwater (Bell and Foster 1994). A classic case of ecology-driven natural selection is the reduction in number of gill raker bones (Schluter 2000) in countless freshwater stickleback populations throughout the northern hemisphere (Hagen and Gilbertson 1972; Gross and
Anderson 1984). Oceanicfish primarily feed on tiny
zooplank-ton in the water column, while freshwaterfish adapted to the
benthic zone (bottom of lake) have shifted to a diet of larger invertebrates living in sediments or attached to vegetation (Kislalioglu and Gibson 1977; Gross and Anderson 1984). Both reduced gill raker number and larger jaw gape are found in benthic-adapted species (Schluter and McPhail 1992). While large jaws and low gill raker counts correlate with more suc-cessful benthos foraging (Lavin and McPhail 1986), small jaws and high gill raker counts correlate with more successful for-aging of small prey from the water column (Bentzen and McPhail 1984). Benthic-adapted stickleback forms also display changes in skull morphology that distinguish them from forms
adapted to eat smaller prey items (Willacker et al. 2010;
McGee et al. 2013). Collectively, these studies suggest that
a concerted set of craniofacial changes allows freshwater
pop-ulations to forage more efficiently on new diets in freshwater
habitats. In addition to head skeletal traits, aspects of the
me-dianfin and vertebral skeleton are known to vary and be under
selection in stickleback populations. These include dorsal spine
lengths (Gross 1978; Bellet al.2006; Huntet al.2008), the
number and position of dorsal and anal fin rays and their
supporting pterygiophores, and vertebral number and position-ing (Swain 1992a,b; Ahn and Gibson 1999).
Here we apply genome-wide linkage mapping to
in-vestigate the genetic architecture of .100 trophic, armor,
and serially repeating skeletal traits in sticklebacks. Using
a large set of newly identified QTL, we address several
gen-eral questions in evolutionary genetics, including the extent to which loci are clustered in the genome, the dominance distribution of evolutionary alleles, and the proportion of loci that have anatomically regional effects. Our results show that loci controlling both regressive (loss) and con-structive (gain) traits are clustered in the stickleback ge-nome, making it possible to shape multiple aspects of both trophic and defensive morphology by co-inheritance of ma-rine or freshwater alleles at linked loci.
Materials and Methods Ethics statement
All animal work was approved by University of British Columbia and Stanford University Institutional Animal Care and Use Committees (protocols A97-0298 and 13834).
QTL mapping
A family of 370 full-sibling F2fish derived from a Japanese
Pacific marine grandmother and a Paxton Lake (British
Co-lumbia, Canada) benthic freshwater grandfather (Colosimo
et al.2004) was genotyped with 275 microsatellite markers
and phenotyped for 110 skeletal traits across eight trait clas-ses. Linkage map construction, skeletal phenotype analyses,
trait transformations, significance threshold determinations,
and QTL mapping using R/qtl (Broman and Sen 2009) are
described in Supporting Information, File S1. New
micro-satellite markers are listed inTable S1. QTL within the same
trait class with overlapping 1.5-LOD intervals werefiltered,
keeping the QTL with the highest LOD and removing
lesser-effect QTL to avoid redundant QTL sampling. This filtered
QTL set was used for all dominance and clustering analyses.
All raw phenotype, adjusted phenotype (seeTable S2), and
genotype data used for QTL mapping are presented in File
S2. Details on the genetic positions, effect sizes, and
domi-nances of all QTL are presented inFile S3andFile S4.
Anatomical specificity of QTL
For investigating the anatomical specificity of QTL, the
subset of QTL with clearly or likely serially homologous domains (QTL controlling gill raker number, pharyngeal tooth number, branchial bone length, upper and lower jaw size, and dorsal spine lengths) was considered. QTL were considered regional if they affected a subset of domains and global if they affected all domains.
Dominance analyses
To calculate the dominance of each QTL, Z-scored residual
phenotypes were first calculated from a linear regression of
the phenotype against all other peak marker genotypes affect-ing that phenotype. For calculataffect-ing dominance, the equation
d/a(Falconer 1989) was used, witharepresenting the additive
effect of one additional benthic allele (i.e., half the phenotypic
difference between the homozygous benthic and homozygous
marine genotypic classes).drepresents the dominance effect:
the difference between the heterozygous phenotype and the midpoint between homozygous parental phenotypes. Similar
to a sunflower domestication QTL study (Burke et al.2002),
we used the following d/a ranges to classify the dominance
effect of benthic alleles:, 21.25 for underdominant,21.25 to
20.75 for recessive, 20.75 to 20.25 for partially recessive,
20.25 to 0.25 for additive, 0.25 to 0.75 for partially dominant,
0.75 to 1.25 for dominant, and.1.25 for overdominant. For
each QTL, one value ofaand two values ofdwere calculated
by Haley–Knott regression, as two classes of heterozygous F2
animals were present. For 2 of 342 QTL, the chromosome had
only one heterozygous genotypic class (because F1parents had
same heterozygous genotypes across this chromosome). For
these 2 QTL, the single value of d was counted twice. For
the other 340 QTL,dfor both the M1B1and M2B2(M, marine;
B, benthic) heterozygous genotypic classes was calculated.
Simulations investigating dominance bias in detection, i.e.,
whether additive QTL were less likely to be detected than
re-cessive or dominant QTL, are described inFile S1.
Tests of trait clustering
To determine whether QTL were significantly clustered in
the genome, we took the observed number of QTL per trait
class for (1) all QTL or (2) large-effect QTL, defined as the
top quartile of QTL by LOD score (LOD.8.95, seeFile S1).
We then simulated 1000 random placements of peak markers in the genome, allowing only one QTL per trait
class per chromosome (similar to the QTL filtering method
described above). For each simulation, we determined the
number of QTL with peak markers ,5 cM away. We
calcu-lated P-values by comparing the observed number of QTL
having peak markers within 5 cM to this null distribution. To determine whether the number of QTL on a single
chromo-some was significantly enriched relative to a null hypothesis
of independent and evenly distributed QTL, simulations were also performed with all of the QTL or the top quartile of QTL by LOD score. For each simulation, the observed total number of trait classes with QTL on each chromosome was determined. This observed set of QTL for each trait class was distributed randomly to chromosomes without replacement with probability in proportion to (1) the genetic length of the chromosome, (2) the physical length of the chromosome
(Jones et al. 2012b), or (3) the number of
Ensembl-predicted genes (Jones et al. 2012b) within the
chromo-some. For each case, 10,000 simulations were performed to calculate a null distribution of QTL per chromosome as
well as a mean number of“expected”QTL. For every
chro-mosome, the true number of QTL was compared to the null
distribution to calculate aP-value. Since sexually dimorphic
traits represent a genetic effect of the sex chromosome (chromosome 19) and this effect was largely statistically removed prior to QTL mapping, chromosome 19 was ex-cluded from the clustering simulations and analysis.
Results
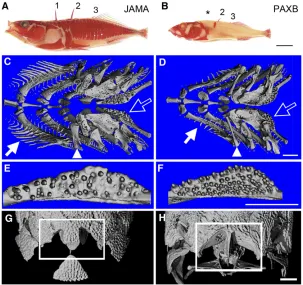
Major skeletal differences between marine and freshwaterfish
The skeletons of Paxton benthic freshwater (PAXB) stickle-backs show multiple obvious reductions in external bones
compared to Japanese Pacific marine (JAMA) animals,
including reduced size and number of armor plates, loss of
pelvicfins, and reduced length of dorsal spines (Figure 1, A
and B). In addition, computerized tomography (Figure 1, C–
H) revealed a mixture of both regressive (“loss”) and
con-structive (“gain”) traits in the skull and internal branchial
skeleton of PAXB sticklebacks. The derived freshwater fish
show dramatic reductions in the number and length of gill rakers (Figure 1, C and D), as expected based on previous
studies (McPhail 1992; Kitanoet al.2007). However, PAXB
branchial bones, especially the first epibranchial, have
in-creased in length compared to their marine counterparts
(arrowheads in Figure 1, C and D). In addition, PAXBfish
have roughly twice the number of ventral pharyngeal teeth seen in JAMA animals (Figure 1, E and F). Compared to
marine animals, PAXB fish also show a longer and thinner
supraoccipital crest, a posterior process on the supraoccipital bone at the back of the skull that serves as the insertion point for muscles involved in buccal cavity opening (Figure 1, G
and H). Increased size of these muscles is a characteristic
feature of PAXBfish, and is thought to increase force
gener-ation and suction pressure for feeding on attached littoral
prey items (McGeeet al.2013).
To investigate the genetic architecture underlying the evolution of these trophic, armor, and other skeletal traits,
we used genome-wide linkage mapping in a large marine3
benthic F2genetic cross previously studied for lateral plate,
pelvic spine, and pigmentation patterning (Colosimo et al.
2004, 2005; Shapiro et al. 2004; Miller et al. 2007). We
phenotyped 370 full-sibling F2fish from this cross and then
mapped QTL influencing 110 different skeletal phenotypes
(Table S2), including a large number of traits in the
bran-chial skeleton (Figure 2, A–I); multiple aspects of jaw, skull,
and opercle morphology (Figure 2, J–O); dorsal and anal
spine lengths and degree of spine serrations (Figure 2, P and
Q); and several median fin and vertebral traits (Ahn and
Gibson 1999) proposed to be important for freshwater ad-aptation (Figure 2Q).
Most traits are sexually dimorphic
As most traits (93 of 110) are size and/or sex dependent, we
systematically corrected for size and/or sex (Table S2). In
total, 72 traits showed significant differences between the
sexes (Table S3). The traits that show dimorphism, and the
direction of dimorphism, were largely consistent with pre-vious reports. For example, males had bigger jaws, more oral teeth, more vertebrae, fewer abdominal vertebrae,
more dorsal and anal fin rays, more pterygiophores, and
dorsal spines with more serrations both in the current study
and in previous studies (Lindsey 1962; Reimchen and Nelson
1987; McPhail 1992; Caldecuttet al.2001; Kitanoet al.2007,
2009).
Most QTL are anatomically specific
Raw or corrected trait values (Table S2) and a genome-wide
linkage map (Figure S1) were used to map QTL with
a multiple-QTL mapping approach in R/qtl (Broman and
Sen 2009). This analysis (described in File S1) identified
342 total QTL for 92 of the 110 traits (File S3). Based on
segmental homology and likely embryonic origin, we divided the 110 skeletal traits into eight trait classes: rakers, teeth,
branchial bones, jaw, skull, opercle, medianfin, and vertebrae
(Figure 3). In cases where a particular chromosome region had an effect on multiple phenotypes within the same trait class, it is parsimonious to assume that a single underlying QTL affected the trait across several domains. Thus, for our analysis of the properties of these QTL, we conservatively
con-sidered such QTL only once. To define a minimally
nonredun-dant set of QTL by trait class, we included only QTL whose
1.5-LOD intervals [an95% confidence interval (Dupuis and
Siegmund 1999)] did not overlap. Thisfiltering defined a set
of 118 QTL across the eight trait classes (Table S4, Figure 3).
The overall distribution of percentage of variance explained (PVE) of these QTL consisted of many small-effect QTL and
few large-effect QTL (Figure S2), similar to that in a previous
stickleback shape QTL study (Albert et al. 2008). For trait
classes that had multiple serially homologous anatomical domains or elements (raker number, teeth, branchial, jaw, and spine classes), we asked whether QTL controlling these
Figure 1 Evolved skeletal differences between marine and benthic sticklebacks. Skeletal morphology was revealed by Alizarin red staining (A and B) or microcomputerized
tomography (C–H) of adult Japanese Pacific marine (JAMA)
(A, C, E, and G) and Paxton benthic freshwater (PAXB) (B, D, F, and H)fish. (A and B) Lateral views of bone-stained adults reveal differences in dorsal spine lengths. Three dorsal spines are numbered in A. Thefirst dorsal spine is missing (asterisk) in this PAXBfish. (C and D) Dorsal views of branchial skel-etons reveal fewer and less densely spaced gill rakers (white arrows) and longer branchial bones (white arrowheads) in PAXB. (E and F) Ventral pharyngeal toothplates (labeled with open white arrow in C and D) reveal higher tooth number in PAXB. (G and H) Dorsal views of skulls reveal differences in the size and shape of the supraoccipital crest (white boxes). The JAMA supraoccipital crest is shorter and wider but larger in area, while the PAXB supraoccipital crest is longer and
narrower, smaller in area, andflanked by more robust
in-sertion points for the epaxial muscles. Bars, 1 mm.
traits had anatomically regional or global effects. Of this set of QTL, a large majority (76%) affected only a subset of the possible domains while 24% affected all domains (Figure 4,
Figure S3,Figure S4,Figure S5,Figure S6,Figure S7,Table S5).
Gill rakers:Gill rakers are present in nine rows from anterior to posterior and in four regions from dorsal to ventral (Figure
2, A–E). Given well-established regional developmental
ge-netic control of pharyngeal segments along the anterior/
posterior (A/P) and dorsal/ventral (D/V) axes (e.g.,Hoxgene
control of segmental identity and Dlxgene control of D/V
patterning, reviewed in Minoux and Rijli 2010), we scored and mapped gill raker number separately for each individual A/P and D/V domain, as well as composite phenotypes that
represented putative developmental domains [e.g., all ventral
(cerato) rakers]. Overall, we found 23 QTL controlling gill raker number or spacing. The raker QTL displayed a high
degree of regional specificity, with no QTL having significant
effects in all possible domains (Table S5, Figure 4). For
ex-ample, the largest-effect gill raker QTL mapped to
chromo-some 20 and had strictly ventral (cerato)-specific effects on
raker number, while chromosomes 10 and 7 had regional effects on joint and hypo rakers, respectively (Figure 4 and
Figure S3). Additionally, on chromosome 4, the second-largest-effect raker QTL mapped to one end of the chromosome and
was largely ventral (cerato)-specific, whereas a
nonoverlap-ping region more centrally located on chromosome 4 had
a dorsal (epi)-specific effect on raker number (see below).
Both chromosome 4 and chromosome 20 large-effect gill raker number QTL controlled gill raker number at least in
Figure 2 Raker, tooth, branchial bone, jaw, skull, opercle, medianfin, and vertebral skeletal phenotypes. (A–I) Bran-chial skeleton from Alizarin red-stained F2fish, dissected
andflattened into two-dimensional preparation by single
incision along the dorsal midline. All branchial bones, in-cluding pharyngeal toothplates and gill rakers, are readily visible. Bars, 1 mm. (A) Nine rows of gill rakers (R1–R9), pseudocolored black on left half, line the anterior and posterior faces of each segment, except for the last seg-ment, which lacks gill rakers on its posterior side. (B–E)
Dorsal–ventral domains of gill rakers, defined by edges of
branchial bones (seeFile S1) from ventromedial to dorsal:
hypo (B), cerato (C), joint (D), and epi (E) gill raker domains. (F) Three interraker spacing measurements in lateral (LSP), middle (MISP), and medial (MESP) regions of row 2 cerato rakers. (G) Three pharyngeal toothplates (two dorsal and one ventral) are present on each side. (H) Pharyngeal toothplate lengths and widths. (I) Branchial bone lengths. (J) Dorsal view of premaxilla bone (upper jaw) traits. (K) Lateral view of dentary bone (lower jaw, shown with articular posteriorly). (L) Lateral view of artic-ular bone traits. (M) Dorsal view of frontal bone width (or interorbital distance). (N) Dorsal view of caudal end of supraoccipital bone, with supraoccipital crest area shaded gray (also see Figure 1, G and H). (O) Lateral view of opercle bone traits. (P) Second dorsal spine area and
ser-ration traits. (Q) X ray showing spine, median fin ray,
and vertebral position landmarks. Abbreviations (defined
inTable S2): AFR, number of analfin rays; AH, articular height; AL, articular length; ASL, anal spine length; CB1L, ceratobranchial 1 length; CB2L, ceratobranchial 2 length; CB3L, ceratobranchial 3 length; CB4L, ceratobranchial 4
length; CB5L, ceratobranchial 5 length; DFR, dorsalfin ray
number; DH, dentary height; DL, dentary length; DS1L, dorsal spine 1 length; DS2L, dorsal spine 2 length; DS3L, dorsal spine 3 length; DTP1, dorsal toothplate 1; DTP1L, dorsal toothplate 1 length; DTP1W, dorsal toothplate 1 width; DTP2, dorsal toothplate 2; DTP2L, dorsal toothplate 2 length; DTP2W, dorsal toothplate 2 width; EB1L, epibranchial 1 length; FW, frontal width; IL1, in-lever 1 of the articular; IL2, in-lever 2 of the articular; LAP, vertebrae number of last anal pter-ygiophore; LDP, vertebrae number of last dorsal pterygio-phore; LSP, lateral row 2 raker spacing; MESP, medial row 2 raker spacing; MISP, middle row 2 raker spacing; OPL, opercle length; OPN, opercle neck width; OPW, opercle width; PD3, vertebrae number of third predorsal pterygiophore; PMH, premaxilla height; PML, premaxilla length; PMW, premaxilla width; R1–R9, rows 1–9 of gill rakers; SDSA, smoothened dorsal spine 2 area; SOL, supraoccipital crest length; SOW, supraoccipital crest width; SPA, dorsal spine 2 area; SRA, spine 2 serration area; VN, total vertebrae number; VTP, ventral toothplate; VTPL, ventral toothplate length; VTPW, ventral toothplate width.
part through controlling gill raker spacing, as row 2 interraker spacing mapped strongly to an overlapping region of chromo-somes 4 and 20. Four raker QTL (right chromosome 4 and chromosomes 6, 11, and 13) had a raker spacing measure-ment map more strongly than any raker number trait.
Teeth: We identified 20 QTL on 14 chromosomes control-ling tooth number or toothplate size (Figure 2, G and H),
including two QTL with large effects on tooth number (
Ta-ble S4). A QTL on chromosome 21 explained nearly a third of the variance in ventral pharyngeal tooth number, while
Figure 3 Genome-wide over-view of detected skeletal QTL. Classes of traits are grouped on the left and individual traits listed on the right. Abbreviations are
defined in Figure 2 legend and
in Table S2. For each trait, the LOD score for each QTL on each chromosome is indicated by the heat map shown at the top left, with“gain”traits (benthic allele confers more or bigger bones)
colored red and “loss” traits
(benthic allele confers fewer or smaller bones) colored blue. Het-erotic QTL (homozygous marine
and benthic F2fish do not differ
significantly in phenotype by
two-tailedt-test) and vertebral
posi-tion QTL (trait is neither loss nor gain) are shaded gray.
a QTL on chromosome 4 had large effects on dorsal pharyn-geal tooth number. All tooth number QTL had stronger
effects (.2 LOD units difference) on either dorsal or ventral
pharyngeal tooth number (Figure S4). Genetic control of
oral and pharyngeal tooth variation appeared largely inde-pendent. Although oral tooth number in the upper jaw was
sexually dimorphic (Table S3) as previously reported for
several wild stickleback populations (Caldecuttet al. 2001),
no autosomal QTL for oral tooth number were detected (Table S2).
Branchial bones: We measured the lengths of all five ceratobranchials (large ventral bones in the branchial
skeleton), as well as thefirst epibranchial, a dorsal branchial
bone (Figure 2I). We identified 16 QTL on 14 chromosomes
controlling branchial bone length, including two QTL on chromosomes 4 and 21 that had large effects on ventral
and dorsal bones, respectively (Table S4,Figure S5). QTL
with anatomically regional or broad effects were both detected in the cross: four QTL (chromosomes 1, 7, 10,
and 12) had significant effects on only one of six bones
analyzed, while 4 other QTL (chromosomes 2, 4, 5, and 8)
had significant effects on all six branchial bones analyzed.
Jaw: Unlike the branchial bones, which ossify
endochon-drally, the premaxilla and dentary, the major bones of the
fish upper and lower jaw (Figure 2, J–L), respectively, are
dermal bones that form without a cartilage intermediate (Anker 1974; Cubbage and Mabee 1996). We detected 15
QTL on 14 chromosomes controlling jaw morphology (Table
S4,Figure S6). Eleven QTL influenced the size of the pre-maxilla, with the largest-effect QTL on chromosome 21. Ten
QTL influenced the size of the dentary and the associated
articular bone, with the largest-effect QTL mapping to chro-mosome 4. Three QTL (chrochro-mosomes 2, 3, and 20) con-trolled upper but not lower jaw size and 3 other QTL (chromosomes 9, 16, and 17) controlled lower but not
up-per jaw size (Figure S6). In contrast, 7 QTL (chromosomes
4, 5, 7, 12, 14, 19, and 21) had significant effects on both
the upper and lower jaw.
Skull: In the posterior skull, the supraoccipital crest is
longer and thinner in benthic fish than in marine fish
(Figure 1, G and H, and Figure 2, M and N). The supra-occipital crest serves as the attachment points of the epaxial muscles that generate force during suction feeding. These
muscles are larger in Paxton benthic fish, contributing to
a derived increase in suction index (McGee and Wainwright 2013). We hypothesized that these differences in supraocci-pital crest morphology are adaptive for benthic feeding and have a heritable genetic component. We measured supra-occipital crest length, width, and area and a fourth skull
trait, frontal width (interorbital distance). We identified
12 QTL that affect these skull traits (Table S4), including
a large-effect QTL on chromosome 20 that significantly
influenced supraoccipital crest width and area.
Figure 4 Skeletal QTL with anatomically regional effects. (A) Proportion of QTL with regionalvs.global effects. For trait classes containing multiple serial or developmental homologous elements or domains, percentages of QTL controlling some (black) or all (gray) elements or domains within the trait class are shown. (B and C) Gill raker (B) and medianfin spine (C) morphologies are controlled mainly by QTL with highly regional effects. (B, top) Color-coded dorsal–ventral domains of gill rakers. From dorsal to the ventral midline, rakers are present in EPI (dorsal, blue), JOINT (inter-mediate, red), CERATO (ventral, green), and HYPO (ventromedial, purple) domains. Below, examples of three gill raker QTL with regional effects in these dorsal–ventral domains are shown, from top to bottom: chromo-somes 20, 10, and 7 have regional cerato (ventral), joint, and
hypo-specific domains, respectively. Raker totals in each domain are mapped
separately and results are color coded as in the raker schematic. (C, top)
Three dorsal spines (DS1–DS3) and one anal spine are color coded in the
spine schematic. Below are examples of three spine QTL on chromo-somes 3, 2, and 20 having regional effects on DS1, DS3 + AS, and DS2 respectively. In each QTL plot, genetic distance in centimorgans is
on thex-axis and LOD score on they-axis. Dashed lines are signifi
-cance thresholds.
Opercle: The shape of the opercle bone (Figure 2O) also varies between marine and freshwater populations, which
might reflect differences in feeding and/or respiration (Kimmel
et al.2005, 2012). Opercle size in this cross was strongly
sex-ually dimorphic (Table S3) and was also controlled by seven
autosomal QTL controlling opercle length, width, or neck width (Table S4).
Spines and median fins:We mapped QTL on 16
chromo-somes controlling dorsal or anal spine length (Table S4). A
QTL on chromosome 4 affecting the length of the second
dorsal spine was the most significant QTL in our entire data
set, with a LOD of 51. Chromosome 4 also had large effects on the lengths of the other two dorsal spines and the anal
spine (Figure S7). In contrast, QTL on 7 chromosomes (2, 3,
5, 7, 8, 11, and 13) had regional effects with significant
effects restricted to only one of the four spines measured.
Chromosomes 3 and 2 had specific effects on dorsal spines 1
and 2, respectively, while chromosome 20 had regional effects on dorsal spine 3 and the anal spine (Figure 4). QTL controlling the number and area of serrations on the second dorsal spine (Figure 2P) mapped independently of the QTL controlling the length of the second spine, consis-tent with previous studies showing that presence or absence of serrations varies substantially among stickleback popula-tions, even among populations with prominent second dor-sal spines (Gross 1978).
Vertebrae traits:We found vertebrae number to be sexually
dimorphic (Table S3), consistent with previous studies
(Reimchen and Nelson 1987). Vertebrae number and posi-tion of axial landmarks were also under autosomal control, mapping to eight QTL. Although caudal vertebrae number
mapped to one significant QTL, the caudal to abdominal
vertebrae ratio, proposed to be important for larval fitness
(Swain 1992b), had no detected QTL.
Covariance of traits and multivariate analysis of covariance
We analyzed patterns of trait covariance across all trait classes and found that in general, traits within a trait class
tended to covary (Figure S8). As expected, traits that
map-ped strongly to the same chromosome (e.g., gill raker and
dorsal spine reduction, which both map strongly to
chromo-some 4) also tended to covary (Figure S8). The mean
abso-lute correlations were 0.30 and 0.12 for traits within and between trait classes, respectively. We performed principal
components analysis with all traits quantified in this study
and mapped the firstfive principal components (Figure S9,
Figure S10). Thefirst principal component maps strongly to
chromosomes 4 and 21 (Figure S9), and as expected, traits
that map strongly to these two chromosomes (e.g., branchial
bone length, jaw size, and ventral pharyngeal tooth gain)
load heavily onto this component (Figure S10). The second
principal component maps strongly to chromosome 20 (
Fig-ure S9), and traits that map strongly to this chromosome
(e.g., gill raker reduction and supraoccipital crest shape)
load heavily onto this component (Figure S10). Four of
the topfive principal components map significantly to
chro-mosome 4 (Figure S9), suggesting that the patterns of trait
covariance and integration are complex, but frequently in-volve particular stickleback chromosomes.
The genomic regions underlying trait clusters on chro-mosomes 4, 20, and 21 contain 48, 35, and 11 genes, respectively, that have Gene Ontology annotations suggest-ing key roles in early developmental patternsuggest-ing and
signal-ing (see File S1). Changes in such genes may contribute to
the multiple traits and covariances that map to particular stickleback chromosomes.
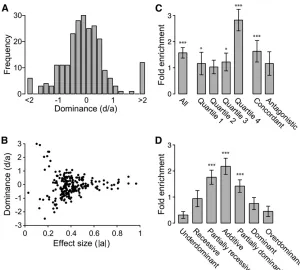
Most QTL are additive or partially additive
We estimated the dominance of each QTL using the formula
d/a(Falconer 1989), where benthic alleles with strictly
re-cessive, additive, and dominant effects have d/a values of
21, 0, and 1, respectively. Across all trait classes, there was
a tendency for QTL to act additively, with the distribution of dominance values centered around 0 (Figure 5A). We
de-fined dominance classes usingd/aranges as in a large
sun-flower domestication QTL study (Burkeet al.2002). Using
these ranges, 28% of QTL are additive, 22% partially reces-sive, 21% partially dominant, 11% recesreces-sive, 5% dominant,
6% underdominant, and 6% overdominant (Table S6,
Fig-ure S11,Figure S12,Figure S13,Figure S14). QTL in differ-ent trait classes had similar patterns of dominance, with a consistent bias toward additive and partially recessive/
dominant QTL (Table S6). We also observed an apparent
relationship between effect size and dominance, with larger-effect QTL having more of an additive larger-effect (Figure 5B,
Figure S15), which simulations show is at least in part driven by a lower precision of dominance estimates of small-effect QTL (data not shown). To investigate possible bias in the detection of QTL differing in dominance, we carried out a simulation to determine the detection proba-bility of additive and dominant QTL. Since more variance is present among the mean phenotypes of genotypic classes of a completely dominant or recessive QTL than an additive QTL, we predicted that additive QTL would be harder to detect than dominant QTL by interval mapping. As expected, the probability of detection was slightly higher for a dominant
QTL than for an additive QTL (Figure S16). Thus, the
detec-tion of more QTL with additive effects does not result from a detection bias.
Although many different types of mutations can lead to loss or gain of structures during development, we tested the hypothesis that regressive or loss QTL (where the freshwater benthic allele contributes to smaller or fewer bones) might more often be recessive, while constructive or gain QTL (where the benthic allele contributes to larger or additional bones) might show more dominance. However, the sets of loss and gain QTL contained similar proportions of domi-nant QTL (5%), and the set of gain QTL actually showed
a higher percentage of recessive QTL (16%vs.7%,Table S6).
For both sets of QTL, most loci were at least partially
additive (69% for gain and 74% for loss, Table S6), and
there was no significant difference (P= 0.46, Mann–Whitney
U-test) between the distributions of dominances of loss and
gain QTL.
QTL can also be classified into sets whose effects are either
concordant or antagonistic to the overall direction of
evolu-tionary change, (i.e., where substitution of a benthic allele
confers a more benthic-like or a more marine-like phenotype, respectively). Most (66%) QTL with a predicted evolutionary direction (based on known phenotypes from the grandparen-tal populations) were in the concordant direction. Although we hypothesized that concordant and antagonistic QTL might show different dominance distributions, we observed no
sig-nificant differences for the QTL identified in this study (P=
0.61, Mann–WhitneyU-test).
Recent whole-genome resequencing studies in
stickle-backs have identified a genome-wide set of regions that are
consistently differentiated between marine and freshwater
fish populations around the world and have likely been
selected repeatedly to produce marine–freshwater
differen-ces (Joneset al.2012b). The 1.5-LOD genetic intervals
con-trolling skeletal traits in this QTL study were significantly
enriched for the genomic regions that show consistent
ma-rine–freshwater sequence differences (P , 0.001, Figure
5C). The biggest enrichment was found for the genetic
inter-vals that had the most significant effects on morphology,
with a 2.8-fold enrichment (P, 0.001) observed for QTL
in the top quartile of the LOD score (quartile 4, Figure 5C).
Interestingly, we also observed significant enrichment for
the set of concordant QTL that act in the same direction
as overall evolutionary change (1.6-fold enriched, P ,
0.001), but no significant enrichment for the set of
antago-nistic QTL (Figure 5C), as expected if marine–freshwater
differentiated regions represent genomic intervals that are repeatedly selected to produce the consistent morphological differences observed in marine and freshwater environ-ments. However, there was a trend toward enrichment for discordant QTL, and the difference in fold enrichment
be-tween concordant and antagonistic QTL was not significant
(P= 0.44, two-tailed Student’st-test).
Some variants controlling freshwater stickleback pheno-types are carried at low frequency in marine populations
(Colosimo et al. 2005; Miller et al. 2007), and the
domi-nance of such variants may affect their carrier frequency in marine populations or the rate at which they increase in fre-quency following colonization of new freshwater environments. We therefore tested whether QTL in different dominance
classes were differentially enriched for the marine–freshwater
genomic regions that show evidence of repeated selection. Neither recessive nor dominant QTL were enriched for
over-lap with the genomic regions identified in the Jones et al.
(2012b) study (Figure 5D). In contrast, partially recessive, additive, and partially dominant QTL were all strongly enriched for overlap with signals of repeated genomic
selec-tion (P,0.001, Figure 5D).
Trait clusters on chromosomes 4, 20, and 21
As detailed above, inspection of QTL results revealed many complex and nonoverlapping patterns of genetic control within and among trait classes (Figure 3). However, certain chromosomes appeared enriched for QTL, especially QTL with high LOD scores, spanning multiple trait classes (Figure
3 andTable S4). To examine possible clustering in greater
Figure 5 QTL dominance patterns and overlap with genomic intervals repeatedly selected during global ma-rine–freshwater stickleback divergence. (A) Histogram of dominance values (d/a) of QTL reveals a tendency toward
additive QTL (d/a= 0). (B) Dominance values for each QTL
plotted against effect size (absolute value ofa). Ten outlier
dominance values that were either.3 or, 23 (File S3)
are not shown. As effect size increases, QTL tend to be more additive. (C) Fold enrichment of QTL 1.5-LOD interval
overlaps with genomic regions showing parallel marine–
freshwater divergence in whole-genome sequence
compar-isons (Joneset al.2012b) for all QTL, quartiles of QTL by
LOD score, and concordant or antagonistic QTL. Highly
sig-nificant enrichment is seen for all QTL, highest-LOD QTL
(quartile 4), and concordant QTL. (D) Fold enrichment of QTL 1.5-LOD interval overlaps with signals of selection (Joneset al.2012b) by dominance class. Highly significant enrichment is seen for partially recessive, additive, and partially dominant QTL, but not for other dominance
classes.*P,0.05,***P,0.001.
detail, we first tested whether detected QTL were more likely to have peak markers within 5 cM of each other,
com-pared to randomly distributed QTL (Protaset al.2008). For
both (1) all QTL and (2) large-effect QTL (defined as being
in the top quartile by LOD), peak markers were significantly
clustered (P = 0.01 andP,0.001 for all QTL and
large-effect QTL, respectively). In the entire set offiltered QTL, as
expected, LOD score and PVE were highly correlated (Pearson’s
correlation coefficient = 0.95).
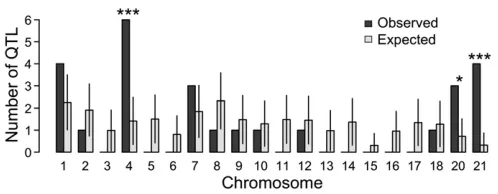
To ask whether specific chromosomes were significantly
enriched for QTL, we used simulations to ask whether (1) all QTL or (2) large-effect QTL were overrepresented on any autosome. Relative to a null prediction where QTL are distributed in the genome in proportion to the genetic
lengths of autosomes, large-effect QTL were significantly
enriched on chromosomes 4, 20, and 21 (Figure 6). In con-trast, only chromosome 21 was statistically enriched when
we analyzed all QTL, not just those of large effect (Table
S7). Since we statistically corrected for the effect of sexual
dimorphism for each trait, we did not include the sex chro-mosome (chrochro-mosome 19) in these calculations.
Given that QTL are more likely to be detected in regions of
low recombination [“the Noor effect” (Noor et al. 2001)],
a low recombination rate on a particular chromosome could contribute to an enrichment of detected QTL on that chromo-some. We therefore asked whether trait clustering was
sig-nificant even when considering physical distance or gene
number of each chromosome in the recently published
stick-leback genome assembly (Joneset al.2012b). The enrichment
of large-effect QTL on chromosomes 4 and 21 remains signif-icant when compared to a null distribution of QTL generated in proportion to either chromosome length or gene number (Table S7), while the enrichment of QTL on chromosome 20
is suggestive, but not significant (P= 0.14 after correcting for
either chromosome length or gene number).
For chromosomes 4 and 21, clustered traits included both loss and gain QTL, with benthic alleles in the same trait cluster contributing to bone loss for some traits and bone gain for others (Figure 7). For example, chromosome 4 had large effects on gill raker and dorsal spine loss, but also on jaw size gain. Chromosome 21 had large effects on tooth and branchial bone gain, but also on dorsal spine loss (Fig-ure 7). In contrast, QTL mapping to chromosome 20 were in the direction where the benthic allele conferred loss or re-duction of bone size across multiple trait classes.
Finally, we asked whether the three trait clusters on chromosomes 4, 20, and 21 are enriched for the genome-wide set of regions that are consistently differentiated between
marine and freshwater stickleback populations (Jones et al.
2012b). These trait clusters on chromosomes 4, 20, and 21
overlapped 70, 26, and 6 marine–freshwater divergent regions
from this set, respectively. Compared to the genome-wide av-erage for an equivalently sized chromosome segment, the
chro-mosome 4 and 20 trait clusters are significantly enriched(P,
0.001 for both), with a 4.5-fold and 3.4-fold enrichment, re-spectively. The chromosome 21 trait cluster, in contrast, has
only a 1.1-fold enrichment for these marine–freshwater
diver-gent regions, which is not significant (P= 0.28). Thus, two of
the three trait clusters are significantly associated with
charac-teristic marine–freshwater divergent genomic regions.
Discussion
Regional control of skeletal anatomy
A main finding of this study is that the genetic control of
evolved skeletal morphology in sticklebacks involves both differential genetic control between trait classes and highly
specific control of individual skeletal elements within a trait
class. It is not surprising tofind differential genetic control
between trait classes, given the likely different embryonic origins of skeletal elements in different trait classes. Perhaps
more surprising is the extent of highly specific anatomical
control among skeletal elements thought to be serially homologous.
Consider, for example, the genetic mapping data for gill raker number. Gill rakers form throughout the pharynx, projecting from dorsal, joint, and ventral regions of bran-chial arches. The reduction in gill raker number in derived
freshwaterfish occurs in each branchial segment (Gross and
Anderson 1984) and is typically described by summing all
anterior-facing rakers on thefirst branchial segment [row 1
(e.g., Hagen and Gilbertson 1972)]. Our mapping data
revealed that in the Paxton benthic population, gill raker reduction was accomplished genetically in a piecemeal
fash-ion by at least 23 QTL with specific effects in particular
dorsal/ventral domains. Both of the large-effect gill raker
QTL had regionally specific effects, the QTL on right
chro-mosome 4 controlling anterior ventral gill raker number and spacing and the chromosome 20 raker QTL controlling
strictly ventral gill raker number (Figure 4 and Figure S2).
This decoupling of the genetic control of dorsal and ventral gill rakers is also consistent with a previous ecological study that found ventral, but not dorsal, gill raker number to have predictive value in discriminating different wild freshwater
populations, perhaps reflecting population-specific diets
(Reimchen et al. 1985). The anatomical specificity of QTL
Figure 6 Large-effect QTL are enriched on chromosomes 4, 20, and 21. Observed (solid bars) and expected (open bars) numbers of large-effect QTL (top quartile by LOD) per chromosome are shown. Data for the expected values represent the mean and standard deviation of values generated from 10,000 simulations. This analysis excluded the sex
chro-mosome (chrochro-mosome 19).*P,0.05,***P,0.001.
might be even more complex; even within the ventral do-main, the chromosome 20 raker QTL had regional effects, controlling only lateral and middle, but not medial spacing (Figure S2).
Another example of highly specific anatomical effects
within a trait class is the genetic control of dorsal spine development. Nine of 14 QTL controlling dorsal spine lengths
were specific to one of the three dorsal spines. Additional QTL
controlled the number and area of barb-like serrations along the surface of the second dorsal spine, and these QTL mapped to different genomic regions than QTL that control length of the second dorsal spine. Previous studies have shown that natural populations of sticklebacks differ in the number of spines, the length of particular spines, and the degree of barb
development along spines, likely reflecting the key roles of
dorsal spine morphology in defense against different types of predators, as well as possible functions in display and dorsal pricking interactions during stickleback courtship (Hoogland
et al.1957; Gross 1978; Reimchen 1980; Kitanoet al.2009).
Across larger phylogenetic distances, many otherfish groups
show striking changes in the length or morphology of
indi-vidual spines, for example, the specific elongation of thefirst
dorsal spine in trigger fish and anglerfish. These dramatic
species-specific modifications also likely depend on precise
anatomical control of spine growth by genetic mechanisms that do not cause comparable changes in all members of a de-velopmentally related series.
The high degree of regional control for skeletal QTL in sticklebacks is consistent with the idea that anatomically
specific changes may avoid negative pleiotropy during
de-velopment and will therefore predominate during morpho-logical evolution in natural populations (Stern 2000; Carroll
2008). Highly specific skeletal effects may be controlled by
genes whose expression patterns are themselves highly
re-stricted along developmental axes (e.g.,Hox andDlxgenes)
or by cis-regulatory changes that alter a particular subset of
the expression domains of more broadly expressed genes. Further molecular dissection of the QTL mapped in this study,
using geneticfine mapping and transgenic methods similar to
those that have been successfully applied to other stickleback
traits (Colosimo et al.2005; Miller et al.2007; Chan et al.
2010), should help illuminate the detailed mechanisms that vertebrates use to shape the size and number of individual skeletal elements as they evolve in different environments.
Most QTL had additive or partially additive effects
A second major conclusion from this study is that the majority of the detected evolutionary QTL had additive or partially additive effects, regardless of skeletal trait class and regardless of the overall direction of their effects on the skeleton (either gain or loss of bone in the derived
freshwater form;Table S6). Our simulations indicated that
detection bias does not explain the enrichment in additive QTL; instead it might contribute to an underdetection of
additive QTL (Figure S16). The strong tendency toward
ad-ditivity across trait classes suggests that this trend may be a general feature of evolved stickleback traits. Previous stud-ies have shown that repressive genetic interactions tend to be as common as activating genetic mechanisms during de-velopment (Davidson and Levine 2008). Since constructive traits could be due to either loss of repressors or gain of activators, and regressive traits could arise by either loss of activators or gain of repressors, it is perhaps not surpris-ing that a range of skeletal traits, includsurpris-ing both increases and decreases of bony tissue, tend to show similar genetic architectures.
Figure 7Trait clusters on chro-mosomes 4, 20, and 21. For each chromosome, the genetic length of the chromosome is shown as the black line at the top of each panel. (Bar, 5 cM.) Each blue, red, or gray bar represents a QTL, with the length of the bar denoting the 1.5-LOD interval. Trait abbre-viations (Table S2) are listed to the right of each bar. The height of each bar is proportional to the LOD score of the QTL. For each QTL, direction of effect is indi-cated by red (benthic allele con-fers more or bigger bones) or blue (benthic allele confers fewer or smaller bones). The position of
Ectodysplasinon chromosome 4 is marked with an arrowhead. A 1.7-Mb inversion on chromosome 21 (arrow), with different orientations typical in
marine and freshwaterfish (Joneset al.2012b), mapped within the 1.5-LOD interval of all seven QTL on this chromosome, although the peak markers
for each QTL (Table S4) mapped left of the inversion. See Figure 3,Figure S3,Figure S4,Figure S5,Figure S6,Figure S7, andFile S3for more details on
traits controlled by these three chromosomes. Abbreviations (see Figure 2 andTable S2): C, total cerato (ventral) gill raker number; CB4L,
ceratobran-chial 4 length; DS2L, dorsal spine 2 length; DS3L, dorsal spine 3 length; DTP2, dorsal toothplate 2 tooth number; E, epi (dorsal) gill raker number; EB1L, epibranchial 1 length; FW, frontal width; H, total hypo gill raker number; IL2, in-lever 2 of the articular; LAP, vertebrae number of last anal pterygio-phore; LSP, lateral row 2 raker spacing; PMH, premaxilla height; R8C, row 8 cerato (ventral) gill raker number; SOL, supraoccipital crest length; SOA, supraoccipital crest area; SRA, spine 2 serration area; TAP, total postanal pterygiophore number; VTP, ventral toothplate tooth number.
Two main models have been proposed for the effect of
the dominance of a mutation on its likelihood of fixation
during adaptation. “Haldane’s sieve” predicts that new
advantageous mutations are more likely to increase in fre-quency if they are not recessive (Haldane 1927). In contrast, Orr and Betancourt (2001) showed that if standing variants
preexist in populations at mutation–selection balance and
are disadvantageous prior to, but favored after, an
environ-mental change, then probability offixation in the new
selec-tive regime is largely independent of dominance. In the
stickleback system, detailed case histories of the specific
variants underlying armor and pigment traits (Colosimo
et al. 2005; Miller et al.2007) and more recent
genome-wide surveys of parallel evolving freshwater populations
(Hohenlohe et al. 2010; Joneset al.2012b) show that
re-peated selection of ancient standing variants plays a
substan-tial, but not exclusive (Chan et al.2010), role in repeated
marine–freshwater divergence. The overall distribution of
dominance we observe for skeletal QTL in sticklebacks is
thus likely based on a mixture of de novo mutations that
have arisen during the divergence of the particular popula-tions studied and older standing variants that likely exist at
selection–migration balance in ocean populations, which
be-come favorable when introduced into new freshwater envi-ronments. We observe a strong tendency toward additivity for QTL, which cannot be simply explained by either
Hal-dane’s sieve or the Orr/Betancourt model. However, the
Haldane and Orr/Betancourt predictions are for fitness,
and it is possible that the dominance for the skeletal traits
studied here does not reflect the dominances forfitness, as
previously seen in the dominances ofEdaand chromosome
4 genotype on lateral plate morphology andfitness (Barrett
et al.2008).
Similar trends toward additivity of QTL have been
observed in genetic studies of traits under artificial selection
in mice and outbreeding plants (deVicente and Tanksley
1993; Burkeet al.2002; Kenney-Huntet al.2008; Ronfort
and Glemin 2013), as well as in naturally evolved
differ-ences between surface and cave-adapted fish (Protaset al.
2008). This trend toward additivity for evolutionary QTL could result at least in part from a bias in the dominance distribution of the types of mutations favored by selection.
For example, segregating cis-regulatory alleles have been
found to be additive more often thantrans-regulatory alleles
(Lemos et al. 2008; McManus et al. 2010; Gruber et al.
2012). If selection favorscis-regulatory mutations, then
ad-ditive QTL are expected to be common. Furthermore, the Orr/Betancourt model assumes that standing variation is
at mutation–selection balance, whereas much of the
stand-ing variation reused by stickleback populations may be at
migration–selection balance (Barrett and Schluter 2008),
maintained in the ancestral marine population by introgres-sion from freshwater populations. Such variation has
al-ready beenfiltered by selection: to be present in the sea it
likely had increased in frequency already in freshwater pop-ulations. As a result, standing variation should be biased
toward the kinds of mutations that selection favors in
fresh-water, which we hypothesize to becis-regulatory mutations
due to their low pleiotropy and a tendency to be additive. Although we observed a strong tendency toward addi-tivity of QTL, the 12% of overdominant and underdominant QTL observed likely indicates that some of the genetic effects observed in this cross result from complex interac-tions between the divergent grandparental genomes used for the cross, some of which may not be typical for very recent divergence between more closely related
popula-tions. Furthermore, although the extant Japanese Pacific
marine population was used in this study as a living proxy
for the marine ancestor of Pacific basin-derived freshwater
fish including Paxton benthics, modern day marine fish
cannot be equated with the ancestor of Paxton Lake fish.
Given that genetic effects including dominance of QTL are
likely context (e.g., genetic background and environment)
dependent, additional crosses will be needed to test general patterns of evolved genetic effects in this system.
Overall, the QTL identified in this study show significant
enrichment for overlap with the previously identified
haplotypes that are consistently differentiated between
marine and freshwater fish populations around the world
(Joneset al.2012b). This enrichment suggests that a subset
of the genomic regions repeatedly used for freshwater ad-aptation is selected for their effects on skeletal morphology. Large-effect QTL and additive QTL display the strongest en-richment, while small-effect, recessive, or dominant QTL show no or less enrichment for overlap with these haplo-types. These enrichment differences could at least partly result from a higher proportion of false positives in the set of small-effect QTL, which are more likely to be recessive or dominant. In addition, small-effect, recessive, and dominant classes might be enriched for new mutations (rather than standing genetic variation), which have a lower probability
of detection by the method used in the Joneset al.(2012b)
study. Further analysis of the QTL intervals identified in this
study will test the hypothesis that the enrichment of these signals of selection in the QTL intervals is driven by
partic-ular genomic regions that act to control specific skeletal
traits mapped in this study. Future population genetic stud-ies in marine and Paxton benthic populations can also test
whether haplotypes inside the QTL intervals identified here
are outliers for metrics such asFst.
Clustering of QTL on chromosomes 4, 20, and 21
A third major finding of this study is that multiple trophic
and armor traits map strongly to chromosomes 4, 20, and 21. We found that QTL from six (chromosome 20) or seven (chromosomes 4 and 21) of the eight trait classes mapped to each trait cluster (Figure 3). Although all QTL were enriched only on chromosome 21, large-effect (top quartile of QTL by LOD) QTL were enriched on chromosomes 4, 20,
and 21 (Figure 6). All three trait clusters controlled specific
subsets of skeletal traits and are thus unlikely to represent loci generally involved in bone formation. For example,
some skeletal traits, such as opercle size, mapped strongly to
multiple genomic locations but were not significantly
con-trolled by any of the three large-effect trait clusters. The trait clusters could result from single genes with pleiotropic effects or from the combined effects of multiple
linked genes. Several QTL studies have identified loci that
are thought to have pleiotropic consequences (Kimuraet al.
2007; Albertet al.2008; Studer and Doebley 2011),
includ-ing a large-scale study of QTL controllinclud-ing skeletal
differen-ces between mice artificially selected for large or small body
size (Kenney-Huntet al.2008). In contrast, genetic studies
in butterflies, pinthrum, and Petunia have reported some
trait clusters that are due to closely linked but separable loci, rather than to pleiotropic effects of a single gene (Kurian
and Richards 1997; Joronet al.2006; Fergusonet al.2010;
Hermannet al.2013). As the degree of pleiotropy of a QTL
increases, the relative frequency of antagonistic effects (ef-fect in the opposite direction of the direction of evolutionary change) is predicted to increase during selection (Griswold and Whitlock 2003), which perhaps at least partially
explains our observation that a significant fraction (34%)
of QTL are antagonistic. However, antagonistic effects could also result from stabilizing selection, from genetic
drift (Rieseberget al.2002; Griswold and Whitlock 2003),
or from pleiotropic mutations that overshoot the optimum phenotype.
For two of the stickleback trait clusters presented here, genetic resolution of linked traits argues against pleiotropy. For example, two of the linked raker QTL on chromosome 4, as well as two linked raker and supraoccipital crest QTL on chromosome 20, appear spatially distinct from each other, with nonoverlapping 1.5-LOD intervals (Figure 7). In addi-tion, for the trait clusters on chromosomes 4 and 21, benthic alleles do not act in a consistent phenotypic direction (Fig-ure 7). For example, chromosome 4 benthic alleles reduce gill raker number, pharyngeal tooth number, and dorsal and anal spine lengths, but also increase upper and lower jaw sizes, branchial bone sizes, and the length of the supraocci-pital crest. Given the opposite directions of phenotypic effects and the genetic resolution separating some of the linked QTL, we favor a model where several individual, linked QTL exist, possibly including a supergene complex with multiple effects on both armor and trophic phenotypes. Increased genetic resolution of these overlapping QTL is needed to test whether the QTL are separable and whether some of the overlapping traits might resolve to a supergene complex. In cases where loss and gain QTL overlap, it is
possible these traits share developmental interactions (e.g.,
the genetically encoded loss of a trait might result indirectly in the gain of another).
In cases of multiple linked QTL, trait clustering may be due to genomic intervals of decreased recombination. For
example, inversions suppress recombination and inMimulus
andHeliconiusappear to lock in a suite of coadaptive
poly-morphisms (Lowry and Willis 2010; Joronet al.2011; Fishman
et al.2013). Recent stickleback genome sequencing revealed
a 1.7-Mb inversion on chromosome 21 that displays strong signals of selection, whereby marine and freshwater popu-lations have high and low allele frequencies, respectively, of
the inversion (Joneset al.2012b). Joneset al.(2012b)
pro-posed that this inversion may hold several distinct adaptive loci together, and both the current study of skeletal QTL and
another recent study of lateral line QTL (Warket al.2012)
confirm that many QTL map to chromosome 21, with
con-fidence intervals that overlap the position of the inversion.
Although this study identifies a large number of new traits
that may be controlled by an inversion/supergene complex in sticklebacks, we note that the peak markers for each of the chromosome 21 QTL map left of the inversion. Ongoing
fine-mapping studies using crosses that generate
recombina-tion events in and around the inversion will provide useful information on both the position and the identity of the genes and mutations that underlie one of the most distinc-tive trait clusters in the stickleback genome.
Previous studies have identified multiple QTL mapping to
chromosome 4 in sticklebacks, including QTL for lateral
plate number and lateral plate size (Colosimo et al.2004;
Creskoet al.2004), pelvic spine length (Shapiroet al.2004),
and multiple aspects of body shape (Albert et al. 2008;
Rogers et al. 2012). The data presented here reveal that
a surprisingly large number of additional traits also map to chromosome 4, including gill raker number, pharyngeal tooth number, branchial bone size, premaxilla size, dentary and articular size, supraoccipital crest length, dorsal and anal spine length, and aspects of vertebral positioning. Many of these traits, including larger jaws and fewer gill rakers, shorter dorsal and pelvic spine lengths, reductions in lateral plate number, and changes in overall body shape, appear to
have adaptive significance in benthic environments, as
mul-tiple benthic species independently evolve these morpholog-ical changes in recurrent stickleback species pairs (Schluter and McPhail 1992). Linkage of large-effect QTL controlling multiple aspects of both trophic morphology and antipreda-tor defense may preserve combinations of traits that func-tion together in different ecological environments. For
example, fish foraging in open water environments not
only specialize on different food sources, but also tend to encounter different predators. Thus, tight linkage of genes
controlling feeding and armor traits may provide a fitness
advantage to offspring of contrasting ecotypes, and theory predicts that such linked assemblages will evolve under con-ditions where strongly contrasting forms sometimes meet and hybridize (Kirkpatrick and Barton 2006), as frequently
occurs in marine–stream and benthic–limnetic stickleback
species pairs.
Parallel evolution of polygenic traits
Large-effect QTL for armor plate, pigment, and pelvic development that were previously mapped in this cross do
not appear to be specific to this cross. Instead the same
major loci (Colosimoet al.2004; Creskoet al.2004; Shapiro
et al. 2004; Coyleet al.2007), the same underlying genes