Abstract
Hollar, Edward Eugene. Improving The Dye House Through The Removal Of Unwanted Bottlenecks By Modernization And Energy Conservation. (Under the direction of Dr. James W. Leach)
The purpose of this research has been to find ways to improve a package dye house through modernization and energy conservation. The research involved six months of floor studies done at the dye house, two assessments done by the Industrial
Assessment Center, and research into ways to save energy and increase productivity. The dye house does not have any energy conservation systems in place, and there is a lot of opportunity to save energy if one was in place. This thesis details an energy conservation program that will help conserve energy with very little cost. The total energy savings recommended for this program is 18,579 MMBtu per year. The total cost savings is $81,258 per year. In addition to the energy conservation program, this thesis
recommends a major modernization project. The dye house produces 200,000 lb a week, but its limiting factor is not the dye machines. The dryers at this facility control
production levels. These dryers are very old and inefficient. The dye house should install two super dryers to replace all existing dryers. The project will take less than 3 years to implement and presents a simple pay back of 3 months. The energy savings are 84,856 MMBtu per year. This is a cost savings of $481,711 per year. In addition to the energy savings, the super dryer will save an estimated $3,141,759 per year in productivity savings. The total cost savings for this project is $3,623,470 per year. The
Improving The Dye House Through The Removal
Of Unwanted Bottlenecks By Modernization And
Energy Conservation
By
Edward Eugene Hollar
A thesis submitted to the Graduate Faculty of North Carolina State University
In partial fulfillment of the Requirements for the Degree of
Master of Science
MECHANICAL ENGINEERING
Raleigh
October 18, 2002
Approved By:
___________________________________ ___________________________________ Dr. Herbert M. Eckerlin, Dr. James W. Leach Co-Chair of Advisory Committee Co-Chair of Advisory Committee
ii
Dedication
Biography
Edward Hollar was born in Hickory, NC in January of 1977. He lived in the Hickory area until he left for college in 1995. He attended Newton-Conover High School where he played football and ran track. He graduated High School in June of 1995 and started College at North Carolina State University the following August. Edward Studied Textile Engineering as an undergrad. He completed his course work in May of 1999. The next month he started working for Mastercraft Fabrics. He spent eight months as a
iv
Acknowledgment
Table of Contents
List of Tables
………...viiiList of Figures
………..……….……….xiChapter 1: Plant Background
………..……1Dye House Raw Material
………..…11. Yarn
……….12. Dyes and Chemicals
..……….3Dye House Machines
………...41. Dye Machines
………...62. Dryers
………..8Facility Description
………..………..10Labor
………...12vi
Chapter 2: Plant Problems
……….22Energy Conservation
……….231. Leaks
……….232.
Motors
………...243.
Steam Traps
……… 264. Insulation
……….275.
Boilers
………...286.
Summary For Energy Conservation
……….31Dye House Bottleneck
………321.
Drying Capacity
……….322.
Summary of Problems With The Current Dryers
………36Chapter 3: Energy Program
………..37Energy Conservation
………..371.
Repairing All Leaks
………..38a. Steam Leaks………..39
b. Water Leaks………..42
c. Air Leaks………44
2.
Monitoring The Steam System
………..………47a. Steam Traps………...47
b. Insulation………...51
i. Insulating All Steam Pipes And Condensate Return Lines………...51
ii. Insulating The Dye and Dry Kiers………56
c. Repairing and Monitoring Condensate Return………62
d. Boiler Maintenance……….…….65
3.
Motor Program
………..74a. Motor Program For Rewind………..……..74
b. Motor Alignment………..83
4.
Overhauling Machinery On A Regular Bases
………..86Chapter 4: Installing Super Dryers
……….…92Installing Two Super Dryers
………....92Super Dryer Background
………..…..93Drying Capability of The Super Dryer
………...…95Anticipated Savings
……….……971.
Electrical Savings
………..972.
Steam Savings
………..1003.
Labor and Overtime Savings
………...…1024.
Moisture Regain Savings
………..1065.
Repair Cost Savings
………1076.
Heat Recovery Savings
………...………...108a. Water Savings………..111
7.
Production Savings
……….1138. Summary of Savings
………...118Implementation
……...……….1191.
Cost of Super Dryer
………1192.
Installation Cost of Super Dryer
……….1213.
Downtime Cost
……….1224.
Engineering Cost
……….1255.
Unforeseen Cost
………..1256.
Total Implementation Cost and Pay Back Period
………….126Chapter 5: Conclusion
………..………..129viii
List of Tables
Table 1: Yarn Production Breakdown For Fiber Type………...1
Table 2: Dye House Carriers………...2
Table 3: Dye Machine Motors……….…...6
Table 4: Volumes and Average Pounds For Each Kier………..7
Table 5: Motor Size and Capability of Each Dryer………9
Table 6: Labor For the Dye House……….………..12
Table 7: Electrical Energy Use and Cost………..13
Table 8: Natural Gas / Oil Usage and Cost………...15
Table 9: Water Consumption and Cost……….19
Table 10: Total Utilities For the Dye House……….21
Table 11: Flue Gas Analysis……….29
Table 12: Nominal Distribution of Carriers Dyed in Dye Machines Per Day………….….33
Table 13: Existing Dryers’ Capability of Carrier Type………33
Table 14: Type of Yarn Per Dryer………34
Table 15: Number of Carriers Per Dryer Per Day………35
Table 16: Drying Capability of the Two Super Dryers……….35
Table 17: Water Savings………...42
Table 18: Summary of Savings Based On Leak Size………...46
Table 19: Results of Steam Trap Survey……….48
Table 20: Savings For Insulating All Heated Pipes……….54
Table 22: Energy and Cost Savings For Insulating Kiers……….60
Table 23: Implementation Cost and Simple Payback For Insulating The Kiers…………...61
Table 24: Boiler #1 Analysis………65
Table 25: Ideal Operating Conditions………...67
Table 26: Optimal Percentage For Boilers………72
Table 27: Cost and Efficiency of Electric Motors………73
Table 28: Energy and Cost Savings For Replacing Motors………..80
Table 29: Motor Costs, Savings, and Payback Period………..82
Table 30: Motor Savings For Alignment………..84
Table 31:Summary of Energy Conservation Programs………...90
Table 32: Drying Capability of the Two Super Dryers………95
Table 33: Cycle Time Per Yarn Type………..95
Table 34: Existing Dryer Electrical Savings………98
Table 35: Super Dryers Electrical Cost………98
Table 36: Steam Cost For Two Super Dryers……….100
Table 37: Optimal Amount of Carriers………...102
Table 38: Normal Carriers Load Times………..103
Table 39: Proposed Carrier Load Times……….104
Table 40: Maintenance Work Hours and Labor Cost……….105
Table 41: Repair Cost of Exiting Dryers………107
Table 42: Water Usage Breakdown For The Dye House………...110
Table 43: Estimated Production Totals For 2002………..114
x
Table 45: Production Capability with Two Super Dryers………..116
Table 46: Summary of Projected Annual Savings………..118
Table 47: Breakdown of Costs For Super Dryers………...119
Table 48: Electrical Requirements of Deactivated Dryers……….123
Table 49: Cost of Drying Two Extra Days A Week………...124
Table 50: Implementation Cost………...126
List of Figures
Figure 1: Shapes of Dye Packages………..2
Figure 2: Dye House Machine Layout………5
Figure 3: Dye House Floor Layout………...11
Figure 4: Electrical Cost Per Month……….14
Figure 5: Electrical Usage Per Month………..14
Figure 6: Demand Per Month………...15
Figure 7: Gas and Fuel Cost Per Month………17
Figure 8: Total Energy Cost Per Month………18
Figure 9: Water Usage………..20
Figure 10: Water and Sewer Cost……….20
Figure 11: Total Utilities per Month………21
Figure 12: Steam Leaks In Basement………...39
Figure 13: Flue Gas Monitoring Graph………71
Figure 14: Energy Savings vs. Runtime………...78
Figure 15: Cost Savings vs. Runtime………78
Figure 16: Payback Period vs. Runtime………79
Figure 17: Overhaul Review Sheet………...88
1
Chapter 1 Plant Background
Dye House Raw Materials
Yarn
The dye house is budgeted to dye over 10 million lbs of yarn a year. The weekly budget is 205,000 lbs a week. All yarn that is dyed is sent to weaving plants across the
Southeast. The yarn type is a mixture of Cotton, Rayon, Acrylic, and Polyester. In Table 1, the production for the year to date is shown.
Tables 1. Yarn Production Breakdown For Fiber Type
Fiber Type Total Lbs Lbs per Week % of Total Lbs.
Acrylic 1,130,011 33,267 18
Cotton 2,791,903 82,115 46
Polyester 1,140,982 33,558 19
Rayon 1,055,109 31,033 17
Total 6,118,005 179,973 100
Figure 1. Shapes of Dye Packages
dyeing. All polyester yarn is pressed onto carriers to get more packages on a given carrier. Polyester yarn packages hold their shape and have no quality problems when they are pressed. Most of the yarn comes in on dye tubes that are ready to dye, however, some yarn producers only send their products on cardboard cones. These cones are wound on a dye tube in the winding department and sent to the dye house upon
completion. The dye house uses yarn producers from the United States, Mexico, Canada, South America, and Asia to supply them with the raw yarns they need.
Once the raw yarn arrives at the dye house, it is loaded onto carriers. These carriers range in size. Table 2 shows the different sizes and weights of each carrier.
Table 2: Dye House Carriers
Type of
Carrier No. of Tubes per Carrier Lbs per Carrier Amount of Carriers
1,000 lb 320 1000-1200 15
800 lb 237 700-900 15
300 lb 80 200-350 50
100 lb 32 75-150 7
Table Top 24 30-60 12
Total 99
Normal Square package with corners Pressed Package
3
Dyes and Chemicals
The dye house uses a variety of dyes and chemicals in their process. 60% of the dyes used are direct dyes. These dyes are easy to work with and pretty consistent. Brine, which is a NaCl water mixture, is used to help direct dyes diffuse more completely. Reactive dyes are also used for polyester and other fibers. These dyes take longer to dye due to the high temperatures they require, but the dye is a higher quality dye. Most fiber reactive dyes are permanently fixed onto the fibers. The dye house uses several vendors to supply them with dyes. New dyes and formulas are constantly being tried in the dye house lab.
The main chemical used during the dyeing process is cleaning and fixing
Dye House Machines
The dye house has twelve main dye machines, four table top dye machines, nine dryers, one extractor, two hoist, one polyester press, one pallet truck, and a main
5
Figure 2: Dye House Machine Layout
Loading Area Dye Machine
#12 #11 #10 #9 #8 #7 #6 #5 #4 #3 #2 #1 Table Tops Enclosed Port Dryers
Dye Machines
Each dye machines includes: a dye kier, an expansion tank, a direct drive dc motor, a centrifugal pump, a heat exchanger, a steam trap with condensate return line, a fill line, a drain line, and miscellaneous items. The motor sizes for the twelve main dye machine can be seen in Table 3.
Table 3: Dye Machine Motors
Dye Machine Motor Size (hp)
Dye Machine 1 125
Dye Machine 2 30
Dye Machine 3 125
Dye Machine 4 75
Dye Machine 5 30
Dye Machine 6 30
Dye Machine 7 75
Dye Machine 8 75
Dye Machine 9 125
Dye Machine 10 30
Dye Machine 11 30
Dye Machine 12 30
7
Table 4: Volumes and Average Pounds For Each Kier
Dye Machine Kier Volume (ft3) Average Pounds (lbs)
Dye Machine 1 142.5 1,200
Dye Machine 2 37.8 250
Dye Machine 3 142.5 1,200
Dye Machine 4 88.3 800
Dye Machine 5 37.8 250
Dye Machine 6 37.8 250
Dye Machine 7 88.3 800
Dye Machine 8 88.3 800
Dye Machine 9 142.5 1,200
Dye Machine 10 37.8 250
Dye Machine 11 16.8 100
Dye Machine 12 16.8 100
The heat exchangers use steam from the boilers to ramp the temperature of the dye bath from a starting temperature to over 200°F. Dye usually does not start diffusing until the dye bath reaches 140°F. At 200°F, most of the dye is diffused. To cool the dye bath, cold water is sent through the tubes of the heat exchanger to lower the temperature. A steam system using one steam trap and condensate return lines recapture the
Dryers
The dryers are broken down into four categories. There are five port dryers, two enclosed port dryers, one Perv Dryer, and one Avesta Dryer. There is also an extractor that is used in conjunction with the port dryers. The five port dryers and two enclosed dryers use a steam heated heater box and a blower to blow hot air through a carrier of yarn. There are a total of 20 ports on the five port dryer. Carriers filled with yarn are placed on one of these ports, and hot air is blown up through them. Before a carrier can be placed on a port dryer, it must be extracted. The extractor has a 100 hp vacuum motor that pulls excess water off the packages of yarn. The extraction process takes about 15 minutes to an hour depending on the size of the carrier and the fiber type. Once the carrier has been extracted, it is placed on port dryer for drying. All drying is done from inside to outside. There is no heat recovery, monitor system, or set amount of air associated with these dryers. All exhaust escapes from the top of the carriers. Dryer operators and supervisors determine when a carrier is dry by touch of hand. The number of ports being used determines the amount of air distributed to each carrier. The process is very energy intensive and has a very poor efficiency.
9
The Perv dryer is a pressurized dryer. It uses a heater box to heat dry the yarn, but the dryer goes under pressure. The pressure allows the temperature to increase without having to add more energy. The Perv has a shorter dry cycle than the ports and enclosed ports, but it is still very inefficient. The Perv is setup with a timer much like that of the enclosed ports. The dryer dries at one temperature until the cycle is complete. So the yarn may still be wet, or the yarn may be over dried. Again the dryer operator determines whether or not the carrier is finished.
The Avesta is the most current dryer in the dye house and it is a 1976 model. The Avesta is a two kier tube and shell dryer. It has a controller that measures temperatures in the kier. A set time based on weight and yarn type controls the drying cycle. The Avesta is the most efficient dryer in the dye house. A 250 hp blower produces the fastest dry cycle in the dye house. However, the Avesta cannot control moisture content. So many of the carriers are still wet or over dried. Table 5 shows the motor size of each dryer and the maximum pounds per cycle it can dry.
Table 5: Motor Size and Capability of Each Dryer
Dryer Motor Size (hp) Pounds Per Cycle (lbs)
Port Dryer 1 100 3,000
Port Dryer 2 100 2,000
Port Dryer 3 75 1,200
Port Dryer 4 100 1,500
Port Dryer 5 100 1,400
Enclosed Dryer 22 150 600
Enclosed Dryer 23 150 1,000
Perv Dryer 20 150 1,000
Avesta Dryer 21 250 2,000
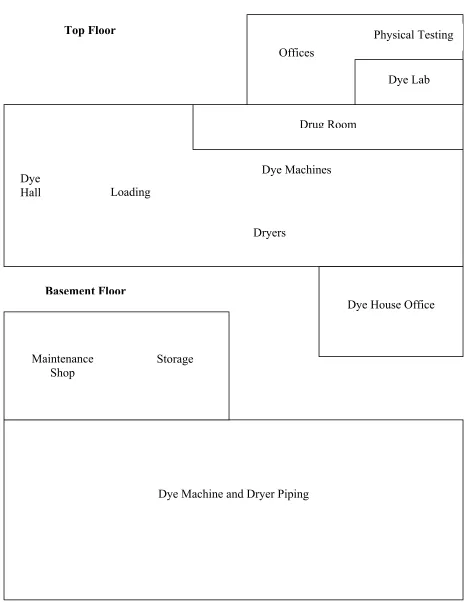
Facility Description
11
Drug Room
Dye Machines
Dryers
Dye House Office Offices
Physical Testing
Dye Lab
Dye
Hall Loading
Dye Machine and Dryer Piping Maintenance
Shop
Storage
Basement Floor
Labor
The dye house labor force is made up of 49 associates. On each shift there is a dye hall loader, a dryer operator, four carrier loaders, four dye operators, a computer operator, a lab operator, and a supervisor. During the day, there are two maintenance men, two physical testing technicians, an order, a shade matcher, a lead lab technician, a dye house secretary, a department head, and a superintendent. The run schedule for this facility is 24 hours a day five days a week. Any overtime is worked on Saturday and Sunday. The schedule varies from week to week based on orders. Table 6 shows the breakdown of labor in the plant.
Table 6: Labor For The Dye House
Position Positions per Shift Total
Dye Hall Loader 1 3
Carrier Loader 4 12
Dryer Operator 1 3
Dye Operator 4 12
Computer Operator 1 3
Lab Operator 1 3
Scheduler 0 1
Order 0 1
Maintenance Staff 0 2
Secretary 0 1
Lab Technician 0 1
Physical Testing Lab 0 2
Management 1 5
13
Utilities
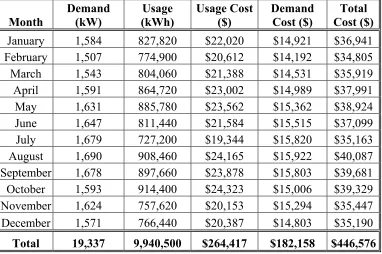
The dye house uses water, steam, electricity, and compressed air to dye yarn. The dye house uses natural gas and #6 fuel oil in its boilers to make steam. City water is used to dye the yarn, electricity is used by electric motors to drive pumps, and compressed air is used to open and close valves. The compressed air for the dye house is supplied by the same compressors that supply the weave room with air. Table 7 shows the electrical cost for the dye house.
Table 7: Electrical Energy Use and Cost
Month
Demand (kW)
Usage (kWh)
Usage Cost ($)
Demand Cost ($)
Total Cost ($)
January 1,584 827,820 $22,020 $14,921 $36,941 February 1,507 774,900 $20,612 $14,192 $34,805
March 1,543 804,060 $21,388 $14,531 $35,919 April 1,591 864,720 $23,002 $14,989 $37,991
May 1,631 885,780 $23,562 $15,362 $38,924 June 1,647 811,440 $21,584 $15,515 $37,099 July 1,679 727,200 $19,344 $15,820 $35,163 August 1,690 908,460 $24,165 $15,922 $40,087 September 1,678 897,660 $23,878 $15,803 $39,681
October 1,593 914,400 $24,323 $15,006 $39,329 November 1,624 757,620 $20,153 $15,294 $35,447 December 1,571 766,440 $20,387 $14,803 $35,190
0 100,000 200,000 300,000 400,000 500,000 600,000 700,000 800,000 900,000 1,000,000
January February M
arch April May June Jul
y
Augus t
Sept
ember October Nov
ember Dec
ember
Month
Kilowatts Used (kWh)
Figure 4 shows the graph of energy cost for the dye house. The graph is broken into demand and usage.
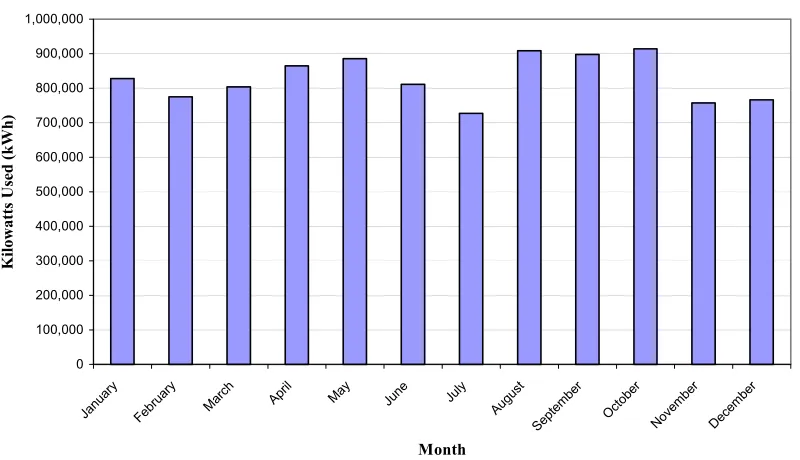
Figure 5 shows the electrical usage for each month.
Figure 5: Electrical Usage Per Month
$0 $5,000 $10,000 $15,000 $20,000 $25,000 $30,000 $35,000 $40,000 $45,000 Janu ary Febr
uary March April May June July
Augus t Sept emb er Octob er Nove mber Decem ber M onth Cost ($)
D em and C os t U sage C os t
15
Figure 6 shows the demand per month for the dye house.
Figure 6: Demand Per Month
The electrical rates for the dye house are:
Electrical Usage = $0.0266 / kWh Power Demand = $9.42 / kW
0 200 400 600 800 1,000 1,200 1,400 1,600
January February March April May June July August September October November December
Month
Natural gas is on an interruptible rate and is subsidized with fuel oil #6. Table 8 shows the natural gas usage and cost required by the dye house.
Table 8: Natural Gas / Oil Usage and Cost
Month
Gas Energy (MMBtu)
Gas Cost ($)
Oil Energy (MMBtu)
Oil Cost ($)
Overall Fuel Cost / MMBtu
January* 628.80 $9,469.72 15,024.60 $76,124.64 $15.06 February 10,102.90 $48,709.12 0 $0.00 $4.82
March 12,505.60 $56,615.24 0 $0.00 $4.53 April 10,324.00 $46,588.19 0 $0.00 $4.51 May* 2,213.4 $16,884.62 9,983.4 $44,925.30 $7.63
June 8,028.40 $35,128.68 0 $0.00 $4.38 July 6,456.40 $26,082.07 0 $0.00 $4.04 August 8,551.00 $33,096.09 0 $0.00 $3.87 September 9,057.80 $34,396.36 0 $0.00 $3.80
October 12,162.80 $26,554.45 0 $0.00 $2.18 November 10,226.70 $39,402.23 0 $0.00 $3.85 December 12,802.40 $45,222.07 0 $0.00 $3.53
Total 103,060.2 $408,679.12 25,008 $121,049.94 $4.21
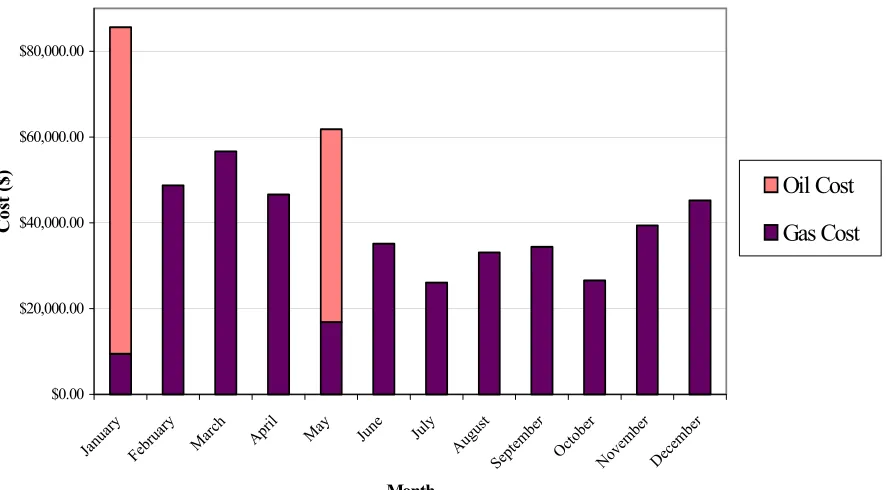
17 Figure 7 shows the cost of steam for the dye house.
Figure 7: Fuel Cost Per Month
$0.00 $20,000.00 $40,000.00 $60,000.00 $80,000.00
Januar y
Februar
y Mar
ch Apri
l
May June July
Augu st
Septem
ber
Octo
ber
Novembe
r
Dec emb
er
Month
Cost
(
$) Oil Cost
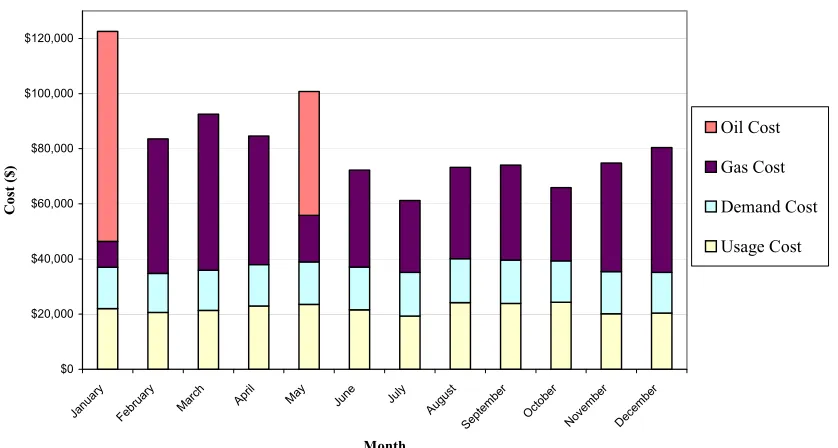
Figure 8 gives the monthly energy cost for electricity, fuel oil, and gas. The overall height of the bars represents the total cost of energy for the month.
Figure 8: Total Energy Cost Per Month
$0 $20,000 $40,000 $60,000 $80,000 $100,000 $120,000
Januar y
Febr
uary March April May June July August
Sept
ember October
November Decembe r
Month
Cos
t (
$)
Oil Cost
Gas Cost
Demand Cost
19
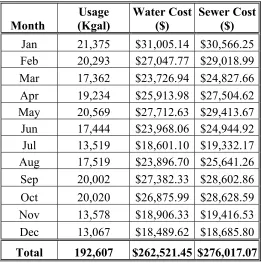
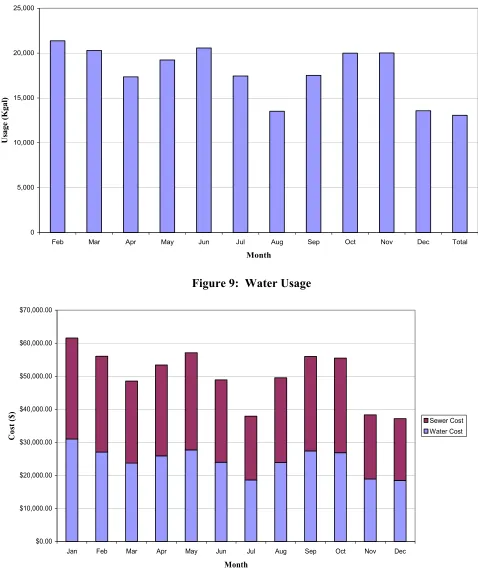
The dye house water and sewer is controlled by the city. The dye house is charge $1.3661 per 1,000 gallons for water and $1.4331 per 1,000 gallons for sewer. Table 9 shows the amount of water and the cost per month.
Table 9: Water Consumption and Cost
Month
Usage (Kgal)
Water Cost ($)
Sewer Cost ($)
Jan 21,375 $31,005.14 $30,566.25 Feb 20,293 $27,047.77 $29,018.99 Mar 17,362 $23,726.94 $24,827.66 Apr 19,234 $25,913.98 $27,504.62 May 20,569 $27,712.63 $29,413.67
Jun 17,444 $23,968.06 $24,944.92 Jul 13,519 $18,601.10 $19,332.17 Aug 17,519 $23,896.70 $25,641.26
Sep 20,002 $27,382.33 $28,602.86 Oct 20,020 $26,875.99 $28,628.59 Nov 13,578 $18,906.33 $19,416.53 Dec 13,067 $18,489.62 $18,685.80
Total 192,607 $262,521.45 $276,017.07
0 5,000 10,000 15,000 20,000 25,000
Feb Mar Apr May Jun Jul Aug Sep Oct Nov Dec Total
Month
Us
ag
e (
K
ga
l)
$0.00 $10,000.00 $20,000.00 $30,000.00 $40,000.00 $50,000.00 $60,000.00 $70,000.00
Jan Feb Mar Apr May Jun Jul Aug Sep Oct Nov Dec
Month
Cos
t (
$) Sewer Cost
Water Cost
Figure 9: Water Usage
21
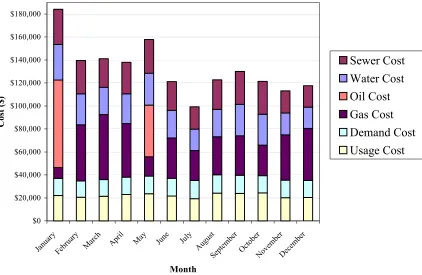
The total utility cost for the dye house is shown in Table 10.
Table 10: Total Utilities For The Dye House
Utility Cost
Electrical $461,477.70
Natural Gas $418,148.86
Oil $121,049.94
Water / Sewer $276,017.07
Total $1,276,693.57
The total utility cost for the last year was $1,276,693.57. Figure 11 shows the cost per month and the cost breakdown for each utility.
$0 $20,000 $40,000 $60,000 $80,000 $100,000 $120,000 $140,000 $160,000 $180,000 Januar y Febr uary Marc h
April May June July
Aug ust Septe mbe r Octo ber Nov ember December Month Cost ($) Sewer Cost Water Cost Oil Cost Gas Cost Demand Cost Usage Cost
Chapter 2 Plant Problems
Introduction
The dye house has two main problems. The first problem is the lack of energy conservation. Currently there is not an energy conservation program at the dye house. There are several areas where energy is being wasted. The second problem is the
23
Energy Conservation
The dye house has never had an energy conservation program. The current setup forces the staff of the dye house to constantly fight fires. This has led to several
problems. These problems will be discussed in the next sections.
Leaks
There are numerous steam and water leaks on the dye machines and the dryers. These leaks are wasting a great deal of money and energy. The steam leaks are causing the boiler to work harder. More steam is produced to make up for the steam loss through the leak. These steam leaks waste natural gas, fuel oil, water, and boiler chemicals. In addition to monetary cost, these leaks are very dangerous. Steam leaks can cause sever burns resulting in loss of time for employees.
Motors
A motor program should also be installed at the dye house. All pump and blower motors should be high efficiency motors. All motors should be tracked for failure time. Motor rewind shops should be required to show new efficiency on rewound motors. There should not be any overnight or rush rewinds done. Cost comparisons showing the cost of a new motor verses the cost of a rewind and loss of efficiency cost. The motors at the dye house are currently being rewound overnight. The motors are not high efficiency motors, and the numerous rush rewinds have further deteriorated the efficiency of the motors. The savings for replacing these motors with high efficiency models will be discussed in Chapter 3.
Motor alignment also needs to be included in the energy conservation program. Motor efficiency and life are greatly affected by the alignment of its shafts and belts. If motor shafts on directly driven equipment are misaligned, new forces are introduced that work against the shaft and especially the bearings. These forces create heat and cause the bearings to fail prematurely. The added heat also causes the motor to run less efficiently.
Industry for years has used a straight edge to align motors. This does a fair job of aligning motors in the horizontal and vertical positions, but it does not align the shaft angularly. Using a straight edge does not allow you to account for short or soft feet of motors or correct coupling distances.
New technology1 allows manufacturing to align motors to within fractions of a
millimeter. These tools use lasers to align motors. The lasers are mounted to the shafts
25
of the pumps and the motors. The shafts are rotated and readings from the lasers are sent to a hand held computer monitoring system. The system will give the user a graphical image of where and how the motor is misaligned. It will show soft feet, short feet, angular alignment, horizontal alignment, vertical alignment, and the correct tolerance of each motor the user tests. These systems are easy to use and take less than 15 minutes to test a motor.
Studies published in the TAPPI Journal show that about 50% of problems in plant machinery originate from misalignment problems. Furthermore, aligning motors
resulting in an overall maintenance budget savings of 7% and an increase in machine reliability of 12%. Bearing life was found to increase by a factor of eight. John Machelor, a specialist with the Department of Energy’s Motor Challenge states “the payback from [aligning motors] is well worth the investment in manpower and
Steam Traps
Steam traps provide a method for separating live steam that can still do useful heating from condensate that needs to be returned to the boiler house. There are a variety of mechanisms used for steam traps. The two most common types are the inverted bucket type and the float type. These traps separate steam using the density differences between steam and condensate. Most of the traps at this facility are inverted bucket or float types.
Malfunctioning traps let live steam into the condensate system and into the condensate tank. There, the steam leaves through the vent pipe, removing both heat and water from the steam system. A large plume of steam rising from the vent stack for the condensate system is a good indicator of a number of bad traps. Blocked traps can cause condensate to cover heat transfer surfaces. This increases the resistance to heat transfer and slows production
Studies indicate that between 3 and 8% of steam traps in a system will fail in a given year2. If just 5% of the traps fail, the losses can be 15% of the energy used to
generate steam. In some cases repairing steam traps have saved companies over 30% on fuel for the boiler2. Half of the thirty-two process related steam traps tested at the dye house were not operating correctly. However, to be conservative we will assume that only 2% of the energy used by the plant can be saved with a properly implemented steam trap program. The savings for fixing or replacing the traps are discussed in Chapter 3.
2 From “Steam – Manual For Conservation” Energy/Preventative Maintenance Cost Production Program
27
Insulation
All steam pipes, condensate return lines, and hot surfaces should be insulated. Insulating these items will decrease the steam needed to heat them. In the dye house basement, there were steam pipes and condensate lines that were not insulated. Insulating these pipes will help retain the heat in the pipes and ultimately reduce the amount of fuel used by the boiler. The temperature of these pipes was measured to be between 200 and 300°F. The savings for insulating all steam and condensate lines in the dye house are shown in Chapter 3.
The dye house should also insulate all of the dye machine kiers. These kiers have an average surface temperature of 200°F. Insulating these kiers will help retain the heat in the dye baths. Just like a steam pipe, retaining the heat in the kiers will reduce the fuel used by the boilers. Retaining the heat will also help production. It will lower the
Boilers
The dye house uses two BMW boilers alternatively to supply process steam. Boiler #1 is a 45,000 lb / hr water tube boiler and boiler #2 is a 50,000 lb / hr water tube boiler. Each boiler runs approximately half of the time (3,000 hr / yr). Usually, the boilers run
alternative weeks to even out ware and tear on the boilers. Each boiler is setup to run natural gas with interruptible oil (#6 fuel oil).
Currently, these boilers are not being watched very carefully. There is a first shift maintenance man who is responsible for the boiler, but unfortunately, he does not have the time to correctly maintain the boilers. Over time each boiler has developed
significant problems that need to be fixed.
Boiler #1 needs to be cleaned to reduce the stack temperature and increase the boiler efficiency. The stack temperature on Boiler #1 was found to be 531°F and the temperature of the saturated steam leaving the boiler is about 338°F. The cause of an elevated stack temperature is often dirty heat transfer surfaces in the boiler or faulty baffle walls in the boiler. It is recommended that the boiler be shut down and inspected. All boiler tubes should be cleaned of soot (on the outside) and chemically cleaned of scale on the inside of the tubes. Decreasing the stack temperature by 35-40°F will result in an increase in boiler efficiency of about 1%. The condition of the baffle walls must also be examined and appropriate repairs made, if necessary.
29
This saves heat energy that would have to provided by burning natural gas and helps the boiler recover faster from the shock of putting cold condensate into the unit.
Boiler #2 also needs some work done to it. It is recommended that this boiler be tuned-up to reduce the amount of excess air used at high fire. Using a flue gas meter, the boiler stack gases yielded the following results:
Table 11: Flue Gas Analysis
BOILER LOAD High Fire
Fuel Natural Gas
Oxygen (%) 6.7 Excess Air (%) 47 Stack Temperature (F) 425 Air Temperature (F) 70 Net Stack Temperature (F) 355 Operating Pressure (psig) 100 Saturated Steam Temperature (F) 336
Stack Loss (%) 19.54
Stack Loss Efficiency (%) 80.46
Stack loss is energy that is lost through the exhaust stack expressed as a
percentage of the total fuel fired. It can be a major area of loss in a boiler system. The stack loss efficiency is one hundred percent minus the stack loss. Under present conditions, the stack loss efficiency is about 80.46 percent. The oxygen content of the flue gases was measured to be 6.7%, resulting in an excess air value of 47%. An oxygen value between 2.5 and 4% is more reasonable, resulting in excess air levels of about 20%. This can usually be accomplished with a burner tune-up.
oil is used, one of the following steps should be taken to protest the economizer from corrosion:
1. Increase boiler feedwater temperature to 260°F.
2. Drain the economizer and then take it out of service when oil is fired.
3. Install a flue gas by-pass duct around the economizer, so that the corrosive oil flue gas will not pass over the economizer.
Contact a boiler service company and have the boiler tuned to more reasonable excess air levels (i.e., 30 percent at low loads to 20 percent at high loads). Reasonable excess air levels after a tune-up are shown in table below. Be cognizant of the fact that the burner configuration and control may limit the minimum excess air that is achievable. Sometimes burner limitations prevent the achievement of these excess air levels while keeping CO levels below 200 ppm. When that occurs, higher excess air levels must be accepted. A good service company with the capability of measuring O2 and CO can tell
31
Summary For Energy Conservation
Dye House Bottleneck
A bottleneck is the slowest leg of a process. It is the one factor that sets the production rates and work schedules. The dye house bottleneck is the dryers. The current dryer technology is vastly outdated. Two super dryers should be installed to speed up the process and save energy. The first dryer should be a two kier 2,500 lb HP-ST Super Dryer. The second dryer should be a four kier 1,600 lb HP-HP-ST Super Dryer. These two dryers would partially replace five port dryers, one extractor, two enclosed port dryers, and two pressurized dryers. Four of the port dryers would be removed from the dye house altogether, along with the two enclosed port dryers. The remaining port dryer would be used as a staging area. The two pressurized dryers would be used as backups and for overloads. The dryers will be needed when maintenance is done on the new dryers, and when production exceeds 250,000 lbs a week. However, none of the old dryers will run under normal operating conditions.
Drying Capacity
33
Table 12: Nominal Distribution of Carriers Dyed in Dye Machines Per Day
Carrier Type
Number of Carriers Per Day
1,000 lb 12
800 lb 24
300 lb 60
100 lb 12
Table 13: Existing Dryers’ Capability of Carrier Type
Dryers 1,000 lb 800 lb 300 lb 100 lb
Port 1 Yes Yes Yes Yes Port 2 No No Yes Yes Port 3 No No Yes Yes Port 4 Yes Yes Yes Yes Port 5 Yes Yes Yes Yes Perv 20 Yes Yes No No Avesta 21 Yes Yes No No Enclosed 22 No No Yes Yes Enclosed 23 Yes Yes No No
The proposed twin kier super dryer can handle the 1,000 lb and 800 lb carriers. Using a cluster carrier, the twin kiers can also handle 300 lb and 100 lb carriers. The four-kier super dryer can handle only the 300 lb and 100 lb carriers.
The average dye cycle is currently set up as a four-hour cycle. Each port dryer has an average of ten-hour cycles. Some cycles can last as long as 16-20 hours
the yarn, “No” means that it cannot dry the type of yarn, and “Quality” means that the dryer can dry the yarn but quality problems occur and the dye house would prefer not to use the dryer for that type of yarn.
Table 14: Type of Yarn Per Dryer
Dryers Cotton Polyester Rayon Acrylic
Port 1 Yes No Quality Quality Port 2 Yes No Quality Quality Port 3 Yes No Quality Quality Port 4 Yes No Quality Quality Port 5 Yes No Quality Quality Perv 20 Yes Yes Yes Yes Avesta 21 Yes Yes Yes Yes Enclosed 22 Yes Yes Yes Yes Enclosed 23 Yes Yes Yes Yes
From the table, it is clear to see that the port dryers cause a lot of scheduling and quality problems. The port dryers should dry cotton yarns only, but unfortunately they are forced to dry yarns like Rayon and Acrylic that can be burned.
35
Table 15: Number Of Carriers Per Dryer Per Day
Dryers 1,000 lb 800 lb 300 lb 100 lb
Port 1 6 6 0 0
Port 2 0 0 10 3
Port 3 0 0 10 3
Port 4 0 2 2 0
Port 5 0 2 2 0
Perv 20 3 3 0 0
Avesta 21 8 8 0 0
Enclosed 22 0 0 6 2
Enclosed 23 2 2 0 0
Total 19 23 30 8
Normal Production 12 24 60 12
Net Difference 7 -1 -30 -4
The total net difference is -28 carriers. The super dryers will be able to dry 25% more than the current production budget of 205,000 lbs. The average dry cycle for each super dryer is one hour. Table 16 shows the drying capability for the two super dryers.
Table 16: Drying Capability of the Two Super Dryers
Dryers 1,000 lb 800 lb 300 lb 100 lb
Four Kier HP-ST 0 0 80 20 Two Kier HP-ST 16 28 0 0
Total 16 28 80 20
Normal Production 12 24 60 12
Net Difference 4 4 20 8
Extra carriers present even more problems. Floor space is taken up with wet carriers waiting to go on a dryer. This increases your in house inventory dramatically. Quality also is affected. Wet yarn that has just been dyed needs to be dried immediately. Fixes that have been placed on the yarn do not fully take affect until they are dried. Yarn in the dye house can sit four to six hours before being dried. This leads to dyes
migrating. If a package migrates, the yarn must be completely reworked. A normal dye cycle for reworking a carrier is eight hours.
The current dryers are also very expensive to keep up. The dryers are very old. Many of the spare parts do not exist anymore. This causes timely repairs. With the dryers already hampering the dye house production, losing a dryer is very critical. It usually means dye machines must be stopped off until the working dryers can catch up. Standing a dye machine cost the dye house a tremendous amount of money. If the dye house loses one dryer for one week, the dye house will be forced to shut at least one big machine down for 3-5 hours a day. Chapter 4 will discuss the cost and savings that can occur from eliminating the repair cost of the current dryers.
Summary of Problems With The Current Dryers
37
Chapter 3 Implementing An Energy
Conservation Program
In Chapter 2, the problems facing the dye house were laid out. This chapter will discuss the cost and savings associated with implementing an energy conservation program. It will also detail a recommended solution to these problems. The savings, implementation cost, and pay back periods will also be discussed.
Energy Conservation
Energy conservation is key to reducing energy cost. An energy conservation program should be implemented at the dye house. This program should be monitored by an engineer and carried out by the maintenance department. A preventative maintenance program should be incorporated into this program. The program should concentrate on the following areas: repairing all leaks properly, monitoring the steam system,
Repairing All Leaks
While researching ways to improve the dye house, several different types of leaks were found. These leaks included air, water, and steam leaks. A leak can form at any given time. A gasket could fail, an air line can split, or a pipe can burst. These leaks waste energy and money.
39
Steam Leaks
The savings for repair leaks are significant. First, look at fixing the steam leaks in the dye house. Approximately 10 steam leaks were noted during the assessment. There are probably many more throughout the plant. The energy savings from repairing the leaks identified during the assessment is 750 MMBtu / yr. The estimated cost savings per year is $3,389 / yr. The estimated implementation cost is $5,000. This presents a simple pay back period of 18 months.
Anticipated Savings
During the site visit, approximately 10 steam leaks were recorded. Using a Steam Loss Calculator from Furmanite Industries3, it was determined that on average these leaks
had a blow length of about 1 feet, which corresponds to a steam loss of about 10 lbs per hour. Steam leaks increase plant steam and fuel requirements. In addition, steam leaks are also very dangerous and can cause severe burns. Below is an example of the steam leaks observed during the assessment.
Figure 12: Steam Leak In Basement
The mass flow of steam from the identified leaks is:
Steam mass flow = 10 leaks x 10 lb/hr x 6,000 hr/yr = 600,000 lb / yr
Heat Energy = 600,000 lb / yr x 1,000 Btu / lb / 80% boiler efficiency
= 750 MMBtu / yr The cost savings for repairing the leaks is:
Cost Savings = 750 MMBtu / yr x $4.21 / MMBtu
= $3,158 / yr
The steam leaks also waste water. Repairing the leaks will result in the following boiler make-up water savings:
Make-up Water Savings = 100 lb / hr x 6,000 hrs / yr.
= 600,000 lb / hr 8.34 lbs / gal
= 71,942 gal / yr.
Dye house water costs $1.3661 per 1,000 gallons. The water cost savings are:
Water Cost Savings = 71,942 gals / yr. x $1.3661 / 1,000 gallons
= $98 / yr.
The dye house also has a sewer cost of $1.4331 per 1,000 gallons. The sewer cost savings are:
Sewer Cost Savings = 71,942 gals / yr. x $1.4331 / 1,000 gallons
= $103 / yr.
41
Chemical Savings = 600,000 lb / yr x $0.05 / 1,000 lbs
= $30 / yr
The total savings per year for this recommendation is $3,389 / yr.
Implementation
Water Leaks
Fixing water leaks will also save money. During the plant assessment, several water leaks were discovered in the basement. Most of the leaks came from the dye machines. The leaks were probably from a failing gasket or corroded pipe. Repairing all water leaks from dye machines in the basement will save an estimated 675,000 gallons of water a year. This is a cost savings of $1,890 per year. The implementation cost for repairing water leaks is $2,100. The simple pay back for this recommendation is 13.3 months
Anticipated Savings
The plant is charged $1.3661 per 1,000 gallons for water and $1.4331 for sewer per 1,000 gallons. Table 17 shows the water savings found during the site visit.
Table 17: Water Savings
Location Rate (gal / min)
Total Amount of Water (gals / yr)
Savings ($ / yr)
Dye Machine #2 0.5 180,000 $504
Dye Machine #3 0.125 45,000 $126 Dye Machine #5 0.0625 22,500 $63
Dye Machine #5 0.5 180,000 $504
Dye Machine #8 0.125 45,000 $126
Dye Machine #9 0.5 180,000 $504
Dye Machine #11 0.0625 22,500 $63
Total 675,000 $1,890
43
Implementation
Each leak will take about one hour to fix and about $10 of material per leak will be needed. The total implementation cost is:
Cost = 7 leaks * [$10 per leak + 1 hr / leak * $20 labor / hr] = $2,100
The simple pay back is for this recommendation is:
Air Leaks
During the site visit there were not any visible air leaks. However, these leaks can occur at anytime and should be checked regularly. To show the next section will show how to compressed air savings from repairing leaks.
Anticipated Savings
Compressed air at a minimum of 100 psig is generated 7 days per week 24 hours per day for a total of 8,760 annual hours. Substantial savings can be realized when the volumetric flow of compressed air through leakage is reduced. The volumetric flow of free air, Vf, associated with each air leak is given by:
Vf = C PC CPd DT Ti i
1 0 2
2 0
460 460
× × × × +
× × +
( )
where,
Vf = volumetric flow of free air, cfm
C1 = choked flow constant, 1336 ft/min·°R0.5
Po = compressor operating pressure, 114.7 psia
Cd = discharge coefficient for orifice, 0.6, no units
D = leak diameter, inches Ti = inlet temperature, 90°F
C2 = conversion constant, 144 in2/ft2
Pi = inlet (atmospheric) pressure, 14.7 psia
45
The power loss from each leak, L, is the power required to compress the volume of lost air from atmospheric pressure to the compressor discharge pressure. It may be calculated as follows4:
L =
P C V k
k N C
P P E E i f o i k k N v m × × × − × × × − × − × 2 3 1 1 1 where,
L = power loss, hp
C2 = conversion constant, 144 in2/ft2
k = specific heat ratio of air, 1.4, no units
N = factor based on type of compressor considered, 2 for two-stage reciprocating compressor 1.25 for screw compressor
C3 = conversion constant, 3.03 x 10⁻⁵ hp·min/ft·lb
Ev = air compressor volumetric efficiency, 85 %, no units Em = compressor motor efficiency, 90%, no units
The reduction in electrical demand is given by: DR = L x C4 x (1-F)
where,
4 Compressed Air and Gas Handbook, Third Edition, Compressed Air and Gas Institute, New York,
C4 = conversion factor, 0.746 kW / hp
F = fraction of full power consumed when the compressor is idle, 0.6 The annual energy savings for each leak, ES, are estimated as follows:
ES = DR x 8,760 hrs / yr.
The potential savings associated with leaks of various sizes for the operating pressure at the subject plant are summarized in the Table 18.
Table 18: Summary of Savings Based on Leak Size
Leak Volumetric Power Demand Energy Cost Diameter, Flow Rate, Loss Reduction, Savings Savings
(in) (cfm) (hp) (kW) (kWh / yr.) ($ / yr.)
1/32 0.965 0.18 0.093 818 $32
1/16 3.862 0.72 0.374 3,273 $129
1/8 14.731 2.73 1.425 12,485 $493
1/4 58.924 10.92 5.701 49,938 $1,973
Implementation Cost
47
Monitoring The Steam System
The steam system is not as efficient as it should be. There are four main areas that need to be worked on and monitored regularly. These areas are steam traps, insulation of hot surfaces, condensate return system, and boiler maintenance. The next sections will discuss this in detail.
Steam Traps
To monitor the steam traps, system needs to be put into place where they are check daily. A steam trap tool or contract with a company to locate bad steam traps on a regular basis needs to be purchased. This will eliminate steam losses due to leaking traps and conserve treated boiler water. The estimated energy savings is 2,561 MMBtu per year. This represents a cost savings of $10,000 per year. The estimated implementation cost is $9,340, which presents a simple pay back period of 11.2 months.
Anticipated Savings
Table 19: Results of Steam Trap Survey
Trap Pressure Trap pk Surface
Number Location psig Type Reading Temp Condition
1 Port dryer 1908 120 SS Float 1.4 295 Good 2 Port dryer 1909 120 SS Float 0 253 Good 3 Port dryer 1910 120 SS Float 2.92 272 Good 4 Port dryer back left 120 SS Bucket 0 222 Low Temp 5 Port dryer back middle 120 SS Bucket 0 205 Low Temp 6 Port dryer back right 120 SS Bucket 0 234 Good 7 Port dye front left 120 SS Float 0.07 93 Blocked 8 Port dye front left 2 120 SS Float 0.26 144 Low Temp 9 Port dye front left 3 120 SS Float 4.23 93 Blocked 10 Port dye front left 4 120 SS Float 0 89 Blocked 11 Port dye front left 5 120 SS Float 0 118 Low Temp 12 Port dye front left 6 120 SS Float 0 136 Low Temp 13 Avesta 21 dryer left 120 SS Float 0 168 Low Temp 14 Avesta 21 dryer right 120 SS Float 0.01 195 Low Temp 15 Port dryer left 120 SS Bucket 2.5 275 Good 16 Port dryer middle 120 SS Bucket 5.04 242 Good 17 Port dryer right 120 SS Bucket 0.36 170 Low Temp 18 Port dryer 5 left 120 SS Float 0.11 276 Good 19 Port dryer 5 middle 120 SS Float 0.1 251 Good 20 Port dryer 5 right 120 SS Float 0 128 Low Temp 21 Port dryer 2 left 120 SS Bucket 1.27 230 Good 22 Port dryer 2 middle 120 SS Bucket 0.4 249 Good 23 Port dryer 2 right 120 SS Bucket 0 249 Good 24 Port dryer 4 left 120 SS Float 0 114 Low Temp 25 Port dryer 4 middle 120 SS Float 0 328 Good 26 Port dryer 4 right 120 SS Float 0 124 Low Temp 27 Enclosed dryer left 120 SS Float 1.53 310 Good 28 Enclosed dryer middle 120 SS Bucket 1.35 227 Good 29 Enclosed dryer right 120 SS Bucket 1.35 227 Good 30 Enclosed dryer 2 left 120 SS Bucket 0 208 Low Temp 31 Enclosed dryer 2 middle 120 SS Bucket 0.02 108 Low Temp 32 Enclosed dryer 2 right 120 SS Bucket 1.94 232 Good
49
the failed traps. However, experience indicates5 that the cost can be estimated from the
total flow of the steam from the boiler. Assuming a 2% steam loss due to failed traps, the potential energy savings are estimated from the total boiler fuel fired.
Energy Savings = 2% * 128,068 MMBtu / yr. 6
= 2,561 MMBtu / yr.
The cost of natural gas is $4.21 / MMBtu, the potential gas cost savings are: Cost Savings = 2,561 MMBtu / yr. * $4.21/ MMBtu
= $10,782 / yr.
Labor will be required to perform the survey every year. Using the device the NCSU IAC used, it takes less than 10 minutes to check a trap. The labor hours required is computed below:
Labor Required = 32 traps * 10 minutes / trap
= 5.4 hours / yr.
An additional 3 hours per year will be estimated to download the data into a computer, analyze the results, generate work orders, and ensure that the repairs are made. Thus, about one day is required. With a labor cost of about $20/hr, the labor cost is:
Labor Cost = (5.4 + 3) hrs / yr. x $20 / hr
= $168 / yr.
Since about 8% of the traps may fail in a given year, there is a cost of trap replacement. Most of the traps are small, costing about $200 each. Assuming a $40
5 From “Steam – Manual For Conservation” Energy/Preventative Maintenance Cost Production Program
presented by Industrial Extension Service at North Carolina State University (919) 515-5438
labor cost to replace a unit, the total cost per trap is $240. If 8% fail, the annual cost of replacement is:
Cost to Replace Traps = 8% * 32 * $240 / trap
= 3 traps * $240 / trap
= $614 / yr.
The overall cost savings are:
Overall Cost Savings = $10,782 - $168 - $614 / yr.
= $10,000 / yr.
Implementation
The cost of a trap diagnostic instrument to determine whether the traps are functioning properly is about $5,000. This cost includes a training session for personnel using the device. Assuming it takes about three days for a maintenance mechanic to learn to operate the device, the labor cost is about $500. Replacement of the sixteen traps that are currently not operating properly is estimated to cost $3,840 ($240 per trap). The total cost is $9,340 and the simple payback period is 11.2 months.
51
Insulation
To ensure that there minimal heat loss through the system, all hot surfaces need to be insulated. These surfaces include steam pipes, condensate return lines, dye kiers, and dry kiers. By insulating these surfaces, more heat is trapped in the system. Therefore, the boiler does not work as hard and boiler fuel is preserved. The following sections show the savings available by insulating all hot surfaces.
Insulation of Steam Pipes and Condensate Return Lines
Insulate all steam pipes and condensate return lines in the basement of the dye house. These pipes are losing heat to atmosphere. It is estimated that the energy savings for insulating all pipes while be 264 MMBtu per year. This is a cost savings of $1,112 per year. The estimated implementation cost is $2,405 with a 26 month simple pay back period
Anticipated Savings
The equations below will show the savings incurred by insulating a 3-inch steam pipe near Port Dryer #1. The energy savings can be defined as
ES = (UHL - IHL ) / EFF where,
UHL = heat loss from uninsulated pipe, MMBtu IHL = heat loss from insulated pipe, MMBtu EFF = efficiency of the boiler, 0.80 no units
where,
heff = effective heat transfer coefficient7, 2.68 Btu / (hr ft °F)
A = area of exposed pipes, ft2
Tp = surface temperature of the pipe, 300°F
Ts = average temperature of the outside air, 80°F
H = annual time during which pipes are heated, 6,000 hr / yr The uninsulated heat loss for the 3” piping with a length of 8 ft is:
UHL = (2.68 Btu / hr ft2 °F) * [(π) * (3 / 12 ft) * (8 ft)] * (300°F - 80°F) * (6,000 hrs / yr)
UHL = 23.1 MMBtu / yr
The heat loss from insulated pipes, IHL, is calculated from: IHL = [Ai x (Tp - Ts)/R] x H
where,
Ai = surface area of insulated pipe, ft2 Tp = surface temperature of the pipe, °F
Ts = average temperature of the surrounding air, °F
R = total thermal resistance, °F-ft-h/Btu = (ro/k) x ln(ro/r1) + 1/heff
where,
ro = radius of the pipe with insulation, in
r1 = radius of the pipe without insulation, in
k = thermal conductivity of the insulation, [0.35 Btu /(hr ft2oF)]
53
heff = effective heat transfer coefficient, 2 Btu / (hr ft2 °F)
For 1.5 inch thick fiberglass insulation on the 3” diameter piping:
R = (1.5 in / 12 in / ft) / [0.35 Btu in / (hr ft2oF)] * ln (2.25 in / 1.5 in) +1 / 2 Btu / hr ft2 °F
R = 0.645 hr °F ft2 / Btu
The insulated heat loss is for the 3” diameter piping is
IHL = [(π) * (2.25 / 12 ft) * (8 ft)] * (300°F - 90°F) * (6,000 hrs / yr) / 0.645 hr °F ft2 / Btu
IHL = 2.08 MMBtu / yr Thus, ES for this pipe is
ES = (23.1 MMBtu / yr - 2.08 MMBtu / yr) / 0.80 ES = 26.27 MMBtu / yr
The total cost savings for insulating the steam line, CS, is CS = ES x (unit cost of gas)
The total cost savings for all heated pipes is listed in Table 20.
Table 20: Savings For Insulating All Heated Pipes
Location Pipe Exposed Energy Savings Cost Savings
of Pipe Diameter (in) Length (ft) (MMBTU/yr) ($ / yr)
Port Dryer # 1 3 8 26.27 $110.61
Port Dryer #2 2 20 43.42 $182.79
Middle of Port Dryer 2 and 4 2 32 69.47 $292.47
Port Dryer # 5 1 30 13.88 $58.42
Middle of Port Dryer 2 and 4 2 30 33.51 $141.07 Middle of Port Dryer 2 and 4 1 60 34.08 $143.49
Near Dryer #23 2 10 21.71 $91.40
Near Dryer #22 2 10 21.71 $91.40
Total 264.05 $1,111.64
The net cost savings for insulating the steam pipes and the condensate lines is $1,111.64 per year with a net energy savings of 264.5 MMBtu / yr.
Implementation
55
Table 21: Implementation Cost And Pay Backs
Location Length Pipe Pipe Insulation Cost per Total Cost Simple Pay Back of Pipe (ft) Diameter (in) Thickness (in) Linear foot ($) (Months)
Port Dryer # 1 8 3 2 $16.15 $129.20 14.0
Port Dryer #2 20 2 1.5 $13.40 $268.00 17.6 Middle of Port
Dryer 2 and 4 32 2 1.5 $13.40 $428.80 17.6 Port Dryer # 5 30 1 1.5 $10.10 $303.00 62.2 Middle of Port
Dryer 2 and 4 30 2 1.5 $13.40 $402.00 34.2 Middle of Port
Dryer 2 and 4 60 1 1.5 $10.10 $606.00 50.7 Near Dryer #23 10 2 1.5 $13.40 $134.00 17.6 Near Dryer #22 10 2 1.5 $13.40 $134.00 17.6
Total $2,405.00 26.0
Insulating The Dye and Dry Kiers
A significant amount of heat is also lost during the dye cycle and the dry cycle. These kiers have an average surface temperature of 200°F. If these kiers were insulated, the estimated energy savings would be 3,461 MMBtu per year. The cost savings would be about $14,570 per year. To implement this recommendation, it would cost an
estimated $17,855. This presents a pay back of 14.7 months. The following section will detail the savings and cost associated with insulating the kiers.
Anticipated Savings
The savings incurred by insulating the dye kier on dye machine #1is calculated below. The energy savings can be defined as
ES = (UHL - IHL ) / EFF where,
UHL = heat loss from uninsulated kier, MMBtu IHL = heat loss from insulated kier, MMBtu EFF = efficiency of the boiler, 0.80 no units The heat loss from the uninsulated kiers, UHL, is given by: UHL = heff x A x (Tp - Ts) x H
where,
heff = effective heat transfer coefficient8, 2.47 Btu / (hr ft2 °F)
A = area of exposed kier, ft2
Tp = surface temperature of the kier, 200°F
Ts = average temperature of the outside air, 80°F
57
H = annual time during which kiers are used, 6,000 hr / yr
For calculation purpose, the curved section of the kier is assumed to be a flat plate therefore, the value of the effective heat transfer coefficient heff for the kier is
2.24 Btu/(hr ft2 °F). The corresponding values for heff for the top and bottom surfaces of
the kiers is 2.47 and 1.95 Btu/(hr ft2 °F) respectively.
The uninsulated heat loss from the curved section for the kier is:
UHLcurved = (2.24 Btu/hr ft2 °F) * [(π) * (66 / 12 ft) * (72 / 12 ft)]
* (200°F - 80°F) * (6,000 hrs / yr) UHLcurved = 167.12 MMBtu / yr
The uninsulated heat loss from the Top section for the kier is:
UHLtop = (2.47 Btu / hr ft2 °F) * [(π) * (66 / 12 ft)2 / 4]
* (200°F - 80°F) (6,000 hrs/yr) UHLtop = 42.27 MMBtu / yr
The uninsulated heat loss from the bottom section for the kier is:
UHLbottom = (1.95 Btu/hr ft2 °F) * [(π) * (66 / 12 ft)2 / 4]
The Total uninsulated heat loss for the kier is:
UHLtotal = UHLcurved + UHLtop + UHLbottom
= 242.7 MMBtu / yr
The heat loss from the different sections of the kier , IHL, is calculated from: IHL = [Ai(Tp - Ts)/R] x H
where,
Tp = surface temperature of the kier, 200°F
Ts = average temperature of the surrounding air, 80°F
R/Ai = thermal resistance of the section, °F-ft-h/Btu
= (L/k + 1/heff)/Ai
where,
k = thermal conductivity of the insulation, [0.025 Btu /(hr ft oF)] heff = effective heat transfer coefficient of the section, Btu/(hr ft2 °F)
L = Length of the section of kier under consideration
Ai = Area of the insulated section of kier under consideration
1-inch thick calcium silicate block insulation is assumed to be sufficient for this purpose. The calculations for the curved, top and bottom sections of the kiers are shown below.
(R/A)curved = [1 / 2.238 Btu in / (hr ft2oF)
+1 / (0.025 * 12) Btu / hr ft2 °F]/106.86 ft2 = 0.035 hr °F / Btu
(R/A)top = [1 / 2.47 BTU in/(hr ft2oF)
+1 / (0.025 * 12) Btu / hr ft2 °F]/25.23 ft2
59
(R/A)bottom = [1 / 1.946 Btu in/(hr ft2oF)
+1 / (0.025 * 12) Btu / hr ft2 °F] / 25.23 ft2 = 0.152 hr °F / Btu
The Total insulated heat loss is for the kier is:
IHL = ((A/R)curved + (A/R)top +(A/R)bottom) (To - Ti) x H
IHL = (1 / 0.035 +1 / 0.148 +1 / 0.152) hr °F / Btu * (200°F – 70°F) * (6,000 hrs / yr)
IHL = 29.9 MMBtu / yr Thus, ES for the kier is
ES = (242.7 MMBtu / yr - 29.9 MMBtu / yr) / 0.80
ES = 265.95 MMBtu / yr
The cost savings for Dye Machine #1, CS, is CS = ES x (unit cost of gas)
CS = 265.95 MMBtu / yr * $4.21 / MMBtu
The energy savings and cost savings for the other kiers are shown in the table below:
Table 22: Energy and Cost Savings For Insulating The Kiers
Machine Type Diameter (in) Depth (in) Energy Savings (MMBtu / yr)
Cost Savings ($ / yr)
Kier 1 66 72 265.95 $1,119.64
Kier 2 34 72 115.86 $487.77
Kier 3 66 72 265.95 $1,119.64
Kier 4 56 62 193.24 $813.54
Kier 5 34 72 115.86 $487.77
Kier 6 34 72 115.86 $487.77
Kier 7 56 62 193.24 $813.54
Kier 8 56 62 193.24 $813.54
Kier 9A 34 72 115.86 $487.77
Kier 9B 34 72 115.86 $487.77
Kier 9C 34 72 115.86 $487.77
Kier 9D 34 72 115.86 $487.77
Kier 10 34 72 115.86 $487.77
Kier 11 32 36 63.49 $267.31
Kier 12 32 36 63.49 $267.31
Dryer Kier 20 66 72 265.95 $1,119.64
Dryer Kier 21A 66 72 265.95 $1,119.64 Dryer Kier 21B 66 72 265.95 $1,119.64
Dryer Kier 22A 34 72 115.86 $487.77
Dryer Kier 22B 34 72 115.86 $487.77
Dryer Kier 23 66 72 265.95 $1,119.64
Total 3,461 $14,570
61
Implementation
A 1-inch thick calcium silicate block insulation is recommend for kiers. The following chart shows the implementation cost for each kier diameter. The cost of insulation is about $10 per sq.ft9. The cost includes materials and labor.
Table 23: Implementation Cost and Simple Payback For Insulating The Kiers
Machine Type
Insulated Area (ft2)
Implementation Cost ($ / yr)
Simple Payback (months)
Kier 1 132.09 $1,320.87 14.2
Kier 2 63.64 $636.43 15.7
Kier 3 132.09 $1,320.87 14.2
Kier 4 96.84 $968.39 14.3
Kier 5 63.64 $636.43 15.7
Kier 6 63.64 $636.43 15.7
Kier 7 96.84 $968.39 14.3
Kier 8 96.84 $968.39 14.3
Kier 9A 63.64 $636.43 15.7
Kier 9B 63.64 $636.43 15.7
Kier 9C 63.64 $636.43 15.7
Kier 9D 63.64 $636.43 15.7
Kier 10 63.64 $636.43 15.7
Kier 11 33.02 $330.22 14.8
Kier 12 33.02 $330.22 14.8
Dryer Kier 20 132.09 $1,320.87 14.2 Dryer Kier 21A 132.09 $1,320.87 14.2 Dryer Kier 21B 132.09 $1,320.87 14.2 Dryer Kier 22A 63.64 $636.43 15.7 Dryer Kier 22B 63.64 $636.43 15.7 Dryer Kier 23 132.09 $1,320.87 14.2
Total 1,785.5 $17,855 14.7
The total implementation cost is $17,855. With a cost savings of $14,570, the pay back is 14.7 months.