University of Windsor University of Windsor
Scholarship at UWindsor
Scholarship at UWindsor
Electronic Theses and Dissertations Theses, Dissertations, and Major Papers
1-1-2000
Effects of humidity on the adsorption of coating solvent
Effects of humidity on the adsorption of coating solvent
(m-xylene) on activated carbon.
xylene) on activated carbon.
Sukanta Basu
University of Windsor
Follow this and additional works at: https://scholar.uwindsor.ca/etd
Recommended Citation Recommended Citation
Basu, Sukanta, "Effects of humidity on the adsorption of coating solvent (m-xylene) on activated carbon." (2000). Electronic Theses and Dissertations. 6926.
https://scholar.uwindsor.ca/etd/6926
This online database contains the full-text of PhD dissertations and Masters’ theses of University of Windsor students from 1954 forward. These documents are made available for personal study and research purposes only, in accordance with the Canadian Copyright Act and the Creative Commons license—CC BY-NC-ND (Attribution, Non-Commercial, No Derivative Works). Under this license, works must always be attributed to the copyright holder (original author), cannot be used for any commercial purposes, and may not be altered. Any other use would require the permission of the copyright holder. Students may inquire about withdrawing their dissertation and/or thesis from this database. For additional inquiries, please contact the repository administrator via email
INFORMATION TO USERS
This manuscript has been reproduced from the microfilm master. UMI films the text directly from the original or copy submitted. Thus, som e thesis and dissertation copies are in typewriter face, while others may be from any type of computer printer.
The quality of this reproduction is dependent upon the quality of the
copy submitted. Broken or indistinct print, colored or poor quality illustrations
and photographs, print bleedthrough, substandard margins, and improper alignment can adversely affect reproduction.
In the unlikely event that the author did not send UMI a complete manuscript and there are missing pages, these will be noted. Also, if unauthorized copyright material had to be removed, a note will indicate the deletion.
Oversize materials (e.g., maps, drawings, charts) are reproduced by sectioning the original, beginning at the upper left-hand corner and continuing from left to right in equal sections with small overlaps.
Photographs included in the original manuscript have been reproduced xerographically in this copy. Higher quality 6” x 9” black and white photographic prints are available for any photographs or illustrations appearing in this copy for an additional charge. Contact UMI directly to order.
ProQuest Information and Learning
300 North Zeeb Road, Ann Arbor, Ml 48106-1346 USA 800-521-0600
EFFECTS OF HUMIDITY ON THE ADSORPTION OF
COATING SOLVENT (m-XYLENE) ON ACTIVATED CARBON
by
Sukanta Basu
A Thesis
Submitted to the College of Graduate Studies and Research through Civil and Environmental Engineering
in Partial Fulfilment of the Requirements for the Degree of Master of Applied Science at the
University o f Windsor
Windsor, Ontario, Canada
2000
© 2000 Sukanta Basu
1*1
National Library of C anadaAcquisitions and Bibliographic Services
395 Wellington Street Ottawa ON K1A0N4 Canada
Bibliotheque nationale du C anada
Acquisitions et
s e r v ic e s bibliographiques
395. rue Wellington Ottawa ON K1A0N4 C anada
Your file Votre reference
Our tile Notre reference
The author has granted a non
exclusive licence allowing the
National Library of Canada to
reproduce, loan, distribute or sell
copies o f this thesis in microform,
paper or electronic formats.
The author retains ownership of the
copyright in this thesis. Neither the
thesis nor substantial extracts from it
may be printed or otherwise
reproduced without the author’s
permission.
L ’auteur a accorde une licence non
exclusive pennettant a la
Bibliotheque nationale du Canada de
reproduire, preter, distribuer ou
vendre des copies de cette these sous
la forme de microfiche/film, de
reproduction sur papier ou sur format
electronique.
L’auteur conserve la propriete du
droit d’auteur qui protege cette these.
Ni la these ni des extraits substantiels
de celle-ci ne doivent etre imprimes
ou autrement reproduits sans son
autorisation.
0-612-62186-3
Canada
APPROVED BY:
~?r
Dr. K. Taylor
Chemistry and Biochemistry
Dr. R.
Civil and Environmental Engineering
Dr. P. F. Henshaw, Co-advisor Civil and Environmental Engineering
2 ^
Dr. N. Biswas, Co-advisor
Civil and Environmental Engineering
f
____________ 0 X^ 3 U u X
Dr. J. K. Bewtra, Chair
Civil and Environmental Engineering
ABSTRACT
Control of coating solvent vapors by adsorption on activated carbon in the automotive
industry can be affected by the presence o f humidity. As a foundation to better understand
the adsorptive behavior of these organic solvents, in this investigation, adsorption of m-
xylene in the presence of water vapor on granular activated carbon was studied.
Single component (m-xylene and water vapor) adsorption experiments were first
conducted as prerequisites for the binary component (m-xylene with water vapor) studies.
The dynamic method of gas adsorption technique (passing a flux composed of carrier gas and
adsorbate vapor through a fixed bed adsorbent and subsequently analyzing the outlet
adsorbate concentrations) was used throughout this research. The experimental results were
then compared with predictive models to capture the dominant features of the data.
For the equilibrium and kinetic studies of water vapor adsorption, an online digital
hygrometer was used in conjunction with an electronic balance. Relative humidity values
from 18 to 96% were examined. The adsorption isotherm was found to resemble a type V
isotherm (Brunauer classification system). The adsorption capacities from the gravimetric
measurement were within 14% of the values obtained from the kinetic studies based on the
area integration of the breakthrough curves.
The m-xylene adsorption system design was similar to the water vapor adsorption
system, except the online measurement of the adsorbate was done by gas chromatograph with
the help of a six-port valve. The concentration range studied was 52 to 1030 ppm. The
limiting pore volumes resulting from the m-xylene adsorption experiments (0.56 mL/g)
iii
differed considerably from those found in the water vapor adsorption studies (0.2 mL/g). The
explanation of this anomalous behavior was beyond the scope o f this study.
A conglomeration of the single component systems was employed for the binary
component adsorption experiments. Relative humidity values o f 54 to 88% and organic
concentrations from 178 to 1120 ppm were studied. A surface plot and a matrix table were
used to interpret the complicated binary data. The adsorption capacity of m-xylene decreased
with increasing relative humidity. The effect of humidity was greater at low m-xylene
concentrations.
iv
To M y Family
V
ACKNOWLEDGEMENTS
I wish to express my deep sense of gratitude to Dr. Paul Henshaw for his
extraordinary support and guidance at all stages throughout this study, especially for all the
“5 minutes discussion sessions” [never less than an hour] he granted me.
I would like to sincerely thank Dr. Nihar Biswas for his priceless advice regarding my
research, and for having provided the facilities needed for this work.
The quality o f this thesis was also significantly improved by the valuable suggestions
o f my other committee members, Dr. Richard Amdt, Dr. Keith Taylor and Dr. Jatinder
Bewtra, which I greatly appreciated.
The technical support I received from Mr. Steve Budinsky of Technical Support
Centre, and Mr. Patrick Seaguin, technician, Civil and Environmental Engineering was of
great importance and it certainly saved me a lot of time!
Thanks to all my friends in Civil and Environmental Engineering, including a special
thought to Mr. Ahmed Elgendy for his generous help during my research. Most o f all, I am
indebted to my friend Valerie Guerin, for being there, with me, in the course of many happy
and difficult times.
Lastly, I am grateful to the Civil and Environmental Engineering program for the
financial support I received throughout my graduate study at University o f Windsor.
vi
TABLE OF CONTENTS
page
ABSTRACT iii
DEDICATION v
ACKNOWLEDGEMENTS vi
NOTATIONS x
ACRONYMS xiii
LIST OF TABLES xiv
LIST OF ILLUSTRATIONS xiv
CHAPTER ONE - INTRODUCTION
1.1 Background 1
1.2 Paint Solvents and Air Pollution 2
1.3 Regulations 2
1.4 Emissions Reduction Options 4
1.5 Control Option — Adsorption 6
1.6 Adsorption — Effects of Humidity 6
1.7 Objective 7
1.8 Scope 7
CHAPTER TWO - LITERATURE REVIEW
2.1 Water Vapor Adsorption 9
2.1.1 Water Vapor Adsorption: Adsorption Equilibria 9
2.1.2 W ater Vapor Adsorption: Kinetics 14
2.2 VOC Adsorption 17
2.2.1 Prediction of VOC Adsorption Capacity 17
vii
2.3 Effects of Humidity on VOC Adsorption
2.3.1 Modeling Effects of Humidity on VOC Adsorption
21 22
CHAPTER THREE - MATERIALS AND METHODS
3.1 Adsorbent 25
3.2 W ater Vapor Adsorption 25
3.2.1 Adsorbate 25
3.2.2 Experimental Set Up 26
3.2.2.1 Vapor Generation 26
3.2.2.2 Adsorption 26
3.2.2.3 Detection 28
3.2.3 Procedure 28
3.3 Single Component VOC Adsorption 29
3.3.1 Adsorbate 29
3.3.2 Experimental Setup 29
3.3.2.1 Vapor Generation 29
3.3.2.2 Adsorption 29
3.3.2.3 Detection 31
3.3.3 Procedure 31
3.4 Binary Component Adsorption 33
3.4.1 Adsorbates 33
3.4.2 Experimental Setup 34
3.4.3 Procedure 34
CHAPTER FOUR - RESULTS AND DISCUSSION
4.1 W ater Vapor Adsorption: Adsorption Equilibria 37
4.2 Modeling Water Vapor Adsorption Equilibria 39
4.3 Water Vapor Adsorption: Kinetics 41
4.4 VOC Adsorption 49
4.5 Effects of Humidity on VOC Adsorption 52
viii
CHAPTER FIVE - CONCLUSIONS AND RECOMMENDATIONS
5.1 Conclusions 59
5.2 Recommendations 60
APPENDIX A - PAINT SOLVENTS 62
APPENDIX B - ROTAMETER CALIBRATION 64
B .l Rotameters 64
B.2 Flow Ranges 64
B.3 Rotameter Calibration 66
APPENDIX C - GC CALIBRATION 68
GLOSSARY* 71
REFERENCES 74
VITA AUCTORIS 80
* To enhance the readability o f this thesis the terms in italics are defined in the glossary.
i x
NOTATIONS
A wide range of notations has been employed in this thesis. To make reference to the
original papers easier, the original notations have been retained.
a adsorption capacity (g/g)
A differential molar work of adsorption (cal/mole)
ao number of primary adsorption center
ac constant of equation 2.9
as limiting adsorption capacity (g/g)
b kinetic constant in equation 2.12
c constant in equation 2.3
Co inlet concentration (ppm)
Cx outlet concentration (ppm)
f constant in equation 2.14
h relative humidity (%)
ho hysteresis
k kinetic constant in equation 2.13 (m in'1)
ki rate of desorption (equation 2.1)
ki rate of adsorption (equation 2.1)
k3 empirical factor in equations 2.4, 2.5 and 2.6
k4 constant in equation 2.21
kv adsorption rate constant in equation 3.1
x
K empirical constant in equation 2.11
Kf constant in equation 2.14
Me adsorbate uptake at equilibrium (g/g)
M t adsorbate uptake at time t (g/g)
P equilibrium vapor pressure o f adsorbate (kPa)
Ps saturated vapor pressure (kPa)
p equilibrium vapor pressure of adsorbate (kPa)
Po saturated vapor pressure (kPa)
P50 empirical constant in equation 2.11
Ps saturated vapor pressure (kPa)
q adsorption capacity (g/g)
Q air flow rate (L/min)
qo limiting adsorption capacity (g/g)
qvoc VOC adsorption capacity (g/g)
qvoc.RH=0 pure component VOC adsorption capacity (g/g)
n constant in equation 2.21
R gas constant (1.987 cal/mole °K)
RH relative humidity (%)
t time (min)
T absolute temperature (°K)
£b breakthrough time (min)
Vo limiting pore volume of the adsorbent (cc/g)
V0 molar volume o f organic in equations 2.19 and 2.20 (cc/gmol)
Vw molar volume of water in equations 2.19 and 2.20
w
volume of organic adsorbate adsorbed (cc/g)Wo limiting adsorption volume (cc/g)
We limiting adsorption capacity (g/g)
AW water uptake or loss (g/g)
GREEK LETTERS
a difference between two points on isotherm (equation 2.12)
P
constant of equations 2.10 and 2.16Y constant of equation 2.10
8 adsorption potential (cal/mole)
K DR equation constant (equation 2.16)
P density of adsorbate (g/cc)
PB bulk density of carbon (g/cc)
xii
ACRONYMS
ASTM The American Society for Testing and Materials
CAA Clean Air Act
CAAA Clean Air Act Amendments
CCME Canadian Council of Ministers of the Environment
CCOHS Canadian centre for Occupational Health and Safety
FID Flame Ionization Detector
GAC Granular Activated Carbon
GC Gas Chromatography
HAP Hazardous Air Pollutant
HPLC High-Performance Liquid Chromatography
IGA Intelligent Gravimetric Analyzer
NAAQS National Ambient Air Quality Standard
NOx Nitrous Oxides
OEM Original Equipment Manufacturers
PPM Parts Per Million (by Volume)
RACT Reasonably Available Control Technology
RH Relative Humidity
THF T etrahydrofuran
UV Ultra Violet
VOC Volatile Organic Compound
xiii
LIST OF TABLES
Table 1.1 Source Guideline limits 4
Table 1.2 Total Annualized Costs ($/Year) 5
Table 1.3 Cost Effectiveness ($/Ton VOC Removed) 5
Table 3.1 Physical properties o f BPL 6x16 25
Table 3.2 GC Operational Parameters 31
Table 4.1 Water Vapor Adsorption Equilibrium Data 37
Table 4.2 Isotherm Parameters 39
Table 4.3 Adsorption Kinetic Experiments 42
Table 4.4 Adsorption Rate Constants 48
Table 4.5 Physical Properties of m-xylene at 303° K 49
Table 4.6 Adsorption Experiment Data o f m-xylene 49
Table 4.7 Comparison of Models for VOC Adsorption Equilibrium 50
Table 4.8 Adsorption Equilibrium Data for Mixed Vapor 53
Table 4.9 Matrix Table 53
Table A .l Typical Paint Solvents Used in Automotive Coating Applications 62
Table A.2 Typical Compositions o f Solvents Found in Automotive Paints 63
xiv
LIST OF ILLUSTRATIONS
Figure 2.1 Comparison of Water Vapor Adsorption Isotherms at 298 K
Figure 2.2 Cross Section o f the Adsorbed Layer
14
according to the Potential Theory 19
Figure 2.3 Schematic Representation of Okazaki’s Model 23
Figure 3.1 Experimental Setup (Water Vapor Adsorption) 27
Figure 3.2 Experimental Setup (VOC Adsorption) 30
Figure 3.3A Six-Port Valve System (Running Mode) 32
Figure 3.3B Six-Port Valve System (Sampling Mode) 32
Figure 3.4 Experimental Setup (Mixed Vapor Adsorption) 35
Figure 3.5 Experimental Setup (View 1) 36
Figure 3.6 Experimental Setup (View 2) 36
Figure 4.1 W ater Vapor Adsorption Isotherm 38
Figure 4.2 Comparisons of Experimental Data to Results from Models 40
Figure 4.3 Breakthrough Curves 41
Figure 4.4 Comparisons of Gravimetric and Integration Results Data 43
Figure 4.5 Kinetic Graph (RH=18%) 44
Figure 4.6 Kinetic Graph (RH=32%) 44
Figure 4.7 Kinetic Graph (RH=42%) 45
Figure 4.8 Kinetic Graph (RH=52%) 45
Figure 4.9 Kinetic Graph (RH=65%) 46
Figure 4.10 Kinetic Graph (RH=68%) 46
Figure 4.11 Kinetic Graph (RH=89%) 47
Figure 4.12 Kinetic Graph (RH=96%) 47
Figure 4.13 VOC Adsorption Isotherm 50
Figure 4.14 Characteristic Curve for VOC Adsorption 51
Figure 4.15 Surface Plot o f Mixed Vapor Adsorption 54
Figure 4.16 Variation of Retained Adsorption Capacity with RH 56
Figure 4.17 Breakthrough Curves for Water Adsorption
(Binary Component Adsorption) 57
Figure 4.18 Dlustration of the Rollover Phenomena 58
Figure B. 1 Dry Test Meter Calibration (Air Flow vs. Error Plot) 65
Figure B.2 Dry Meter Calibration Curve 65
Figure B.3 Rotameter Calibration Setup 66
Figure B.4 Rotameter Calibration (Flow Range 0-1.5 L/min)
using Soap Bubbler Meter 67
Figure B.5 Rotameter Calibration (Flow Range 0-5.6 L/min) 67
Figure C. 1 GC Calibration of m-xylene (Liquid Phase) 68
Figure C.2 GC Calibration of m-xylene (Vapor Phase) 69
Figure C.3 Means Chart (C=143.8 ppm) 70
Figure C.4 Means Charts (C=545.9 ppm) 70
xvi
CHAPTER ONE
INTRODUCTION
1.1 BACKGROUND
Coating o f parts by priming, painting and scaling is the most expensive unit operation
in automobile manufacturing and its major source of environmental pollution in terms of
volatile organic compounds (VOCs), hazardous air pollutants (HAPs), waste paint streams
and solid waste. It consumes a disproportionate amount of energy considering the small
amount of paint involved. Today, the complete automobile painting process requires
approximately 16% of the total primary energy consumption for the entire vehicle production
process, depending on the car’s size (Harsch et al. 1999). According to Ford Motor
Company’s 1997 U.S. Toxic Release Inventory Data, approximately 80% of all pollutants
that were released to air, water and land from all Ford U.S. automotive operations in 1997
were from paint solvents (Kim et al. 2000). In 1992, General Motor’s annual pollution
control costs were over $150 million for the U.S automotive operations. Although, the
pollution control costs were insignificant compared to General M otor’s annual operational
costs, more than 60% of these costs were devoted to air emissions control (Geffen et al.
1998).
Clearly, the above figures depict the economic and environmental importance of the
painting process in the automotive industry.
1
1.2 PAINT SOLVENTS AND AIR POLLUTION
Traditional organic automotive paint solvents (Table A .l, Appendix A), nearly all of
which are categorized as VOCs, have dominated the surface coating process for decades
(Healey et al. 1998).
The organic solvents perform the critical role o f transporting the resins, pigments,
stabilizers and extenders and giving the coating the necessary viscosity, surface tension and
other chemical properties that aid in the consistent application of individual coating layers.
The choice of a particular organic solvent depends on the substrate composition and
geometry, application equipment to be used, curing temperature and time range, and coating
solids’ characteristics.
Evaporation during drying of the paint solvents is the major source of VOC emissions
in automotive manufacturing. Additionally cleaning, priming, surfacing, repairing and
equipment cleaning, also contribute to the overall VOC emissions from the automotive
painting process.
1.3 REGULATIONS
VOCs play the role of precursors in the photochemical smog pollution. When VOCs
are mixed with nitrogen oxides (NOx) and irradiated by ultraviolet (UV) light, a complex
chain of reactions converts them into ozone, aldehydes, hydrogen peroxide, peroxyacetyl
nitrate, organic and inorganic acids and fine particles. Among these, ozone is considered to
be the most significant photochemical pollutant because of its wide range o f effects on
human health, plant growth and climatic change (Bloemen et al. 1993). To achieve ground
level ozone reduction, regulations principally focus on the reduction o f VOCs emissions. In
2
the United States, the Clean Air Act (CAA) is one of the numerous statutes and regulations
that regulate VOCs emissions.
But after more than 20 years of regulations, approximately 100 urban areas in the
United States still exceed the ozone National Ambient Air Quality Standards (NAAQS),
referred to as ozone nonattainment areas. The Clean Air Act Amendments (CAAA) of 1990
greatly increased the regulatory framework for control o f volatile organic compound
emissions. The amendments require that each state with one or more ozone nonattainment
areas impose controls on sources o f VOCs sufficient to allow those areas to comply with the
ambient standard (Hellwig 1998). As a result of the CAAA, many original equipment
manufacturers (OEMs) were being forced to reduce VOC emissions in their painting
operations (Triplett 1995b).
In addition, in July 1997, the Environmental Protection Agency (EPA) issued its final
ruling to reduce the NAAQS for ozone from 0.12 ppm to 0.8 ppm averaged over an 8-hour
period (Hussey et al. 1998). This greatly increased the number o f nonattainment areas. As a
result, many minor sources of VOC emissions became significant. Facilities that previously
were subject only to either state VOC emissions regulations or were exempt from regulation
were then forced to implement federally defined Reasonably Available Control Technologies
(RACTs).
Regulations regarding VOC emissions in general or specific organic compounds are
currently found in several jurisdictions in Canada (Rix 1998). In 1990, The Canadian Council
o f Ministers of the Environment (CCME) introduced a NOx/VOCs Management Plan
(CCME, 1990). Apart from that, a number of studies have been conducted through the
CCME, leading to the development o f Codes of Practice for different industries, such as the
3
New Source Performance Standards and Guidelines for the Reduction of Volatile Organic
Compound Emissions from Canadian Automotive OEM Coating Facilities (CCME, 1995).
Source Performance Standards Limits (SPSLs) are expressed in grams of VOC emitted per
square metre of total vehicle body surface area. Separate limits exist for automobiles,
passenger vans and sport/utility vehicles, light duty trucks and vans. Table 1.1 shows the
Source Guideline Limits.
Table 1.1. Source Guideline Limits
Interim* Final**
Automobiles 65 gm/m2 55 gm/m2
Passenger vans & sport/utility vehicles 70 gm/m2 60 gm/m"
Light duty trucks & vans 80 gm/m2 75 gm/m2
* Interim limits take effect on January 1, 2000 ** Final limits take effect on January 1, 2005
Source: Mancina, A. S. (1998)
1.4 EMISSIONS REDUCTION OPTIONS
For automotive coating operations, effectively meeting today’s strict VOC regulations
is an ongoing challenge. Three primary alternatives may be explored to achieve this goal.
The first is to switch to “environmentally friendly” coatings, such as waterbomes,
UV-cure or powder coatings. But often the critical requirements of high gloss, smooth
surface and minimal first-run defects now met by solventbome clear coats are not fulfilled by
these coatings.
The second option is to reduce the VOC emission rate through changes to the paint-
line design. For example, paint-booth exhaust volumes can be reduced through air re
circulation (Triplett 1995a).
4
The final alternative is to install add-on controls. This is the solution chosen by most
automotive companies today. Several options are available to control VOCs: oxidation,
adsorption, UV/ozone catalytic oxidation, biofilters, and wet/dry filtration etc. Tables 1.2 and
1.3 compare the total annualized costs and cost effectiveness o f some o f these abatement
technologies. To compare the technologies on a common basis, the costs were calculated
using published values and vendor supplied cost factors on four model gas streams (100 and
10 ppm benzene in air and 100 and 10 ppm tetrachloroethylene in air, all at a flow rate of
10,000 scfm) (EPA 1995).
Table 1.2 Total Annualized Costs ($/Year)
Processes
Benzene Cone, (ppm)
Tetrachloroehylene Cone, (ppm)
100 10 100 10
Catalytic Incineration 271,923 274,376 290,705 291,393
Regenerative Thermal Incineration 180,991 180,991 245,916 252,316
Regenerable Fixed Bed Carbon Adsorption 98,873 98,873 98,199 58,711
QVF Absorption 331,400 331,400 331,400 331,400
Source: EPA (1995)
Table 1.3 Cost Effectiveness ($/Ton VOC Removed)
Processes
Benzei (P
te Cone, pm)
Tetrachloroehylene Cone, (ppm)
100 10 100 10
Catalytic Incineration 5,489 55,381 5,868 58,829
Regenerative Thermal Incineration 3,653 38,147 4,964 50,928
Regenerable Fixed Bed Carbon Adsorption 1,996 1,996 1,780 11,850
QVF Absorption 6,700 66,900 3,300 32,800
Source: EPA (1995)
5
Controlling VOC emissions from spray coating operations has historically been cost
prohibitive, due to high exhaust flow rates coupled with low VOC concentrations
(approximately 100 parts per million by volume) (Ayer 1997, Kim 1997).
One way of compensating for the high control costs is by the recovery of the VOCs.
Low cost adsorbent(activated carbon), high capture efficiency (in the range of 95-98%) and
economical recovery established adsorption as the technology of choice (Ruhl 1993 and Basu
et al. 2000).
1.5 CONTROL OPTION — ADSORPTION
However, the adoption o f adsorption technology is not straightforward (Golovoy
1981). Rational methods are essential for reliable and economically effective design and
operation of an adsorption system. Conscious choice of process factors (e.g. proper
adsorbent) can reduce the spray booth exhaust concentration by a factor o f 10 in surface
coating operations (Hussey et al. 1998).
1.6 ADSORPTION—EFFECTS OF HUMIDITY
Activated carbon’s adsorptive capacity drops significantly in the presence of humidity
(Werner et al. 1986). In the case o f spray booths with wet Venturi scrubbers (widely used in
automotive coating facilities for primary removal of particulate matter followed by
adsorption beds), the humidity level of the inlet stream to the adsorbent bed is generally very
high. The contaminant stream may be heated to reduce the relative humidity but the increase
in temperature usually reduces the adsorption efficiency. In applications like steam
regeneration of activated carbon, adsorption of water vapor also has been encountered.
6
Residual water present on the carbon after regeneration affects the performance o f the
subsequent adsorption step. Moreover, in recent years, there has been a growing interest in
the application o f waterborne coatings. In waterborne coatings organic solvents are replaced
with water, thus reducing VOC emissions significantly (but not completely) while
unfortunately increasing the humidity level in the spray booth.
Since some level of humidity will always be present in spray booths, there is a need
for a better understanding of the adsorptive behavior of VOCs in the presence of humidity on
activated carbon.
1.7 OBJECTIVE
The objective of this research was to study the adsorption of an automotive coating
solvent in the presence o f water vapor on activated carbon.
1.8 SCOPE
To study the interference of humidity with the adsorption of organic solvent (VOC), it
was essential to understand the manner in which water and VOC adsorb onto activated
carbon individually. So, both binary component (m-xylene with water) and single component
(Water and m-xylene) adsorption experiments were conducted using a laboratory activated
carbon column. Several predictive models were also investigated for their capability to model
the adsorption processes and experimental results were compared with the model predictions
wherever possible.
The selection of the solvent (m-xylene) was based on its major usage as a paint
solvent (Table A.2, Appendix A and Golovoy 1981) as well as its posing a threat to the
public, workers and the environment (Bloemen et al. 1993 and CCOHS 1984).
In essence the scope of this work was to:
• study the equilibria and kinetics o f water vapor adsorption onto granular activated
carbon (GAC).
• study the single component VOC adsorption onto GAC.
• demonstrate the adverse effect of humidity on VOC adsorption.
• compare the theoretical models delineating the above processes.
8
CHAPTER TWO
LITERATURE REVIEW
2.1 WATER VAPOR ADSORPTION
Water has a complicated sorptive behavior as revealed by its characteristic sigmoid
shaped isotherm (Type V in the Brunauer classification system). This S-shape indicates that
more than one mechanism is responsible for the adsorption of water vapor onto microporous
activated carbon (Noll et al. 1991). Adsorption o f water vapor begins on the primary
adsorption sites (oxygen surface complexes) at low relative humidities (Dubinin 1980). The
number of such available primary sites decreases with increasing relative humidities (RH) as
more water vapor adsorbs onto those sites (Qi et al. 2000). The adsorbed water molecules
then act as secondary adsorption sites and other water molecules attach to these by hydrogen
bonding. At a sufficiently high relative humidity, capillary condensation occurs to fill the
micropores with water, causing a sharp increase in the adsorption capacity. This phenomenon
apparently begins to occur at approximately 50% relative humidity, depending on the type of
carbon (Werner et al. 1988).
2.1.1 Water Vapor Adsorption: Adsorption Equilibria
Accurate estimation of adsorption equilibria is o f great importance when dealing with
experimental studies and the development of models that predict the performance o f
adsorbers (Huggahalli et al. 1996). But, due to the unique sigmoidal behavior caused by the
primary and secondary adsorption sites, only a few adsorption isotherm models can be used
to describe the adsorption equilibria of water vapor onto activated carbon (Qi et al. 2000).
9
The first attempt at an approximate quantitative description of the initial region o f the
water vapor adsorption isotherm (DS-1) on carbonaceous adsorbents was made by Dubinin
and Serpinsky (Dubinin 1980). Development of the adsorption isotherm equation began with
the assumption of a dynamic equilibrium between adsorption and desorption (Equation 2.1).
If ao is the number of primary adsorption centers, and a is the adsorption value for relative
humidity of h = p/ps, then the dynamic equilibrium condition will be expressed by:
k2(a0 + a)h = k,a
(2.i)
The corresponding adsorption isotherm equation (DS-1) becomes:
a n ch
a =
0 ^ 0 ( 2 ' 2)where, c = k 2 k l
Equation 2.2 describes the initial region and the main part of the sharp rise of the isotherm up
to h < 1/c. The equation parameters ao and c can be easily determined graphically from the
linear form of the equation:
h
_
l
h
(2.3)
a
(a0c)
a 0
The DS-1 model is only valid for RH < 60% (Qi et al. 2000).
Dubinin et al. (1981) extended their earlier model (DS-1) to describe the adsorption
of water vapor over the entire pressure range. An empirical factor (l-k3a) was introduced into
the dynamic equilibrium equation to take into account the decrease in the number o f acting
adsorption centers with an increase in filling.
10
The dynamic equilibrium condition was expressed by:
k
2
(a
0
+ a)(l — k
3
a ) h =
k { a.(2.4)
The parameter k was determined from the condition a=as at h= l. Where, as is the limiting
value of vapor adsorption. Denoting the kinetic constant ratio c = k2/k I; the expression for k3
becomes:
As a result the isotherm equation (DS-2) for water vapor adsorption on active carbon takes
the form (Barton et al. 1991):
The parameters (ao, c, k3) of this equation can be determined from a single adsorption
isotherm (Dubinin et al. 1981).
Barton et al. (1991) modified the models of Dubinin et al. (1980, 1981) and applied
them to water vapor adsorption on a number o f carbons having a wide variation in surface
oxide concentration. Following Dubinin and Serpinsky, they derived the cubic form of the
DS model (DS-3). The model assumes that water vapor adsorption takes place initially on
very active primary sites on the carbon surface. The concentration o f these sites is so- The
adsorption o f water on these sites is similarly expressed as ao. Secondary, hydrogen bonded
water is designated as an- Assuming the adsorption equilibrium is described by the mass
action law, the following can be written:
1 1
(2.5)
(2.6)
(2.7)
C[-C5 are kinetic parameters governing the rates o f adsorption and desorption.
11
The empirical factor (1-ka2) is introduced to cause a decrease in adsorption site concentration
as total adsorption (a) increases. Following certain assumptions and after some simplification
and rearrangement, Equation 2.7 (DS-3) becomes:
The parameter, k, is connected with the saturated adsorption (similar to DS-2), as, when h = l.
But, DS-3 is unsuitable for modeling, because it can not be inverted to describe the
dependence o f adsorption capacity on the relative humidity (Huggahalli et al. 1996).
Barton et al. (1992) introduced a fourth parameter ( a j in the model DS-3 to provide
better representation for super activated carbon (AX-21) and largely microporous char
(PVDC). The new equation (DS-4) suggested:
The values of the parameters ao, c, k and were obtained, as before, by non-linear regression
analysis o f experimental data. The DS-4 model provided excellent fit for AX-21 and PVDC
char as well as for the BPL carbons (Barton et al. 1992).
Kisarov (1984) obtained an isotherm equation by treating adsorbent-adsorbate and
adsorbate-adsorbate interactions as quasi-chemical reactions. But, evaluation of the
parameters in the resultant expression is indirect and cumbersome (Huggahalli et al. 1996).
Doong and Yang (1987) modified the original Dubinin-Radushkevich (DR) equation
(Dubinin 1975) by including two additional parameters (hysteresis, h0, and activity
coefficient, y) to advance the quantitative description of water vapor adsorption (Qi et al.
2000).
h = 1
c [l - ka (a o + a )]
(2.8)(2.9)
12
The DY model was written as follows (Qi et al. 2000):
q = pV 0exp
pE In
y P 0 - (inh 0 )' (2.10)
Where, q = adsorption capacity of water vapor; p = density of adsorbed water; V0 = limiting
pore volume of the adsorbent; P = vapor pressure of water; Po = saturation vapor pressure of
water; T = absolute temperature; p and E are DR isotherm parameters; y = coefficient to
account for different degrees of association in the liquid and adsorbed phases; and ho
accounts for hysteresis. The value for y (RH < 60%) is calculated using the Dubinin-
Serpinsky equation (DS-2), whereas y (RH > 60%) = 1 (Doong et al. 1987).
Recently, Qi et al. (1998) developed the QHR model (Equation 2.11) and compared it
with the DY model (Qi et al. 2000). The QHR model was shown to be in better agreement
with experimental water vapor adsorption data than the DY model for a predominantly
microporous coal-based activated carbon (Qi et al. 2000). The QHR isotherm model can be
written as (Qi et al. 1998):
q = p V o
1 + exp K 50
yj
(2.11)
Where, q, p, V0, P, Po are same as described above. The empirical parameters P50, and K are
derived by fitting the experimental data to the model. The model was also verified using
experimental data for water vapor adsorption onto four different activated carbon adsorbents
from 288 to 308 K at 101 kPa total pressure (Qi et al. 1998).
13
Hassan et al. (1991) compared the water vapor adsorption data (on BPL activated
carbon) o f Freeman et al. (1979), Barton et al. (1984), Mahle et al. (1988) and Hassan et al.
(1991). Figure 2.1 exhibits the characteristic sigmoid shape water vapor adsorption isotherm.
Hassan et al. (1991) attributed the large differences in the uptake values (as shown in the
figure) to differences in the regeneration temperature, lots of activated carbon used and the
ultimate vacuum attainable in each system during regeneration.
a -fiu © ia < ec u V « £ at)
0 . 4 0
0 . 3 6
0 . 3 2
0 . 2 8
0 . 2 4
0 . 2 8
0 . 1 6
0 . 1 2
0 . 0 8
0 . 04
0 . 0 0
w}' / a
s ?
¥ f
/
■ .* / / / / A
f £ j A Hassan et al. (1991) Mahle et al. (1988) Barton et al. (1984) Freeman et al. (1979)
J i’
6 . 0 0 . 1 0 . 2 0 . 3 0 . 4 0 . 5
P/PS
0 . 6 0 . 7 0 . 8 0 . 9 1.8
Figure 2.1. Comparison of Water Vapor Adsorption Isotherms at 298 K
{Source: Hassan et al. 1991)
2.1.2 W ater Vapor Adsorption: Kinetics
For the water vapor adsorption, knowledge o f the shape of the breakthrough curve is
also desirable. The time to breakthrough is often the criterion used to assess the performance
o f an activated carbon unit. But, investigations of the adsorption kinetics of water vapor on
activated carbons are very scarce (Foley et al. 1997).
14
Lin et al. (1996) investigated the relationship between adsorption/desorption kinetics
and equilibrium partitioning of water vapor on activated carbon grains. The adsorption and
desorption isotherms, and adsorption and desorption kinetic curves were measured by an
electrobalance (RH 0 to 86%) at 20°C. A model that accounts for transport within grains by
pore and surface diffusion was coupled with the experimentally determined piecewise-linear
isotherm to interpret the experimental kinetic data. The model results indicated that gas-
phase diffusion dominates transport through the pores at RH < 60%. Surface diffusion was
found to be important at higher RH values.
Lodewyckx et al. (1997) reported a general formula for the dynamic uptake of water
on microporous activated carbons. Three different types o f commercial activated carbons
(Chemviron BPL, SC II and Norit R1E) were equilibrated at a known relative humidity (0 to
90%). Then they were exposed to an air flow with a different (higher or lower) relative
humidity. The samples were weighed at regular intervals to obtain a curve for weight
loss/gain vs. time. This curve was fitted with the Equation 2.12 using non-linear regression.
Where, AW = water uptake or loss; a = difference between the two points on the water
isotherm; b = kinetic constant and t = time.
In a later work Lodewyckx et al. (1998) tested the validity of Equation 2.12 for two
other types of commercial activated carbon (Chemviron ASC-T and Norit C Granular). They
also tried to evaluate the influence of different parameters (temperature, air flow and bed
depth) on the kinetic constant b.
C r
A W = a 1 - exp - —
(2-12)\ V
15
Foley et al. (1997) studied the adsorption of water vapor on a highly microporous
carbon derived from the carbonization o f coconut shell. The static atmosphere water vapor
adsorption/desorption kinetics for a carbon with preadsorbed water were studied using an
Intelligent Gravimetric Analyzer (IGA) for a series of changes in vapor pressure. The
adsorption rate constants were also studied for three relative humidities for a dynamic flow
system at a constant temperature. The water uptake was described by the following
phenomenological model:
M t 1 1 u ) (2-13)
= 1 — e x p ( — k t )
M e
Where, Mt = gas uptake at time t, Mc = gas uptake at equilibrium, t = time and k = empirical
constant.
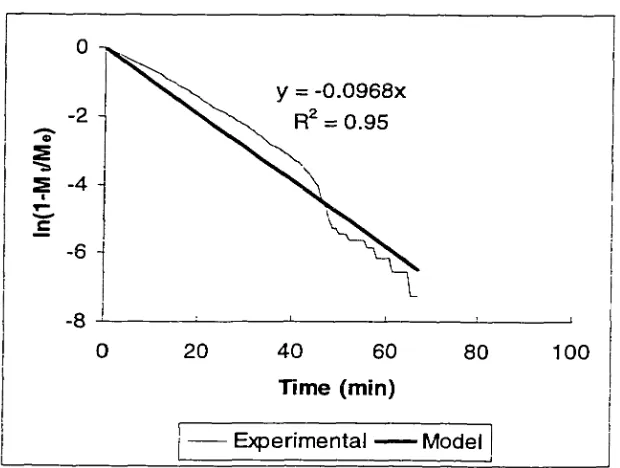
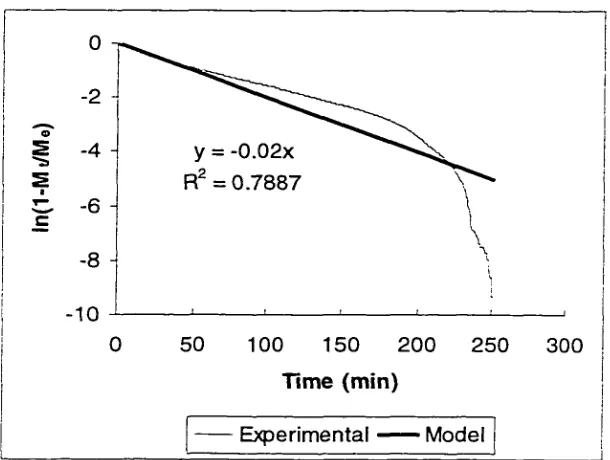
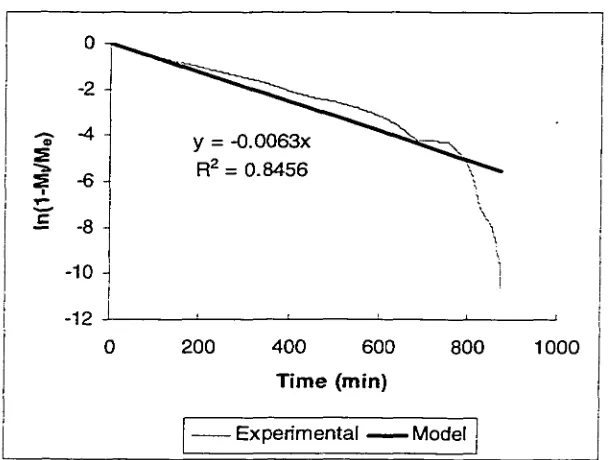
The rate constants were calculated from the gradient o f the In(l-M t/Me) versus time
graph. The rates of adsorption and desorption vary with the position on the isotherm and
hence the mechanism of the adsorption process. The fastest rates were observed for
adsorption on the primary adsorption centers at low relative pressures. The slowest rates of
both adsorption and desorption were observed in the region of relative humidities in the
range 40-70%, where the adsorption process involves the growth of clusters of water
molecules on the primary adsorption centers. This leads to water molecules bridging between
pore walls and adjacent water molecule clusters when a significant amount of free surface is
available and eventually leads to condensation of water vapor in the pores.
16
2.2 VOC ADSORPTION
The mechanism o f the VOC adsorption is different from that of water vapor
adsorption. Hydrogen bonding to the oxidized adsorption sites is the major influence during
water vapor adsorption, whereas dispersional forces greatly influence the adsorption of
VOCs. Thus, volume filling of the micropores occurs with organic vapor, while adsorption of
water begins at specific sites on the carbon surfaces (Wemer et al. 1988).
There have been numerous investigations on the adsorption isotherms of VOCs on
activated carbons. A great number of isotherm models also have been developed. W emer et
al. (1988) made an excellent review of the VOC adsorption predictive models. In the
following section two of the most successful models (Freundlich isotherm and Potential
theory o f adsorption) will be briefly presented.
2.2.1 Prediction of VOC Adsorption Capacity
Freundlich isotherm is an empirical equation (Equation 2.14) whose form is simply
designed to fit the parabolic shape of a typical adsorption isotherm (Wemer et al. 1988).
W =
K FP f(2.14)
Where, W = volume of organic adsorbate adsorbed, P = partial pressure of the adsorbate and
Kp and f are empirical coefficients (unique for each adsorbate-adsorbent pair and operating
condition). For the design o f adsorption systems, the equilibrium adsorption study on the
same adsorbent at different operating conditions is considered as an essential part of the
design. The Freundlich equation, however, is operating condition specific and can not be
used as a predictive model for untested adsorbates.
17
The Potential theory of adsorption (Noll et al. 1991, W emer et al. 1988) or the theory
o f volume filling (Dubinin et al., 1971; Dubinin 1975) is based on rational physical and
chemical concepts rather than on the empirical fit o f experimental data. This theory is
specifically applicable to the adsorption of organic vapors on microporous adsorbents (e.g.
activated carbon). This model predicts, in principle, the adsorption capacity of a given
adsorbent for any untested adsorbate at any concentration and at any temperature.
Based on the Potential theory of adsorption, originally developed by Polanyi (1932),
Dubinin in 1960 developed the theory of adsorption in micropores (Dubinin 1975). The
central idea was the concept of adsorption potential involving adsorbent and adsorbate.
Adsorption potential was defined as the work to transfer an adsorbate molecule from the
vapor phase to a compressed state within the pores o f the carbon. Mathematically, the
adsorption potential (e) can be expressed as:
' P . A
£ = R T ln (2.15)
Where, R = universal gas constant, T = absolute temperature, P = equilibrium vapor pressure
of the adsorbate vapor at a given temperature, and Ps = saturation value of P.
The potential was conceptualized (Figure 2.2) as a field extending outward from the
surface of the carbon and decreasing in force with increasing distance from the surface. The
value of £ varies within the adsorption space from some maximum value (£ma.x) to zero,
depending upon proximity to the adsorbent surface (Tien 1994). W is the volume of space in
the carbon pores in which the potential compressional forces are greater than or equal to the
corresponding £ value. Therefore, W 0 (corresponding to £ = 0) is the limiting adsorption
volume of the microporous carbon. At the surface of the carbon, W = 0 (£ =
£max)-18
At equilibrium the adsorbed amount is accommodated in the higher adsorption
potential layers. No lower potential layer can contain adsorbate at equilibrium unless ail the
higher potentials are full (Noll et al. 1991). Therefore, there is a definite relationship between
the adsorbed volume (W) and the adsorption potential (e). Plots of W vs. 8 are termed
“characteristic curves” of the adsorbent. The characteristic curve is independent of
temperature. Ideally, knowing the characteristic curve for an adsorbent and the affinity
coefficient (coefficient which permits the comparison of the adsorption potential of the test
adsorbate to a reference adsorbate) of the test VOC enables one to calculate adsorption
isotherms for that compound.
Gas Phase W = W0, e = 0
Adsorption Space
W — 0, 8 — 8 max Adsorbent
Figure 2.2. Cross Section of the Adsorbed Layer
according to the Potential Theory (Source: Young et al. 1962)
19
Dubinin and co-workers defined a general mathematical form o f the characteristic
curve (Dubinin et al. 1971, Dubinin 1975, W emer et al. 1988), known as the Dubinin-
Radushkhevich (DR) equation:
InW = InW o - k
f
£ \ 2(2.16)
The DR equation, however, fails for many gas-solid systems (Doong et al., 1988).
During the later stage of the development of the theory of volume filling of micropores,
Dubinin et al. found that the initial principles of the potential theory have no physical
meaning for adsorption in micropores (Dubinin 1975). They adopted a strict thermodynamic
interpretation of the function
( R ^
A = RTln
v p ,
(2.17)
expressing the differential molar work o f adsorption equal, with a negative sign, to the
change in free enthalpy. A more general equation (DA equation) proposed by Dubinin and
Astakhov may be represented as follows (for activated carbon):
f A V
q = q 0 exp
v E y
(2.18)
where q is the adsorption at a temperature T and equilibrium pressure p, qo is the limiting
adsorption value corresponding to the filling o f the whole volume of the adsorption space
W0, and E is the characteristic free energy o f adsorption.
20
2.3 EFFECTS OF HUMIDITY ON YOC ADSORPTION
Many studies have pointed out that water vapor in the carrier gas could compete with
VOCs and may substantially and adversely affect the adsorption of VOCs on activated
carbon (Nelson et al. 1976, Moyer 1983, Jonas et al. 1985, W emer 1985). This effect has
been demonstrated for different applications of activated carbon, various organic adsorbates,
a range of relative adsorbate pressures, and various ambient conditions of adsorption (Wemer
et al. 1988). In essence, air humidity is a prime factor, which should be considered during the
design and operation o f carbon adsorption processes.
Numerous factors influence the extent to which humidity affects the vapor phase
adsorption process. First, the adsorption of various adsorbates is affected differently,
depending largely on their chemical characteristics (Moyer 1983). In general, hydrophobic
organic adsorbates are affected by water vapor to a greater extent than hydrophilic adsorbates
(Wemer 1985, Cal et al. 1996). Second, the concentration of the adsorbate has a significant
influence at a given level of relative humidity (W em er et al. 1988). Decreasing the adsorbate
concentration generally increases the adverse effect o f humidity (Moyer 1983, W emer et al.
1988). Third, the humidity level also influences the magnitude of its effect. Below 50% RH
the effect is minimal, however the effect increases with increasing humidity (Nelson et al.
1976, Jonas et al. 1985, Chou et al. 1997). This statement is in line with the observation that
the water adsorption isotherm on activated carbon increases sharply at about 50% relative
humidity (Okazaki et al. 1978). Lastly, the carbon structure can also influence the magnitude
o f impact by water vapor. W ater molecules are believed to adsorb onto oxidized sites of the
carbon adsorbent (Dubinin 1980, Dubinin et al. 1981). The greater the number of oxidized
21
sites on the adsorbent, the greater the interference water molecules can exert on the
adsorption of an organic vapor (W emer et al. 1988).
Interference of organic adsorption by water vapor is a special case of multicomponent
adsorption. However, multicomponent adsorption theories generally fail in predicting
adsorption equilibria of organics and water vapor systems. Therefore, in the literature, special
models have been proposed, some o f which will be reviewed in the following sections.
2.3.1 Modeling Effects o f Humidity on VOC Adsorption
Okazaki et al. (1978) proposed a method to predict the adsorption equilibria of
mixtures of solvent and water vapor on activated carbon. The model is based on evaluating
the amounts of solvent and water in the capillary condensed phase in the fine pores and in the
ordinary adsorbed phase on the surface o f the coarse pores, respectively (Okazaki et al. 1978,
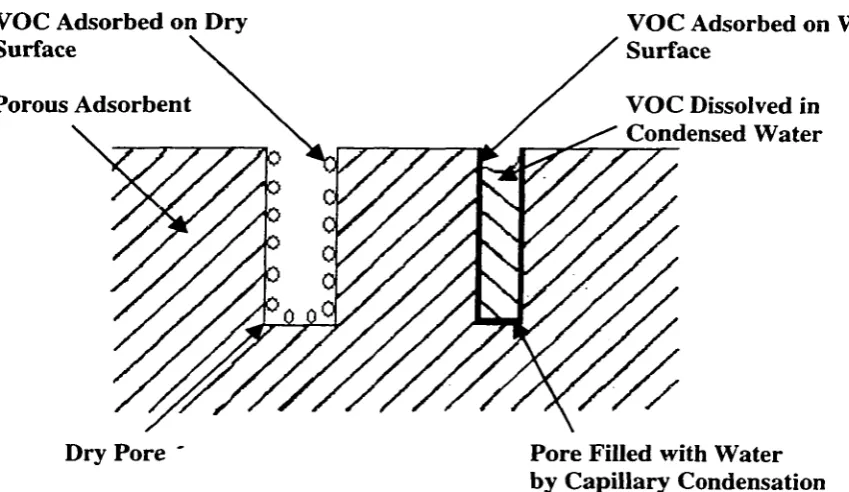
Doong et al. 1987, and Chou et al. 1997). Figure 2.3 illustrates the proposed adsorption
model. According to this model, the organic vapors are adsorbed onto the activated carbon by
three different mechanisms: (1) adsorption on the dry surface (those pores in which
condensation of water vapor does not take place); (2) dissolution in the condensed water; and
(3) adsorption on the wet surface (pores in which condensation occurs). The total capacity of
the activated carbon for the VOC is the sum of these components (Okazaki et al. 1978 and
Crittenden et al. 1989). The necessary data for this model are: pure component gas-phase
adsorption isotherms, liquid-phase isotherms of organics, vapor-liquid equilibria and pore
volume, surface area distribution curves for the carbon. A large amount of system data
required makes this model cumbersome to use (Doong et al. 1987).
22
VOC Adsorbed on Dry VOC Adsorbed on Wet
Surface Surface
Porous Adsorbent VOC Dissolved in
Condensed Water
Dry Pore ' Pore Filled with Water by Capillary Condensation
Figure 2.3. Schematic Representation o f Okazaki’s Model
(Source: Crittenden et al. 1989)
Manes (1984) developed a Polanyi Potential theory based model for estimating the
effect of humidity on the adsorption o f water-immiscible organic vapors onto activated
carbon. It was assumed that adsorbed water reduces the pore space available for adsorption
o f an organic compound on a one-to-one volume basis. Additionally, Manes assumed that at
100% RH adsorption o f any organic vapor is equivalent to its adsorption from a water
solution. At 100% RH, the net adsorption potential o f the organic vapor is its normal
adsorption potential (£o°, associated with its pure-component vapor adsorption in the absence
o f water vapor) diminished by the adsorption potential o f an equal volume of water (ew°),
given as:
^ V v 0 ^ (2.19)
e n = Co ° q _ c , 0* w
V w J
23
Where, V0 and Vw are molar volumes of the organic and water respectively in their liquid
state. Equation 2.19 is applicable to any immiscible organic under the condition that the
organic adsorbate volume is less than the volume of adsorbed water. If the organic volume is
greater than that of water, no interference results from the presence o f water (W emer et al.
1988). Characteristic curves for the pure component adsorption of VOC and water are
prerequisite for this model.
For the more generalized case, if the RH is less than 100%, the modified Equation
2.19 becomes:
p - P o _ o
fc0 — fc0 w +
Vo \ , v „ ,RTln
1
RH j (2.20)
The method of solution for the Manes model is somewhat tedious (Cal et al. 1996).
Doong et al. (1987) suggested a model based on Dubinin’s theory o f volume filling.
This model, however, requires solving by a complicated trial-and-error procedure (Tien
1984).
Recently, Chou et al. (1997) proposed a simple Freundlich-like model (Equation
2.21) for adsorption capacities for VOCs in humid air streams.
--- = 1 - k 4 • RH 1/n (2-21>
9 voc, RH = 0
Where, qvoc is the equilibrium adsorption capacity in an air stream with a relative humidity
RH and q VOc.RH=o corresponds to that with RH = 0 at the same temperature. The parameters of
equation 2.21 can be found by regression analysis.
24
CHAPTER THREE
MATERIALS AND METHODS
3.1 ADSORBENT
The activated carbon used was type BPL (Calgon Carbon Corporation) in 6x16 mesh
form. BPL is a bituminous coal-based virgin granular activated carbon (GAC) activated at a
high temperature in a steam atmosphere. Manufacturer’s data for the physical properties of
the GAC are listed in Table 3.1.
Table 3.1. Physical Properties o f BPL 6x16
Property Value
Approximate Shape Sphere
Apparent Density (g/mL) 0.47 Min
Moisture, weight %, as packed 2.0 Max
Ash, weight % 8 Max
Iodine No., (mg/g) 1050 Min
Particle Size (weight %)
> 3.36 mm (US mesh 6) 5.4 Max
< 1.19 mm (US mesh 16) 5.0 Max
Source: Calgon Carbon Corporation
The activated carbon was dried at a temperature of approximately 150°C for 24 hours
and subsequently cooled at room temperature in a desiccator before the experiments.
3.2 WATER VAPOR ADSORPTION
3.2.1 Adsorbate
Water vapor (18% < RH < 96%) was selected as the target adsorbate.
25
3.2.2 Experimental Setup
The experimental setup is shown in Fig. 3.1. It consists of three functionally discrete
sections: vapor generation, adsorption and detection.
3.2.2.1 Vapor Generation
The compressed air from the laboratory air system was used as carrier gas. A
laboratory gas drying unit (Drierite, W. A. Hammond Drierite Co., Ohio) was used to remove
oil, humidity and submicron particles. The influent humidity level after the drier was less
than 5%. The air was then humidified by diverting a portion of the dry influent air through a
water bubbler and then combining it with the dry dilution air. Two flowmeters with built-in
controllers (FM044—40C, Cole Parmer) were used to adjust the flow rates (of humid air and
dry dilution air respectively) to achieve a particular design humidity level in the influent.
Total flow was measured with a rotameter. The rotameter was calibrated using a soap-bubble
meter (Universal Pump Calibrator, Inspector’s model 302, Environmental Compliance Corp.)
and a Dry test meter (175-S Meter, Rockwell Manufacturing Company). Appendix B
describes the calibration of the rotameter.
3.2.2.2 Adsorption
The adsorber was a vertically supported glass column, 38.5 mm in inner diameter and
155 mm in height. The lower end of the column had a flat fritted glass support for the carbon
bed. The column had a ground glass outer joint at the top. The design of the adsorber was in
agreement with the ASTM recommendations (ASTM 1995).
26
Re pro du ced w ith pe rm iss io n of th e c op yr ig ht ow ne r. Further rep roduction p ro h ib it e d wit ho u t p e rm is s io n .
Pressure Gauge Thermocouple Vent
Flowmeters with Controllers
Lab A ir Drying Unit
Lab A ir Supply
N)
•-4
Online Data
/ * * " ■
Adsorption Column
W ater Bath
W ater Bubbler
Rotameter
Thermo Hygrometer Sensor Probe
Upstream adsorption bed pressure was measured with a pressure gauge (Trerice Pressure
Gauge, Trerice Co., Windsor, Ontario).
3.2.2.3 Detection
The relative humidity was measured with a high performance digital thermo
hygrometer (RH411, Omega Engineering Inc., Stamford, Connecticut). Analog signal
outputs (10 mV / %RH and 10 mV / °F) were connected to a computerized data acquisition
system (CIO-DAS16/Jr, Computer Boards Corporation, Massachusetts). CIO-DAS16/Jr is a
16 channel 12 bit analog input board capable of data acquisition at 110 KHz. A software
package (Snap-Master™, HEM Data Corp., Michigan) was used as the interface. Online data
acquisition allowed continuous monitoring of relative humidity and temperature
simultaneously.
3.2.3 Procedure
The adsorbent bed weights used in this investigation ranged from 20 to 35 g (dry
weight) o f activated carbon (corresponding bed height was approximately 35 mm). Parafilm
was used to seal the column while weighing to avoid any prehumidification. The column was
connected to the system sometimes after the initial start-up period. This was done to avoid
the exposure of the carbon bed to the unsteady conditions. The flow direction was downward
to avoid fluidization of the bed. The flow rate was maintained at approximately 1 L/min. To
maintain an isothermal condition (30°C) the column was placed in a water bath. The
temperature o f the bed was measured with a T type thermocouple placed between the carbon
granules, about 25 mm from the top o f the bed. The temperature of the bed varied from 29°C
28
to 31°C. To delineate the kinetics of water vapor adsorption, RH values o f the effluent were
collected every 40 seconds with the help of the online data acquisition system. To obtain the
equilibrium adsorption data, the tests were continued for at least 1 hour past the time when
the effluent RH equalled the influent RH. The column was then quickly removed from the
system, sealed with parafilm and the adsorbent weight gain was measured using a balance
(Mettler AE 163).
3.3 Single Component VOC Adsorption
3.3.1 Adsorbate
Anhydrous m-xylene (99+%, Aldrich) was used as target VOC for adsorption. A
concentration range of approximately 50-1000 ppm was considered in this research.
3.3.2 Experimental Setup
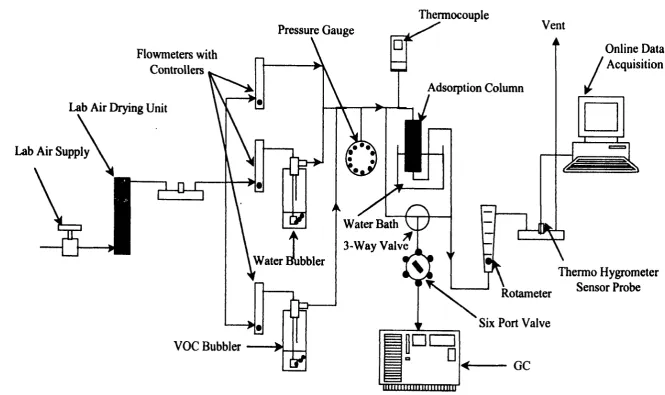
The experimental setup is shown in Figure 3.2.
3.3.2.1 Vapor Generation
The vapor generation section was almost identical to the one described in section
3.2.2.1. The only basic difference was that instead of using water in the bubbler, m-xylene
was used. The m-xylene vapor was mixed with the dry dilution air to achieve the desired
VOC concentration in the influent.
3.3.2.2 Adsorption
Same as section 3.2.2.2.
29
Re pro du ced w ith pe rm iss io n of th e c o py ri gh t ow ne r. Further reproduction p ro h ib it e d w ith out p e rm is s io n .
Pressure Gauge Thermocouple
Vent
Lab Air Drying Unit
Lab Air Supply
O
Flowmeters with Controllers
Adsorption Column
©
W ater Bath
Six Port Valve
1
Rotameter
VOC Bubbler
Figure 3.2 Experimental Setup (VOC Adsorption)
33.2.3 Detection
A gas chromatograph (HP 5890A) equipped with a megabore HP-INNOWax
capillary column (30 m x 0.53 mm ID) with a 1.0 pm film thickness (Hewlett-Packard Co.)
and a flame ionization detector (FID) was used for the detection of m-xylene. The choice of
HP-INNOWax column was based on its high tolerance for moisture content in the samples.
To analyze the concentration of the gas streams, a six-port valve system (Valeo Co.) with a
250 |iL sampling loop was used. Fig. 3.3 shows the detailed description of this valve system.
The retention time for m-xylene was 5.87 min using the oven temperature gradient in Table
3.2. The operational parameters of the GC system are given in Table 3.2.
Table 3.2. GC Operational Parameters
Carrier: Nitrogen, 1 mL/min, Constant Pressure
Oven: 35° C (2.5 min), 10° C/min to 85° C
Injection: 250° C, Split (100:1)
GC System: HP GC/FID, 300° C
3.3.3 Procedure
The basic procedure was the same as water vapor adsorption. At low adsorbate
concentrations the complete saturation takes considerable time. To avoid that, an accelerated
testing procedure (ASTM 1995) was adopted for VOC adsorption. It was achieved by
increasing the flow rate (to approximately 4 L/min) through the adsorption bed while
maintaining the desired adsorbate concentration.
The GC was initially calibrated by 6 standard solutions o f m-xylene in liquid
tetrahydrofuran (THF; HPLC grade, Fisher Scientific). GC calibration is described in detail
31
Sample Loop
Influent
3-way Valve
Split Vent Effluent
InnoWax Capillary Column
Figure 3.3A Six-Port Valve System (Running Mode)
Sample Loop
Influent
3-way Valve
Split Vent Effluent
InnoWax Capillary Column
Figure 3.3B Six-Port Valve System (Sampling Mode)
32