University of Windsor University of Windsor
Scholarship at UWindsor
Scholarship at UWindsor
Electronic Theses and Dissertations Theses, Dissertations, and Major Papers
1-1-2019
Design for Circular Economy
Design for Circular Economy
Maha Elia
University of Windsor
Follow this and additional works at: https://scholar.uwindsor.ca/etd
Recommended Citation Recommended Citation
Elia, Maha, "Design for Circular Economy" (2019). Electronic Theses and Dissertations. 8163. https://scholar.uwindsor.ca/etd/8163
This online database contains the full-text of PhD dissertations and Masters’ theses of University of Windsor students from 1954 forward. These documents are made available for personal study and research purposes only, in accordance with the Canadian Copyright Act and the Creative Commons license—CC BY-NC-ND (Attribution, Non-Commercial, No Derivative Works). Under this license, works must always be attributed to the copyright holder (original author), cannot be used for any commercial purposes, and may not be altered. Any other use would require the permission of the copyright holder. Students may inquire about withdrawing their dissertation and/or thesis from this database. For additional inquiries, please contact the repository administrator via email
Design for Circular Economy
By
Maha Elia
A Thesis
Submitted to the Faculty of Graduate Studies through the Industrial Engineering Graduate Program
in Partial Fulfillment of the Requirements for the Degree of Master of Applied Science at the
University of Windsor
Windsor, Ontario, Canada
2019
Design for Circular Economy
by
Maha Elia
Approved by:
______________________________________________
A. Asfour
Department of Civil and Environmental Engineering
______________________________________________
H. ElMaraghy
Department of Mechanical, Automotive and Materials Engineering
______________________________________________
W. ElMaraghy, Advisor
Department of Mechanical, Automotive and Materials Engineering
III
DECLARATION OF ORIGINALITY
I hereby certify that I am the sole author of this thesis and that no part of this thesis has been published or submitted for publication.
I certify that, to the best of my knowledge, my thesis does not infringe upon anyone’s copyright nor violate any proprietary rights and that any ideas, techniques, quotations, or any other material from the work of other people included in my thesis, published or otherwise, are fully acknowledged in accordance with the standard referencing practices. Furthermore, to the extent that I have included copyrighted material that surpasses the bounds of fair dealing within the meaning of the Canada Copyright Act, I certify that I have obtained a written permission from the copyright owner(s) to include such material(s) in my thesis and have included copies of such copyright clearances to my appendix.
IV
ABSTRACT
In recent years climate change has become a big challenge affecting all human beings, living
creatures and the entire ecosystem. Hence the importance of mitigating its effect and finding
innovative solutions to combat and slow down its accelerating impact on the environment. One of
the solutions is to reduce emissions and restore the earth which is the “circular economy” concept.
This research is focused on the indicators that can be used to measure the circularity of a product.
The analysis compares more than one assessment tool used as indicator then an in-depth research
is performed on one of the methodologies proposed by the Ellen MacArthur Foundation which
includes a main indicator known as the Material Circularity Indicator (MCI) and two
complementary indicators known as risks and impacts complementary indicators.
The goal of the proposed study is a new methodology and a new tool to measure the product
circularity that takes the complexity of the product into consideration. One way to measure the
product complexity is to measure the ease of disassembly and the time and effort required to
disassemble a product which can be reflected as the profitability of disassembly. The profitability
of disassembly is calculated by finding out the amount of material that can be extracted feasibly
from a product or, to put it in another way a decision must be made to recycle or not to recycle in
advance, which is usually related to the material’s price as well as the time of disassembly. This is
especially the case if there is no incentive to recycle or regulations to encourage recycling, where
the profit factor becomes a dominant one in taking the decision to recycle or not.
The significance and novelty of this research comes from providing a more accurate measurement
for the material circularity indicator proposed by Ellen Mac Arthur Foundation, as well as finding
out the feasibility of recycling by looking at the different challenges related to the product’s
V
DEDICATION
VI
ACKNOWLEDGMENT
The author would like to express her appreciation to her advisor Professor Waguih ElMaraghy for his guidance, patience, and support during this journey. This thesis would not have been possible without his assistance. His support has gone beyond supervising and recommending topics. One of the most challenging moments was selecting a research topic, but with Professor Waguih ElMaraghy’s help the process was smooth and the topic was innovative.
The author is also thankful for the valuable feedback from all the committee members.
Thanks go to Professor Hoda ElMaraghy and Professor Abdul-Fattah Asfour for their valuable comments, recommendations, and feedback during the committee meetings.
The author would also like to acknowledge the help and support from her fellow researchers and colleagues at the Intelligent Manufacturing Systems Centre (IMSC). Special thanks to Ms. Jessica Olivares Aguila for her help and advice.
VII
TABLE OF CONTENTS
DECLARATION OF ORIGINALITY ... III ABSTRACT ... IV DEDICATION ... V ACKNOWLEDGMENT... VI LIST OF FIGURES ... X LIST OF TABLES ... XII
CHAPTER 1: INTRODUCTION ... 1
1.1. Overview ... 1
1.2. Motivation ... 2
1.3. Research Objectives ... 3
1.4. Research Scope: ... 3
1.5. Research Gaps and Novelty: ... 4
1.6. Research Plan ... 4
1.7. Thesis Hypothesis ... 6
CHAPTER 2-THE CIRCULAR ECONOMY (CE) ... 7
2.1. CE Definitions ... 7
2.2. CE Contribution to Sustainable Development ... 8
2.2.1. Sustainable Development Goals ... 9
2.2.2. The Social Pillar of Sustainable Development ... 11
2.2.3. The Environmental Pillar of Sustainable development ... 11
2.2.4. The Economic Pillar of Sustainable development ... 12
2.3. CE Principles and Fundamental Characteristics ... 13
2.3.1. Implementation Levels of (CE) ... 15
2.3.2. Business models / Strategies of Circular Economy implementation ... 17
2.3.3. Mechanism of Circular Economy ... 20
2.4. Methodologies and indicators used to measure CE ... 21
2.4.1. Circular Economy Toolkit (CET): ... 21
VIII
2.4.3. Circularity Indicators by Ellen Mac Arthur Foundation ... 25
2.5 The Ellen MacArthur Methodology (In depth approach) ... 26
2.5.1. Terminology used in this methodology: ... 30
2.5.2. Calculation of Material Circularity Indicator ... 34
2.5.3. MCI and LCA differences and commonalities ... 41
2.5.4. Profitability Impact of Circular Initiatives ... 42
2.5.5. Factors affecting the recycling process efficiencies: ... 43
2.5.6. Recycling, Downcycling and upcycling ... 43
2.6. Comparison between the three indicators: ... 46
2.7. Research Gap related to Circularity Indicators: ... 47
CHAPTER 3. PRODUCT COMPLEXITY ... 48
3.1. Introduction: ... 48
3.2 Disassembly and types of disassembly: ... 48
3.3. Product Disassembly-For recyclability purposes (remanufacture, reuse or recycle) ... 51
3.4. Disassembly Aspects- Product complexity indicators ... 52
3.4.1. Complexity based on the physical attributes ... 52
3.4.2. Disassembly sequence generation... 53
3.4.3. Complexity based on the time of disassembly -ease of disassembly... 53
3.4.4. The disassembly from a profitability point view: ... 56
3.4.5. Economic analysis ... 60
3.4.6. Cost-benefit analysis to disassembly ... 61
3.5. Research Gap related to Product complexity: ... 62
CHAPTER 4. PROPOSED METHODOLOGY AND ANALYSIS OF CE METRICS ... 64
4.1 Overview ... 64
4.2. Development of the Methodology: ... 65
4.3. IDEF 0 (Parent-Child) diagram ... 72
CHAPTER 5. METHODOLOGY VALIDATION AND APPLICATION ... 75
5.1. Case Study 1: Three Hole Punch... 76
5.2. Case Study 2- LCD monitor ... 80
5.3. Case study 3: Keyboard disassembly ... 84
IX
6.1. Discussion ... 85
6.2. Conclusion ... 87
6.3 Recommendations for future research... 88
REFERENCES ... 89
X
LIST OF FIGURES
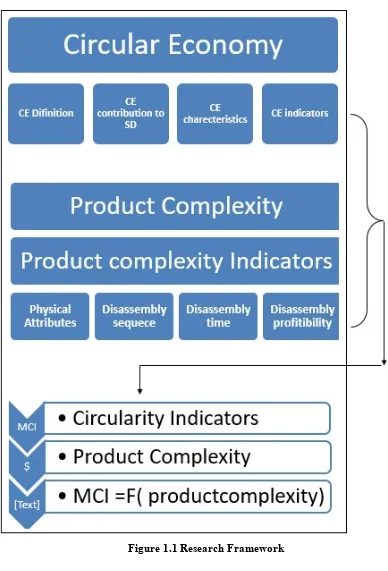
Figure 1.1 Research Framework ………...………....….... 5
Figure 2.1 - Sustainable Development Pillars ……….………... 8
Figure 2.2- The 17 Sustainable Development Goals ………...………... 9
Figure 2.3 The Butterfly Diagram ...………...… 12
Figure 2.4 The Circular Economy Benefit………...………... 13
Figure 2.5 CE Characteristics ………... 14
Figure 2.6 Levels of Implementation of CE ………....…….15
Figure 2.7 Level of Implementation of CE suggested by Saidani et al………....………… 16
Figure 2.8 CE Implementation Levels (Macro, Meso, Micro) ………....… 17
Figure 2.9 -ReSOLVE framework………. ………...…….18
Figure 2.10 The 9R Framework ……….………...……19
Figure 2.11 Four sources of value creation ……….…………... 21
Figure 2.12-Circular Economy Toolkit………... 23
Figure 2. 13 Circular Economy Indicator Prototype (CEIP)………...24
Figure 2. 14 MCI- Dynamic Modeling Tool ...…... 26
Figure 2.15 -Material Flow Diagram ………...…… 34
Figure 2.16 Material flow showing symbols used ... 35
Figure 2.17: Impact of product utility on the MCI (E MacArthur, 2015) ...39
Figure 2.18 MCI Company level -Dynamic Modeling Tool ... 41
Figure 3.1- Product Complexity / disassembly Indicators ... 52
Figure 3.2 eDiM (ease of disassembly) ... 56
Figure 4.1 Proposed material flow analysis- new assumption ...70
Figure 4.2 IDEF0 (Parent Diagram) ...73
XI
Figure 5.1 Three- Hole Punch ...76
Figure 5.2 Front and back view of the LCD monitor ... 80
Figure 5.3 Material composition of 28 LCD monitors ...81
XII
LIST OF TABLES
Table 2.1 Terminologies used in CE ... 30
Table 2.2 Terms and variables used to measure product circularity ... 31
Table 2.3 Symbols used in calculating the MCI ... 33
Table 2.4 Comparison between the three indicators (CET), CEIP) (EMFM) ...46
Table 3.1 Notation used in calculating profit of recycling ... 58
Table 4.1 Equations used in calculation of the disassembly profitability ...66
Table 4.2 Recyclability rates of materials ...69
Table 4.3 Equations used to measure the MCI based on new assumptions ... 72
Table 5.1 complexity of three different products ... 75
Table 5.2 Analysis of Three-hole punch ... 77
Table 5.3 Reclamation Value calculation ...77
Table 5.4 MCI calculations for Three-Hole Punch ...79
Table 5.5 Material Composition of 28 LCD monitors... ... 81
Table 5.6 Reclamation value from LCD monitor disassembly ...82
Table 5.7 MCI calculations for LCD monitor ...83
1
CHAPTER 1: INTRODUCTION
1.1.
Overview
Circular economy as Tolio et al. refer is the new paradigm for sustainable development, the vision of this paradigm is to shift from the linear economy which is “Take-Make-Dispose” into a new one which is restorative and regenerative by intention and design (Tolio et al., 2017). It replaces product “end of life” concept with the concept of restoration and elimination of waste. “No longer can a product be designed considering the factors of cost and performance only but rather a shift from the traditional design practices must include consideration of the ultimate end of the product’s life” (Johnson & Wang, 1998). From that perspective it is becoming a must to focus on the early stage of design to aid the process of economical material recovery and to address waste disposal in a proactive manner.
The circular economy is a concept that we have to embrace to face the different challenges ranging from material depletion of elements, such as gold, silver, iridium, tungsten and many others vital for industry that are expected to be depleted within the next 5–50 years (Lieder & Rashid, 2016), to the challenges of an increasing world’s population which is estimated to be nine billion by 2030. With the limited resources of material and the increasing need of energy and resources to keep pace with the luxurious life in developed countries and the challenges facing poor counties a need of using of superior design of material, products, systems and business models becomes a must.
This research is analyzing the relationship between product complexity and Material Circularity Indicator (MCI) an indicator found by Ellen Mac Arthur foundation that measures the circularity of a product. The complexity of the product can be interpreted in different ways and measured by different methodologies. Complexity can be understood as the difficulty of disassembly or in another word the ease of disassembly. This research is looking at the difficulty of the disassembly of the product from different prospective by measuring the feasibility of the disassembly and how it can affect the efficiency of recycling and how that in turn affects the Material Circularity Indicator (MCI). By looking at different papers and different researches related to identifying the difficulty of the disassembling process, some papers and methodologies are studied below.
Chapter two includes a literature review on the circular economy concept, its definitions, its benefits and its contribution to the sustainable development concept. Then a more in-depth review on the circular economy concept is performed by looking at the levels of implementation, the business models used and finally the different methodologies and indicators used to measure the circularity of a specific product. One of the gaps found in the investigated product circularity indicators is the lack of measuring the complexity of the product and its effect on the circularity indicators. In order to understand the complexity and the different approaches to measure it another literature review on product complexity was performed in chapter three.
2
money to disassemble a product and recycle it, away from the environmental aspect, the feasibility of disassembly is a major factor we cannot ignore.
After analysing the methods used to measure product complexity/ease of disassembly in order to find its effect on circular economy, chapter four proposes a methodology which includes equations and formulas used to relate the product complexity to the material circularity indicator.
The main approach of this thesis is to find out the relation between the complexity and the circularity of a product through studying the effect of product complexity on the efficiency of recycling by taking the feasibility and profitability of disassembling and recycling into consideration first in order to decide to recycle or not, this is accomplished by drawing the relation between product complexity and the material Circularity Indicator (MCI).
Finally, a tool is designed, and a new indicator is created to measure the product circularity that takes the disassembly process and the product complexity into consideration when calculating product circularity.
This research contributes to the implementation of the circular economy, an important tool to reach the sustainable development goals. A literature review in the area of circular economy, circularity indicators and the other tools used to measure the circularity are investigated. In addition, a review was done on the complexity of the product and the different methods used to measure the complexity of disassembly. Some methods study the complexity of a product only from the point view of handling and removing of components other methods use time of disassembly or sequence of disassembly as an indicator for the complexity of a product. But no method studied the effect of complexity of the product on the efficiency of recycling by taking the profitability of the recycling into consideration.
Research Keywords
Circular Economy, Sustainable Development, Product Design for circular economy, Remanufacturing and De-manufacturing, Circularity Indicator, and Product Complexity
The research was done using different search engines such as Google, Google scholar and Scopus. In addition to looking at other websites of the big business consulting companies such as Boston Consulting Group (BCG) and McKinsey& Co. (2014)in order to understand their vision, their projects and approach in implementing the sustainability and circular economy concepts.
1.2.
Motivation
3
has a significant impact on the environment that we live in since waste that humans generate pollutes the land, air, and water that is essential for human life.
Recycling considered one good way to reduce the impact of this waste, where this process will ensure collecting and processing materials that would otherwise be discarded as trash and turning them into new products. (Xia, Gao, Wang, Li, & Chao, 2015) . It is obvious that the amount of resources required to recycle a material is less than the amount used for creating new material. For example, recycling aluminum uses only 5% of the energy required by virgin production (The Aluminum Association,2011). In spite of the benefits of recycling, only 34% of the solid waste generated in the U.S was recycled in 2014 (Beck, 2016). This ratio could increase if product designers had a tool that would enable them to determine the recyclability indices of design concepts early in the design process.
1.3.
Research Objectives
The overall objectives of this research are:
To investigate the methodologies, tools and indicators used to measure the circularity of a product and come up with an indicator that takes the complexity of the product into consideration.
To find the effect of product complexity on product circularity by taking different factors into consideration such as the time of disassembly, purity and profitability of recycling.
To Create a conceptual management tool and design a new Indicator that takes the disassembly process into consideration
1.4.
Research Scope:
This research focuses on the circular economy and the different indicators and tools used to measure the product circularity. The complexity of a product and the methods used to measure it are further investigated by understanding the different ways of measuring the complexity of a specific product and how the product complexity could impact the product circularity.
Some terminology and concepts will be included, such as Design for Disassembly (DFD), Design for Assembly (DFA), and design for Recycling (DFR). In addition to explaining in depth the recyclability indices, such as the material recyclability index that is related to a specific material, some methods used for measuring will be included.
4
management tool and design a new indicator that takes the disassembly process into consideration, this tool is represented by an excel sheet at the end of discussion section. Finally, the conclusions and future work are presented.
1.5.
Research Gaps and Novelty:
By looking at the different indicators used to measure the circularity, the Material Circularity Indicator (MCI) is one of the indicators that are interesting to investigate more since it is the only one found to measure the amount of the material recycled. However, this indicator does not explain the impact of the complexity of the product on the material circularity indicator.
Literature review on the product complexity is performed in order to understand the meaning of product complexity and how to measure it. Different ways were found to interpret the product complexity and ease of disassembly. One method chosen was through calculating the profit behind disassembling and recycling the materials of a specific product, where the time of disassembly and cost of disassembly in addition to the reclamation value of each material is considered the main factors affecting the decision of recycling.
A novel method to calculate the circularity indicator is proposed here where the recycling efficiency of the product is considered dependent on the product complexity and the later one assumed to be defined by the easy of disassembly and the time required for disassembly by taking the profitability of disassembly into consideration to decide to recycle or not.
The significance of the proposed research has three important aspects: First, understanding how the profitability of disassembly of a product is measured. Second calculating the recycling efficiency of the whole product based on the outcome of the decision made in phase one then finally to measure the product circularity based on the calculated recycling efficiency through using the material circularity indicator.
1.6.
Research Plan
The introduced research approach follows a framework which consists of three levels.
1. At the first level, different definitions of the circular economy will be included then a more in-depth analysis will be performed on the different levels of circular economy, its mechanism and different strategies/ business models. Finally, three different indicators used to measure the product circularity will be investigated.
5
3. The third level will be finding the relationship between product complexity and product circularity, then designing a new tool to measure the product complexity base on first calculating the profitability of disassembly and recycling
6
1.7.
Thesis Hypothesis
7
CHAPTER 2-THE CIRCULAR ECONOMY (CE)
Following will be a literature review on different terminologies and concepts that are related to the concept of circular economy, different definitions of circular economy will follow then the relation between the circular economy and sustainable development will be investigated next by understanding how it contributes to the sustainable development concept. After that a research on the levels of implementation will be performed, in addition to the tools and different circularity indicators used to measure the circularity of a product.
2.1.
CE Definitions
Different definitions were found related to the circular economy concept, how did this concept develop and evolve, what are the early signs of this movement and its contribution to the sustainable development movement. All these questions will be answered in the next sections
The circular economy cannot be tracked back to one single date or author, (Tolio et al., 2017) but rather to several schools of thoughts, some of those are: the theory of “Regenerative design” by lyle in late seventies which explains that the concept of resource regeneration can be implemented and included as part of sustainable development concept (Lyle, 1996). Also Stahel was one of the pioneers in introducing the economic basis for a transition to a non-linear industrial model.(Stahel & Reday-Mulvey, 1981) then after that the idea of “Cradle-to-Cradle” design was reformed, a concept where the idea of an efficient and waste free systems is the ultimate goal in an economic, industrial and social framework.
Different definitions were found, some were adapted by policy makers and business advocacy bodies such as the Ellen MacArthur Foundation (EMF). In addition to other definitions found using variety of keywords searching different engines such as Google, Google scholar and Scopus as follows:
“The CE has been defined as an industrial system that is restorative or regenerative by intention and design. It replaces the end-of-life concept with restoration, shifts towards the use of renewable energy, eliminates the use of toxic chemicals, which impair reuse and return to the biosphere, and aims for the elimination of waste through the superior design of materials, products, systems and business models.” (Hobson, 2016)
The concept of circular economy (CE) is simply represented by shifting our way of thinking from the linear thinking of take-make-use-dispose linear pattern of production and
consumption, to a circular system in which the value of products, materials and resources is
maintained in use as long as possible.
Different definitions of CE were adopted and overlapped with other terminologies based on a collection of ideas derived from a variety of scientific disciplines and semi scientific concepts
.
8
In ecological economics, which has a long tradition in recycling and its related issues as defined by (Georgescu-Roegen, 1971; Daly, 1996; Ring, 1997; Boulding, 1966; Ayres, 1999) aims to improve and expand economic theory to integrate the earth's natural systems, human values and human health and well-being. (Korhonen et al., 2018)
CE also takes part in other research streams, include industrial ecosystems as defined by (Jelinski et al., 1992) and industrial symbioses (Chertow and Ehrenfeld, 2012), cleaner production (Ghisellini, Cialani, and Ulgiati, 2016); Lieder and Rashid, 2016; Stevenson and Evans, 2004), product service systems (Tukker, 2015), eco-efficiency (Huppes and Ishikawa, 2009; Haas et al., 2015 ; Welford, 1998), cradle-to-cradle design (Braungart et al., 2007); McDonough and Braungart, 2003) , biomimicry (Benyus, 2002) resilience of social-ecological systems (Folke, 2006; Crepin et al., 2012), the performance economy (Stahel, 2010; EMAF, 2013), natural capitalism (Hawken et al., 2008 ), the concept of zero emissions (Pauli, 2010) and others (Korhonen et al., 2018)
2.2.
CE Contribution to Sustainable Development
This section will discuss the contribution of circular economy concept to the bigger concept of sustainable development which is a concept that has a huge impact on the human’s well being through its effect on the three pillars of sustainability.
Figure 2.1 Sustainable Development Pillars (thwink, 2014)
The positive contribution to the environment as well as the economic and the social aspect of the sustainable development can be seen where the economic development is conducted without depletion of natural resources and by thinking not only in this generation, but also the next generation as we can see from the definition of sustainable development “it is the development that meets the needs of the present without compromising the ability of future generations to meet their own needs”(Suárez-Eiroa, Fernández, Méndez-Martínez, & Soto-Oñate, 2019).
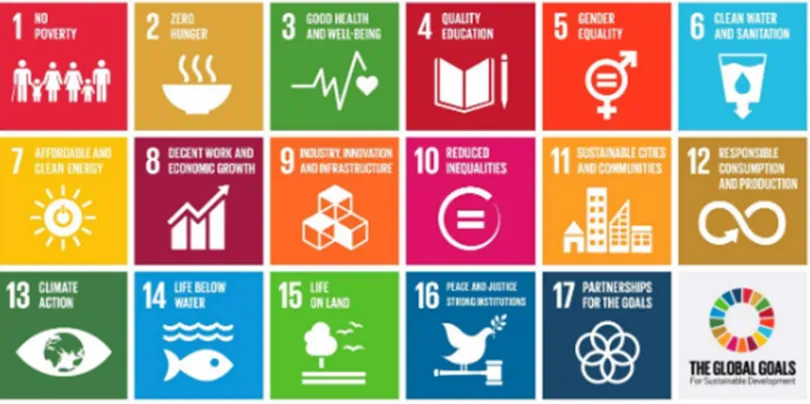
9 2.2.1. Sustainable Development Goals
The Sustainable Development Goals are a UN Initiative, the Sustainable Development Goals (SDGs), Global Goals for Sustainable Development, 17 Global Goals, Global Goals or simply the Goals are a collection of 17 global goals set by the United Nations General Assembly in 2015. The SDGs are part of Resolution 70/1 of the United Nations General Assembly "Transforming our World: the 2030 Agenda for Sustainable Development". That has been shortened to "2030 Agenda". These are broad and interdependent goals, yet each has a separate list of targets to achieve. Achieving all 169 targets would signal accomplishing all 17 goals. The SDGs build on the principles agreed upon in Resolution entitled "The Future We Want" a non-binding document released as a result of Rio + 20 Conference held in 2012 (Schroeder, Anggraeni, & Weber, 2019)
Figure 2.2 The 17 Sustainable Development Goals (World Bank, 2015)
The SDGs cover social and economic development issues including:
1. No Poverty: the end of poverty in all its forms everywhere.
2. Zero hunger: "End hunger, achieve food security and improved nutrition, and promote sustainable agriculture"
3. Good health and well-being for people: ensure healthy lives and promote well-being for all at all ages.
4. Quality education: "Ensure inclusive and equitable quality education and promote lifelong learning opportunities for all.
5. Gender equality: Achieve gender equality and empower all women and girls.
6. Clean water and sanitation: "Ensure availability and sustainable management of water and sanitation for all.
7. Affordable and clean energy: Ensure access to affordable, reliable, sustainable and modern energy for all.
10
9. Industry, Innovation, and Infrastructure: Build resilient infrastructure, promote inclusive and sustainable industrialization, and foster innovation.
10. Reducing inequalities: Reduce income inequality within and among countries. 11. Sustainable cities and communities: Make cities and human settlements inclusive,
safe, resilient, and sustainable.
12. Responsible consumption and production: "Ensure sustainable consumption and production patterns.
13. Climate action: "Take urgent action to combat climate change and its impacts by regulating emissions and promoting developments in renewable energy.
14. Life below water: Conserve and sustainably use the oceans, seas and marine resources for sustainable development.
15. Life on land: Protect, restore and promote sustainable use of terrestrial ecosystems, sustainably manage forests, combat desertification, and halt and reverse land degradation and halt biodiversity loss.
16. Peace, justice and strong institutions: Promote peaceful and inclusive societies for sustainable development, provide access to justice for all and build effective, accountable and inclusive institutions at all levels.
17. Partnerships for the goals: Strengthen the means of implementation and revitalize the global partnership for sustainable development.
By matching circular economy practices with the sustainable development goals, we notice that the implementation of the circular economy with its operational principles in fact serve the above SD goals and, potentially, can contribute directly to achieving a significant number of SDG targets. Specifically, goal number twelve “responsible consumption and production”, where the circular economy’s aim is to make the producer and consumer more aware of utilizing the different products and keeping it in use in a more efficient way as well as extending its life time.
11
2.2.2. The Social Pillar of Sustainable Development
The Social pillar of sustainable development deals directly with the human being rights such as “social equity, livability, health equity, community development, social capital, social support, human rights, labour rights, placemaking, social responsibility, social justice, cultural competence, community resilience, and human adaptation” (Yugendar, 2014). A second, more recent, approach suggests that all the domains of sustainability are social: including ecological, economic, political and cultural sustainability. We can see the social pillar of sustainable development reflected in most of the sustainable development goals set by the United Nations, this set of goals is investigated to measure the social pillar of sustainable development where the ultimate goal is a better standard of living and human rights to live a decent life without any kind of discrimination.
2.2.3. The Environmental Pillar of Sustainable development
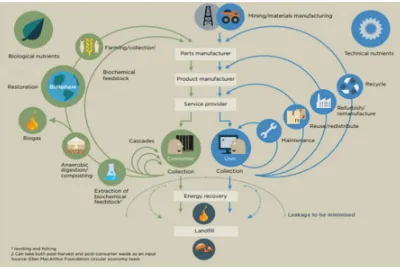
The Environmental aspect of the sustainable development can be defined as a state in which the demand placed on the environment can be met without reducing its capacity to allow all people to live well, now and in the future. In order to reach this state, we should make sure that the amount of resources used does not exceed the amount of resources we have so that the environment can cope with the demand. Not all the resources are renewable as we can see from Figure (2.3) The Butterfly Diagram explains two types of waste, the Biological and the Technical Waste.
It is important to distinguish between the two types of outputs: biological wastes and technical wastes as mentioned by Ellen MacArthur Foundation. Biological wastes are biodegradable compounds flowing through biogeochemical cycles that will eventually be reconverted into natural capital. On the other hand, there are the technological wastes that are not biodegradable, this kind of wastes require a process of human transformation in order to be reintroduced into the economic system again. Hence technical wastes need to be minimized, or even eliminated, a conclusion that can be also drawn from the conceptual model for CE described by Ellen MacArthur Foundation (Ellen MacArthur Foundation, 2015a)
Technical materials, such as metals, plastics and fossil fuels are finite and cannot be renewed, from here comes the importance to manage properly using them. Through focusing on value retention, Materials are recovered from residual streams after use through the technical cycle. While the biological materials such as food, water, cotton and other biological waste can be taken back into the ecosystem by means of biological processes, it is important to ensure that the ecosystem and biological processes are enabled to function properly as long as the materials flows are not contaminated with toxic substances and the ecosystem are balanced theses biological materials are renewed.
The following figure explains the two types of waste output and the different loops used to process the industrial waste and return it back to the system again.
12
Figure 2.3 The Butterfly Diagram (Ellen MacArthur Foundation, 2015a)
2.2.4. The Economic Pillar of Sustainable development
The economic pillar includes a broad array of issues, from trade and investment to employment growth and private sector development. Economic policy-making takes into consideration both domestic and international trends and assets and develops a mix of instruments that include, among others, tax policy, public-private partnerships, trade and employment policies, national and international finance, etc.
There is a strong relation between the economic pillar and the sustainable development goals. Poverty eradication or alleviation, decent and productive jobs; employment creation; security of jobs versus contract labour without benefits; income inequality; local economic development all these issues are related strongly to the sustainable development goals
Several SDG (Sustainable Development Goals) reflects how the economic pillar of sustainable development has a direct impact on the humans’ rights, such as: SDG 1: End poverty in all its forms everywhere SDG 8: Promote sustained, inclusive and sustainable economic growth, full and productive employment and decent work for all SDG 10: Reduce inequality within and among countries
13
expected to be depleted within the next 5–50 years (Lieder & Rashid, 2016). The prices of these metals are expected to increase, in fact, commodity prices rose overall by almost 150% in 2002-2010. In addition to the fact of a growing population that is expected to reach 9 billion by 2013. From here comes the importance to emphasize on rethinking the way society uses material and the importance to shift from the linear economy to the circular economy.
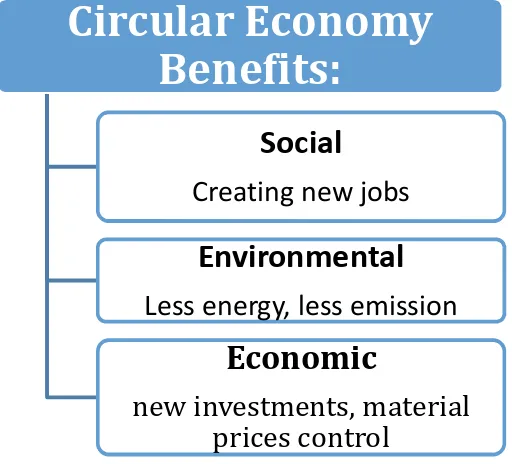
From the above we can understand how the circular economy can contribute to the
implementation of the sustainable development concept. By shifting to the Circular Economy thinking new jobs will be generated, huge investments will be created, and little waste will be produced to the environment, where the output from ecosystem can be balanced with the input.
Figure 2.4 The Circular Economy Benefit
2.3.
CE Principles and Fundamental Characteristics
Circular Economy (CE) is a concept, aims to overcome the take-make-dispose linear pattern of production and consumption, proposing a circular system in which the value of products, materials and resources is maintained in use as long as possible (Ellen MacArthur Foundation, 2015a).
In the next sections we take a close look at the (Circular Economy) concept, the levels of implementation as well as the different loops of circular economy then the different methodologies, tools and indicators used to measure the circularity. A close search was done particularly to find the circularity indicators used to measure the circularity of a product in different industries.
Circular Economy
Benefits:
Social
Creating new jobs
Environmental
Less energy, less emission
Economic
14
One of the interesting methodologies was the one proposed by Ellen MacArthur Foundation, a foundation launched in 2010 its main goal is to accelerate the transition towards the circular economy. In 2015 the Ellen Mac Arthur Foundation collaborated with other companies such as Granta Design and other firms to launch a project in order to come up with a way of measuring how effective a company is in making the transition from ‘linear’ to ‘circular’ models. This project or methodology aims to develop indexes consist of a main indicator, known by the Material Circularity Indicator (MCI), measuring how restorative the material flows of a product or company are, and complementary indicators that allow additional impacts and risks factors to be taken into consideration.
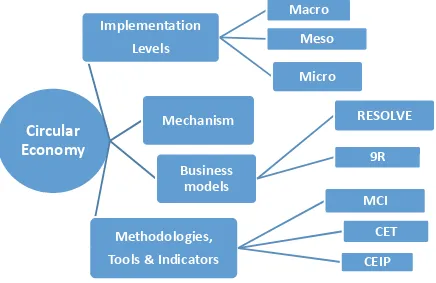
Figure 2.5 CE Characteristics
Circular
Economy
Implementation
Levels
Macro
Meso
Micro
Mechanism
Business
models
RESOLVE
9R
Methodologies,
Tools & Indicators
MCI
CET
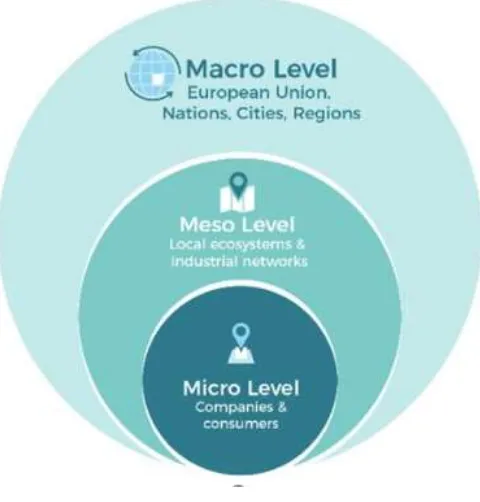
15 2.3.1. Implementation Levels of (CE)
Balanay and Halog mentioned three systematic levels of implantation for the circular economy: the Macro which refers to the city, province, region, nation, the Meso level fits with eco-industrial parks, while the Micro level corresponds to single company or consumer (Balanay & Halog, 2016).
Figure 2.6 Levels of Implementation of CE (Balanay & Halog, 2016)
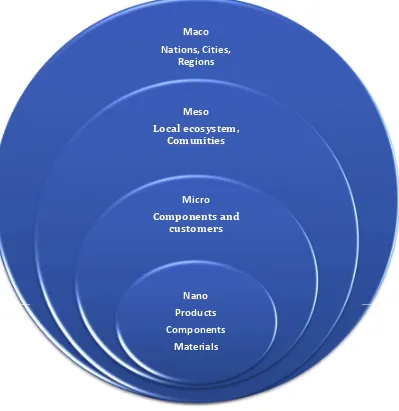
16
Figure 2.7 Level of Implementation of CE suggested by (Saidani et al., 2017)
Maco Nations, Cities,
Regions
Meso
Local ecosystem, Comunities
Micro
Components and customers
Nano Products Components
17
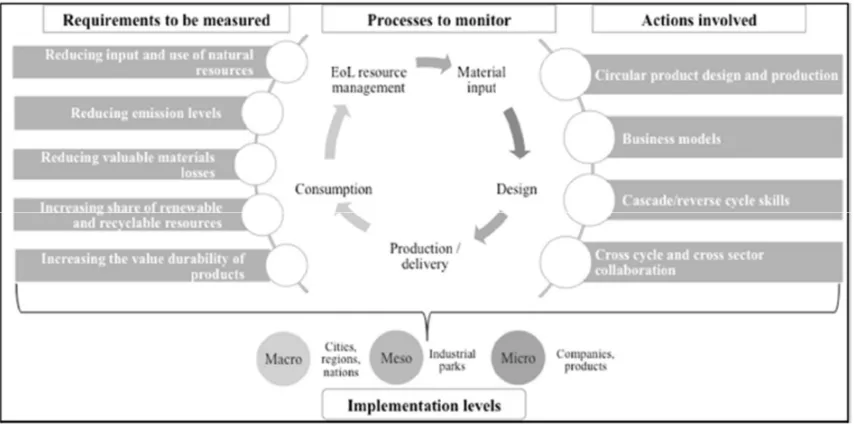
From the previous discussion, different levels of implementation can be found and for each level there are different approaches and business models applied to implement the concept. Figure (2.8) illustrate some of those approaches, next section will be explaining the different business models.
Figure 2.8 CE Implementation Levels (Macro, Meso, Micro) (Elia, Gnoni, & Tornese, 2017)
2.3.2. Business models / Strategies of Circular Economy implementation
Circular business models represent fundamentally different ways of producing and consuming goods and services. They have the potential to drive the transition towards a more resource efficient and circular economy. These models include recycling, reuse, and repair, Product Service System (PSS) which is the provision of access to products, rather than ownership of them.
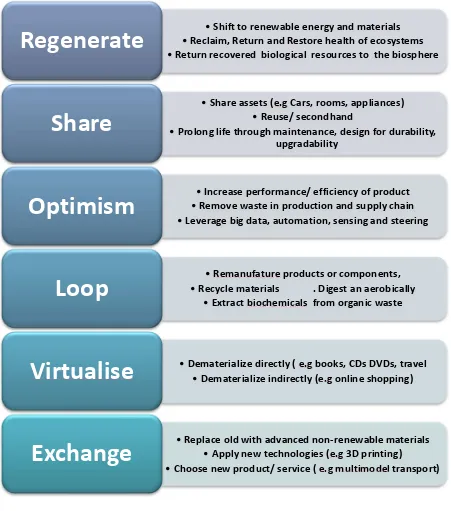
Business Models: ReSOLVE framework by Ellen MacArthur Foundation
18
Figure 2.9 ReSOLVE framework– (Ellen MacArthur Foundation, 2015b) •Shift to renewable energy and materials
•Reclaim, Return and Restore health of ecosystems
•Return recovered biological resources to the biosphere
Regenerate
•Share assets (e.g Cars, rooms, appliances)
•Reuse/ secondhand
•Prolong life through maintenance, design for durability, upgradability
Share
•Increase performance/ efficiency of product
•Remove waste in production and supply chain
•Leverage big data, automation, sensing and steering
Optimism
•Remanufature products or components,
•Recycle materials . Digest an aerobically
•Extract biochemicals from organic waste
Loop
•Dematerialize directly ( e.g books, CDs DVDs, travel
•Dematerialize indirectly (e.g online shopping)
Virtualise
•Replace old with advanced non-renewable materials
•Apply new technologies (e.g 3D printing)
•Choose new product/ service ( e.g multimodel transport)
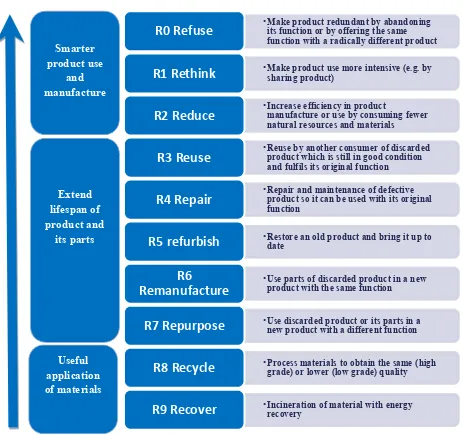
19 Business Models: 9R framework
Another framework is the 9R that can be explained in Figure 2.10.
Figure 2.10 The 9R Framework (Potting, Hekkert, Worrell, & Hanemaaijer, 2017) Circular Economy Smarter product use and manufacture Extend lifespan of product and its parts Strategies
•Make product redundant by abandoning its function or by offering the same function with a radically different product
R0 Refuse
•Make product use more intensive (e.g. by sharing product)
R1 Rethink
•Increase efficiency in product
manufacture or use by consuming fewer natural resources and materials
R2 Reduce
•Reuse by another consumer of discarded product which is still in good condition and fulfils its original function
R3 Reuse
•Repair and maintenance of defective product so it can be used with its original function
R4 Repair
•Restore an old product and bring it up to date
R5 refurbish
•Use parts of discarded product in a new product with the same function
R6
Remanufacture
•Use discarded product or its parts in a new product with a different function
R7 Repurpose
•Process materials to obtain the same (high grade) or lower (low grade) quality
R8 Recycle
•Incineration of material with energy recovery
R9 Recover
20 2.3.3. Mechanism of Circular Economy
As far as the mechanism of circular economy, Tolio et al, identify four different mechanisms for value creation in Circular Economy that offer opportunities compared to the linear usage
(Tolio et al., 2017) , it is described below as:
1. The power of inner circle: the closer the product gets to direct reuse, i.e., the perpetuation of its original purpose, the larger the cost savings will be in terms of material, labour, energy, capital and the associated externalities.
2. The value of circling longer: value created by keeping products, components, and materials in use longer within the Circular Economy. This can be achieved by enabling more cycles or by spending more time within a single cycle.
3. The power of cascaded use: value created by using discarded materials from one value chain as by-products, replacing virgin material in another.
4. The power of pure circles: uncontaminated material streams increase collection and redistribution efficiency while maintaining quality.
Another approach to restore and recovery from physical product point view can be recognized by looking back into Figure 2.3 that illustrates the butterfly Diagram proposed by Ellen Mac Arthur Foundation, two main paths can be recognized one is the biological cycle and the other is known by the technical cycle. In the technical cycle four different cycles to restore the technical materials are noticed (four sources of value creation), these cycles are explained below from the inner cycle to the outer one:
Repair and maintenance: Restoring products during use to extend the lifespan of products
Reuse and Redistribution: Direct reuse through product reuse or sales.
Refurbish & Remanufacture: The thorough renovation and repair of product by the manufacturer.
21
Figure 2.11 Four sources of value creation- (Ellen MacArthur Foundation, 2013)
2.4.
Methodologies and indicators used to measure CE
Literature review on different Product Circularity Indicators proposed by different resources was performed to find out how to measure the circularity of a product, process and a system. In order to do that, different methodologies were investigated to find out how to measure the circularity of a product which represents the micro level in the implementation of circular economy concept.
Three different tools or indicators were found. The first tool is the Circular Economy Toolkit (CET), the second tool is the Circular Economy Indicator Prototype (CEIP) and finally the methodology proposed by Ellen Mac Arthur Foundation, a methodology used to assess the circularity of products. This methodology uses an indicator called by the Material Circularity Indicator (MCI) in combination with complementary indicators to identify relevant risks and impacts, these complementary indicators know by Complementary risk indicators and Complementary impact indicators.
2.4.1. Circular Economy Toolkit (CET):
It’s a free online tool offered for different businesses to help find opportunity in circular economy in order to enhance the circularity of their businesses. This tool divided into seven
Recycle
Refurbish and
Remanufacture
Reuse and
Redistribute
Repair and
maintenance
• Parts or materials are recovered from the product to use them again
• The thorough renovation and repair of product by the manufacturer
• Direct reuse through product reuse or sales.
22
areas of improvement (Design Manufacture and Distribution, Usage, Maintenance/repair , Reuse/ redistribute, refurbish/remanufacture, product recycling and finally products as a service) it consists of answering - in a trinary format (yes/partly/no or high/medium/low) -33 questions divided into 7 sub-categories, similarity to the lifecycle stages considered in an environmental qualitative assessment: 7 questions related to design, manufacture and distribute; 3 related to usage; 6 related to maintenance and repair of the product; 3 related to reuse and redistribution of the product; 10 related to refurbish and remanufacture; 2 related to product-as-a-service; 2 related to product recycling at end-of-life. (Saidani et al., 2017)
The main advantage of this tool is that it considers both business opportunity and product design in the qualitative assessment, where it assesses business opportunities (including financial viability and market growth potential), also this tools considered user friendly and easy to understand even for non-expert in circular economy. (Saidani et al., 2017)
Limitation of this tool:
23
Figure 2.12 Circular Economy Toolkit (Circular Economy Toolkit, n.d.)
2.4.2. Circular Economy Indicator Prototype (CEIP)
24
diagram showing circularity performance across different parts of the life cycle. (Saidani et al., 2017)
The CEIP is initially intended to be used by manufacturing and/or retail companies of tangible goods with access to bill of materials. They would use the CEIP to measure and evaluate the performance of their products against the EMF CE principles
Limitation of this tool:
The Circular Economy Indicator Prototype (CEIP) interpretation through a single score hides the true circular economy complexity. The binary scoring system used for some questions could be quite reductive for some questions. Authors of the CEIP (Griffiths & Cayzer, 2016) acknowledge a superficial commitment with decision-makers and that the reliability of the questionnaire is based on the case study specific context: the 15 questions are mainly focused on the manufacturing and end-of-life stages of the product lifecycle, and therefore neglect certainly other circular economy crucial aspects. Several attributes suitable to move towards an efficient circular economy of products are not taken into account such as, modularity, design for disassembly, upgradability, used of new technology or connected devices: for instance, sensors to enable product traceability.(Saidani et al., 2017)
25
2.4.3. Circularity Indicators by Ellen Mac Arthur Foundation
The Circularity Indicators developed by The Ellen MacArthur Foundation are indicators that assess how well a product or company performs in the context of a circular economy, thereby allowing companies to estimate how advanced they are on their journey from linear to circular (Ellen MacArthur Foundation, 2015a). These indicators can be used as decision-making tool for designers, in addition to several other purposes including internal reporting, procurement decisions and the evaluation or rating of companies.
26
Figure 2.14 MCI- Dynamic Modeling Tool
(Ellen MacArthur Foundation, 2015c)
2.5
The Ellen MacArthur Methodology (In depth approach)
27
The Ellen MacArthur Foundation was founded in 2010 and works in education, business and insight and analysis to accelerate the transition to a circular economy. While Granta Design, is the world leader in materials information technology. Their software tools, materials data and materials database solutions help engineering enterprises to manage vital materials data, enable better materials decisions, design for environmental objectives and regulations, and provide materials support for engineering design, analysis and simulation.
This methodology focuses exclusively on technical cycles and materials from non-renewable sources, where the developed indexes consist of a main indicator, the Material Circularity Indicator (MCI), measuring how restorative the material flows of a product or company are, and complementary indicators that allow additional impacts and risks to be taken into consideration.
Material Circularity Indicator (MCI)
The Material Circularity Indicator (MCI) is an indicator that measures how restorative the material flows of a product or a company is, it is used to measure the extent to which linear flow has been minimized and restorative flow maximized for its component materials and how long and intensively a product is used compared to a similar industry-average product.
The MCI is essentially constructed from a combination of three product characteristics: the mass
𝑽of virgin raw material used in manufacture, the mass 𝑾of unrecoverable waste that is attributed to the product and a utility factor 𝑿 that accounts for the length and intensity of the product's use.
Any product that is manufactured using only virgin feedstock and ends up in landfill at the end of its use phase can be considered a fully ‘linear’ product. On the other hand, any product that contains no virgin feedstock is completely collected for recycling or component reuse and where the recycling efficiency is 100% can be considered a fully ‘circular’ product. In practice, most products will sit somewhere between these two extremes and the MCI measures the level of circularity in the range 0 to 1. “MCI is an indicator that provides an indication of how much a product's materials circulate, it neither takes into account what these materials are, nor does it provide information on other impacts”. (Ellen MacArthur Foundation, 2015a).
This indicator can be used in the design of new products to take circularity into account as an input for design decisions, where many aspects of product design can influence the circularity scores range from material choices to new business models for the product. In addition to that these indicators can be used for internal reporting purposes were companies can compare different products regarding their circularity and capture the benefit related to raw material price savings as those allow these organizations to use the indicator as part of their procurement decisions, for example, by defining a minimum threshold for the products they buy. (Ellen MacArthur Foundation, 2015a).
The Material Circularity Indicator (MCI) developed in this methodology focuses on the restoration of material flows at product and company levels and is based on the following four principles:
i) using feedstock from reused or recycled sources – Feedstock reuse and recycle ii) reusing components or recycling materials after the use of the product- Post use
28
iii) keeping products in use longer (e.g., by reuse/redistribution) – Product life
iv) making more intensive use of products (e.g. via service or performance models)- Product utility
The lifetime and Utility of a product
A product is considered more circular if it is used longer, even if it is land filled after its use. Circular Economy is all about the initiatives that can create an important impact in materials use. In fact, an increased serviceable life or higher usage intensity leads to substantial materials savings. Longer serviceable lives also enable the creation of repair, reuse and/or resale (e.g. refillable products or second-hand shops) and are therefore well suited to the idea of increased circularity and correspond to inner, short cycles. ((Ellen MacArthur Foundation, 2015a).
In the development of the MCI the proportion of the product being restored (through component reuse and recycling, (either feedstock or post used recycled or reused materials) and coming from reused or recycled sources is described as the restorative part of the flow, while the linear part of the flow is the proportion coming from virgin materials and ending up as landfill (or energy recovery).
The product life extension and product utilization mentioned above are treated as improvements on the utility of a product and considered as additional component in the derivation of the MCI that depends on the linear part of the flow.
As part of the project, the Ellen MacArthur Foundation has provided an easy to use Excel-based model (Dynamic Modeling Tool) as can be seen from Figure 2.12. It is used to illustrate the functioning of the methodology on the product level. This is downloadable from the Circularity Indicator Project website (Ellen MacArthur Foundation, 2015c).
While the MCI provides an indication of how much a product's materials circulate, it neither takes into consideration what these materials are, nor does it provide information on other impacts of the product which makes it a general indicator. As additional support to decision making, this methodology recommends an approach to prioritize product improvements by using the MCI in combination with other complementary indicators to identify relevant risks and impacts, these indicators are described next.
Complimentary Indicators
There are two complimentary indicators used in the Ellen MacArthur foundation in addition to the material circularity indicator known by, the risk and the impact indicators:
1. Complementary risk indicators: an indication on the urgency of implementing circular practices which are related to the drivers for change from the current linear model. These include, measures of Material scarcity (which has a substantial impact on the value of recovering the materials), Material Price Variation Risk, Material Supply Chain Risks, in addition to a Measure of toxicity (which impacts the risks and costs of manufacture reverse logistics and public safety liabilities).
29 Assumptions and Limitations:
The model of this methodology has been built on the following assumptions (Ellen MacArthur Foundation, 2015a):
1. The indicator does not explicitly favour closed loops. For example, that material recovered for recycling does not need to return to the original manufacturer.
2. It is assumed that recovered material at the end of use can be processed to a similar quality as the original virgin material.
3. It is assumed that there are no material losses in preparing collected products for reuse.
4. It is assumed that all material is cycled in technical cycles; biological cycles are not taken into consideration.
30
2.5.1. Terminology used in this methodology:
Following are some definitions of principal terms and variables used by Ellen MacArthur foundation to measure the circularity of a product.
Table 2.1 Terminologies used in CE (Ellen MacArthur Foundation, 2015a).
Term Definition
1 Biological cycles
In biological cycles, non-toxic materials are restored into the biosphere while rebuilding natural capital, after being cascaded into different applications.
2 Technical cycles
In technical cycles, products, components and materials are restored into the market at the highest possible quality and for as long as possible, through repair and maintenance, reuse,
refurbishment, remanufacture, and ultimately recycling
3 Biosphere
The biosphere denotes the global sum of all ecosystems on the planet, including all life forms and their environment. This corresponds to a thin layer of the earth and its atmosphere – extending to about 20 km
4 Natural capital
Natural Capital can be defined as the earth's stocks of natural assets, which include geology, soil, air, water and all living things
5 economy Linear
A linear economy consists of ‘take, make, dispose’ industrial processes and associated lifestyles resulting in a depletion of finite reserves. Virgin materials are used to create products that end up in landfills or incinerators.
6 economy Circular
A circular economy is a global economic model that decouples economic growth and development from the consumption of finite resources. It is restorative by design, and aims to keep products, components and materials at their highest utility and value, at all times.
7
Life cycle assessment
(LCA)
LCA is a technique to assess the environmental aspects and potential impacts associated with a product, process, or service. It is derived by compiling an inventory of relevant energy and material inputs and environmental releases and evaluating the potential environmental impacts associated with identified inputs and releases
8 Service model
31
Table 2.2 Terms and variables used to measure product circularity ( Ellen MacArthur Foundation, 2015a)
Term Definition
1 Virgin material Material that has not been previously used or consumed, or subjected to processing other than for its original production
2 Feedstock
Feedstock is anything used to produce a new product. This in particular includes raw materials (from either virgin or recycled sources) but can also include components from old products used in a new product.
3 Linear flow The linear part of the material flow of a product is the part that comes from virgin materials and ends up as landfill (or energy recovery)
4 Closed loop
In a closed loop, used products come back to the original manufacturer and components or materials are used again to produce new products of the same type.
5 Restorative flow
The restorative part of the material flow of a product is the proportion that comes from reused or recycled sources and is restored through reuse or recycling.
6 Reuse
To reuse a product is to reintroduce it for the same purpose and in its original form, following minimal maintenance and cosmetic cleaning. Within this methodology, this is considered via an increase of the product’s utility (lifetime or functional units). If a product cannot be reused as a whole, individual components can be reused in a functional way. Within this methodology this is considered through the fraction 𝑭𝑼 of the mass of feedstock for the product from reused sources and the fraction 𝑪𝑼of mass of the
product going into component reuse
7 Refurbishment
Refurbishment is the process of returning a product to good working condition by replacing or repairing major components that are faulty or close to failure and making cosmetic changes to update the appearance of a product, such as changing fabric or painting
8 Remanufacture
Remanufacture denotes the process of disassembly and recovery at the sub-assembly or component level. Functioning, reusable parts are taken out of a used product and rebuilt into a new one. This process includes quality assurance and potential
enhancements or changes to the components.
9 Recycling
Recycling is the process of recovering materials for the original purpose or for other purposes. The materials recovered feed back into the process as crude feedstock. Recycling excludes energy recovery
10 Upcycling Upcycling denotes a process of converting materials into new materials of higher quality and increased functionality
11 Downcycling Downcycling is a process converting materials into new materials of lesser quality and reduced functionality.
32
Term Definition
13 Use phase
The use phase of a product starts when it reaches its first users and ends when it is not reused any more as a whole. After the use phase, components can be reused and the rest of the product can go into recycling, energy recovery or landfill
14
Material Circularity
Indicator
The main indicator developed in this methodology. It assigns a score between 0 and 1 to a product (or company) assessing how restorative or linear the flow of the materials for the product (or the company’s products) and how long and intensely the product (or the company’s products) is used compared to similar industry-average products
15 Fully linear product
A product is called fully linear if it is made purely from virgin material and it completely goes into landfill or energy recovery after its use, that is, LFI = 1.
16 Total mass flow
The total mass flow for a product is derived as the sum of the amounts of material flowing in a linear and a restorative fashion.
17 Unrecovered waste
Unrecoverable waste includes waste going to landfill, waste to energy and any other type of process after the use of a product where the materials are no longer recoverable
18 Functional unit
is a measure of the product’s use. For example, it could be one kilometer driven for a car, or one wash cycle for a washing machine
19 Utility
The utility of a product measures how long and intensely it is used compared to an average product of the same type. The utility is derived from the lifetime and functional units of a product (compared to an industry-average product of the same type)
20 impact indicators Complementary
The complementary impact indicators described in this
methodology are designed to give an indication of some of the benefits of circular models. For example, they include measure of the energy and water impacts of a given setup
21 Complementary risk indicators
The complementary risk indicators described in this methodology give an indication on the urgency of
implementing circular practices. These are related to the drivers for a change from the current linear model and include
measurements for material scarcity or toxicity.
22 Sub-assembly A unit assembled separately but designed to be incorporated with other units into a larger manufactured product.
23 Component In general, a component is part or element of a larger whole, for example, a product, especially a part of a machine or vehicle.
24 Component reuse
33
Table 2.3 Symbols used in calculating the MCI (E MacArthur, 2015)
Symbol Definition
1 𝑴 Mass of a product
2 𝑭𝑹 Fraction of mass of a product’s feedstock from recycled sources
3 𝑭𝑼 Fraction of mass of a product’s feedstock from reused sources
4 𝑽 Mass of virgin feedstock used in a product
5 𝑪𝑹 Fraction of mass of a product being collected to go into a recycling process
6 𝑪𝑼 Fraction of mass of a product going into component reuse
7 𝑬𝑪
Efficiency of the recycling process used for the portion of a product collected for recycling
8 𝑬𝑭
Efficiency of the recycling process used to produce recycled feedstock for a product
9 𝑾 Mass of unrecoverable waste associated with a product
10 𝑾𝟎
Mass of unrecoverable waste through a product’s material going into landfill, waste to energy and any other type of process where the materials are no longer recoverable
11 𝑾𝑪
Mass of unrecoverable waste generated in the process of recycling parts of a product
12 𝑾𝑭
Mass of unrecoverable waste generated when producing recycled feedstock for a product
13 𝑳𝑭𝑰 Linear Flow Index
14 𝑭(𝑿) Utility factor built as a function of the utility 𝑿 of a product
15 𝑿 Utility of a product
16 𝑳 Actual average lifetime of a product
17 𝑳𝒂𝒗 Actual average lifetime of type an industry-average product of the same
18 𝑼
Actual average number of functional units achieved during the use phase of a product
19 𝑼𝒂𝒗
Actual average number of functional units achieved during the use phase of an industry-average product of the same type
34
2.5.2. Calculation of Material Circularity Indicator
The following figure explains the flow diagram for a product from the cradle to the crave based on Ellen MacArthur foundation methodology
35
Figure 2.16 Material flow showing symbols used (Ellen MacArthur Foundation, 2015a).
Following are the equations used by Ellen MacArthur Foundation to calculate the Material Circularity Indicator (MCI):
1- Calculating Virgin Feedstock:
𝑽 = 𝑴(𝟏 − 𝑭𝑹− 𝑭𝑼) (𝟐. 𝟏) 𝑴 : is the mass of the finished product
𝑭𝑹: is the fraction of feedstock derived from recycled sources 𝑭𝑼: is the fraction from reused sources
2- Calculating Unrecoverable Waste
𝑾𝟎= 𝑴(𝟏 − 𝑪𝑹− 𝑪𝑼) (𝟐. 𝟐)
𝑪𝑹: is thefraction of mass of the product being collected for recycling at the end of its use
phase
36 3- Waste generated in the recycling process
𝑾𝑪= 𝑴(𝟏 − 𝑬𝒄) 𝑪𝑹 (𝟐. 𝟑) 𝑬𝒄 : is the efficiency of recycling process used to recycle the product at the end of its use phase 𝑾𝑪 : is the quantity of waste generated in the recycling process
4- Waste generated to produce any recycled content used as feedstock
𝑾𝑭= 𝑴(𝟏 − 𝑬𝑭)𝑭𝑹
𝑬𝑭
(𝟐. 𝟒)
𝑭𝑹 : is the fraction of mass of a product’s feedstock from recycled sources
E : is the efficiency of the recycling process used to produce the recycled feedstock W : is the waste generated to produce any recycled content used as feedstock
Values for 𝑬𝒄 and 𝑬𝑭 are material and recycling process specific and will depend on a wide
range of factors as described in the next section.
This methodology does not require a closed loop so the recycled feedstock may come from sources other than the original product, Hence, 𝑬𝒄 is not necessarily equal to 𝑬𝑭 and it is
important to make a distinction between the recycling process used to produce the feedstock and the one used to recycle the product after collection. But in case of a closed loop, E = E or in another word there will be one recycling efficiency which can be represented by E
5- The overall amount of unrecoverable waste is given by:
𝑊 = 𝑊 + 𝑊 + 𝑊
2 (𝟐. 𝟓) 6- Calculating the Linear Flow Index (LFI)
The Linear Flow Index (LFI) measures the proportion of material flowing in a linear fashion, that is, sourced from virgin materials and ending up as unrecoverable waste. The LFI is computed by dividing the amount of material flowing in a linear fashion by the sum of the amounts of material flowing in a linear and a restorative fashion (or total mass flow, for short).
The index takes a value between 1 and 0, where 1 is a completely linear flow and 0 a completely restorative flow
LFI= liner flow / total (linear + restorative)
𝑳𝑭𝑰 = 𝑽 + 𝑾
𝟐𝑴 +𝑾𝑭− 𝑾𝟐 𝑪
(𝟐. 𝟔)