Steam Flow-rate Effect on the Transient
Behaviour in Phebus Experiment FPT-1
Salwa Helmy1,
Basma. Foad
1N. Eng. Safety, Dept. of NRRA, Cairo, Egypt1
Nuclear and Radiological Regulatory Authority (NRRA)
ABSTRACT: In this work the PHEBUS FPT-1 test is simulated and re-analyzed using ASTEC code to investigate fuel bundle degradation in a Pressurized Water Reactor. The main objective is to study the effect of steam flow rate due to increase the inlet steam mass flow in the primary circuit to double value, on fuel degradation, and structure material in the reactor coolant system. During this model; the peak bundle temperatures and amount of magma are decrease to half value as a result of increasing of the inlet steam mass flow. In addition, the fuel and clad temperatures decreased due to more cooling, and the main part of hydrogen, mainly coming from Zr oxidation, is also reduced
.
KEYWORDS:severe accidents, ASTEC code, PHEBUS FP, PWR, core degradation; fission products.
I.INTRODUCTION
The PHEBUS Fission Product (FP) programme was initiated in 1988 after major severe accidents in nuclear reactors such as Three Mile Island (TMI) in 1979 and Chernobyl in 1986. The main objective of the FPT-1 programme is to study the transport and retention of Fission product on reactor behaviour during severe accidents for Light Water Reactor (LWR) [1]. The PHEBUS FP programme comprises of six integral experiments as shown in table (1) [2]. For the first technological FPT-0 test fresh fuel was used (but with a pre-irradiation phase). Test FPT-1 test would be similar but with irradiated fuel, and the following tests were numbered FPT-2, FPT-3, FPT-4 and FPT5 [3]. Test FPT-2 will be similar to FPT-1 but the boric acid will be added to the steam and the flow will also be reduced to produce a window of reducing conditions. The tests did not span the whole range of conditions which might be expected in core melt accidents, but it was felt that six tests would provide a good basis for code assessment while remaining within the financial envelope and the residual life time of the reactor [4].The areas covered by the FPT1 experiment are:
- Fuel degradation, hydrogen production, release of fission products, fuel, and structural materials (bundle part). - Fission product and aerosol transport in the circuit (circuit part).
- Thermal hydraulics and aerosol physics in the containment (containment part); Iodine chemistry in the containment (chemistry part).
ASTEC code was used for the simulation of FPT-1 test and it was found that the code is capable to model the main severe accidents phenomena in the fuel bundle, heating and melting.
II. FPT-1 EXPERIMENT
PHEBUS facility reproduces at 1:5000 scale a 900 MWe PWR. The FPT1 test bundle as shown in figure (1) includes 18 PWR fuel rods previously irradiated to a mean burn-up of ~23.4 GWd/tU, two instrumented fresh fuel rods and one silver-indium-cadmium (AIC) control rod. The FPT1 test bundle is approximately 1 m in length and contained a total mass of about 11 kg of fuel enclosed in zircaloy cladding. The fuel rods are held in place by two Zircaloy spacer grids, and arranged in a 5x5 square lattice on a pitch of 12.6 mm, without the four corner rods. The spacer grids are of depth ~0.043 m and are located at 0.24 and 0.76 m elevations from the bottom of the fuel column. The grids are linked to four Zircaloy stiffeners.
The bundle is housed in an insulating shroud and introduced into an in-pile tube cooled by a pressurized water circuit. Where the RCS; in which steam generator is represented by an inverted U-tube. The containment represented by a 10 m 3 vessel with a water-filled part for the sump, a gas-filled part and painted surfaces [5].
The FPT1 test bundle was pre-irradiated for ~7 days with a mean bundle power of ~205 kW in the PHEBUS reactor before the experimental phase of the test in order to generate short-lived fission products in the fuel. This pre-conditioning phase was followed by a 5 hour transient during which steam at a pressure of ~ 2 bars was injected into the bundle with a flow rate varying between 0.5 and 2.2 g/s. Meanwhile, the bundle nuclear power was progressively increased up to 34.4 kW.
FIGURE 1:PHEBUS EXPERIMENTAL FACILITY[2].
III.ASTECCODE
The purpose of the ASTEC software package (Accident Source Term Evaluation Code) is to simulate all the phenomena that occur during a severe accident in a water-cooled nuclear reactor, from the initiating event to the possible release of radioactive products (the 'source term') outside the containment.
Description of ASTEC Modules [8]:
CESAR: The CESAR module simulates primary and secondary circuit thermal-hydraulics, intact and degraded core thermal-hydraulics, and porous media thermal-hydraulics (debris bed reflood applications)
ICARE: The ICARE module describes the in-vessel degradation phenomena (both early and late degradation phases). ICARE allows simulating the early-phase of core degradation with fuel rod heat-up, ballooning and burst, clad oxidation, fuel rod embrittlement or melting, molten mixture candling and relocation. It also can simulate the late-phase of core degradation with corium accumulation within the core channels and formation of blockages, corium slump into the lower head and corium behaviour in the lower head until vessel failure
ELSA: The ELSA module aims at simulating the release of fission products and structural materials from the degraded core during a severe reactor accident. ELSA is tightly coupled with the ICARE module which treats the phenomena of the core degradation.
SOPHAEROS: The SOPHAEROS module simulates transport of FP vapors and aerosols in the RCS through gas flow to the containment
CPA: The CPA module simulates thermal-hydraulics and aerosol behaviour in containment. It simulates simple or multi-compartment containments (tunnels, pit, dome…) with possible leakages to the environment or to normal buildings, with more or less large openings to the environment.
IODE: The IODE module simulates iodine behaviour in the containment. It describes in a kinetic way the chemical transformations of iodine.
DOSE: The DOSE module allows evaluating the dose rate in the containment.
ISODOP: The ISODOP module simulates decay of FP and actinide isotopes in different zones of the reactor In the present studies: ICARE, CESRA, CPA, SOPHAERO, DOSE and ISODOP modules are activated (where ELSA module is activated automatically as vessel is called).
IV.FPT-1 MODEL FOR ASTEC CODE
The reactor core is represented by 20 fuel rods, analogous to those in a PWR, along with a 1-metre-long absorber rod, and two grids. In the model fuel bundle of 1 control rod, 20 fuel rods and 2 grids is modeled. Two channels are defined for the whole test section. Every channel contains fuel rods each of which composed of two macro-components: FUEL and CLAD. The primary circuit is represented by 12 volumes; where the upper part - consists of 3 volumes (B_UP), and the hot-leg consists of 2 volumes (H_L). The steam generator is divided to 6 volumes (SG), and finally the cold-leg consists of 1 volume (CL_1). In addition, the bottom part is represented by VOLBOT volume.
A steam circulation from the bottom to the top with a flow rate is varying with time according to the experimental data.
V. RESULTS AND DISCUSSION
Base Case Results
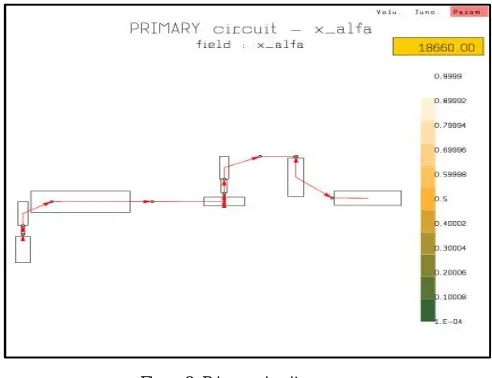
Figure (2) presents ASTEC Primary circuit nodalizationof FPT-1 from the core up to the cold-leg.
Figure (3) compares the inlet flow rate between the experimental and ASTEC calculation. The rate of the steam at a pressure of ~ 2 bars was injected into the bundle with a flow rate varying between 0.5 and 2.2 g/s. The evolution of the bundle nuclear power is investigated in figure (4).
The bundle degradation phase consisted of two main periods:
1- The thermal calibration of the bundle ~7900 seconds. During this period, the bundle power and the steam flow rate were increased step by step in order to check the thermal response of the bundle. The steam flow rate was first reduced from 1.8 to 0.5 g/s, when the bundle power was increased in steps from 0 to 3.90 kW.
2- The second period lasting from ~7900 to ~17000 seconds was the real bundle degradation period specifically devoted to the release of fission products, and bundle, structure and control rod material in order to study their transport and retention in the experimental circuit.
During the degradation phase substantial hydrogen production was observed. The degradation phase was terminated by shutdown of the nuclear power at 17039 s, and the bundle was cooled in a steam flow of 1.5 g/s. At the end of this cooling phase the containment was isolated at 18660 s.
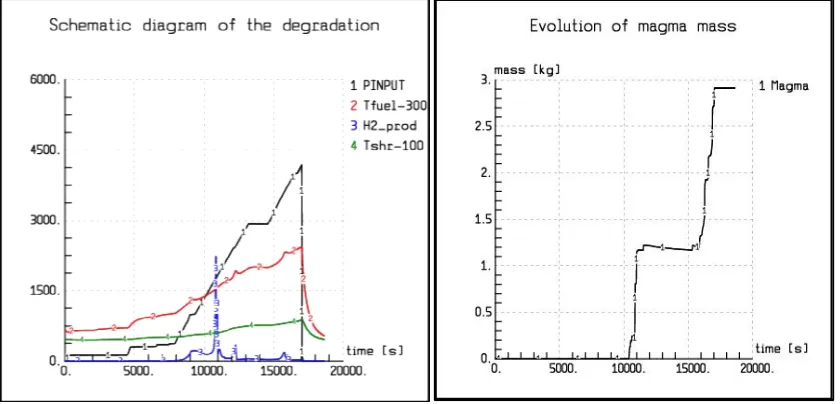
The power generated within the fuel rods produced the heat-up of the test bundle leading to the bursting of the cladding, degradation of the control rod as shown in figure (5), where the schematic diagram of the degradation figure explains evolution of the bundle nuclear power, fuel & shroud temperature and H2 production. After cladding oxidation and hydrogen generation, fuel liquefaction, and relocation of the absorber material, Figure (6) investigatesthe amount of mass of magma which reached to 3kg at 18000sec.
Figure 5:Schematic diagram of the degradation Figure 6:Evalutionof magma mass
Figure 7: Temperature of Fuel3 Figure 8: Temperature of clad3
Figure (9) shows that the bundle void fraction at the end of run (time 18660sec) equals 1.0, therefore the whole core bundle was completely vapor. In addition, the core field temperature lies between 800- 1000 K as indicated in figure (10).
Figure 9: Bundle void fraction Figure 10: Core field temperature
Hydrogen production
claddings, Zr guide tubes, and U-OZr relocated mixtures) where H2 production. Figure (12) shows the rate of hydrogen generation where the maximum rate is 0.2 g/s at 10000.0 sec.
Figure 11: Detailed Hydrogen production Figure 12: Instantaneous Hydrogen production
VI. PARAMETRIC STUDY RESULTS
In this Study the inlet steam flow in the primary circuit increased to double value (relative to the base case). Figure (13) compares the inlet steam mass flow which injected in the primary circuit for the parametric study and the base case. The base case is denoted by (case1) while the parametric study case is denoted by (case2).
Figure 13: Inlet flow Figure 14: Schematic diagram of the degradation
Figure15: Hydrogen mass
Figure 16: Clad temperatures profile Figure 17: Evolution of magma mass
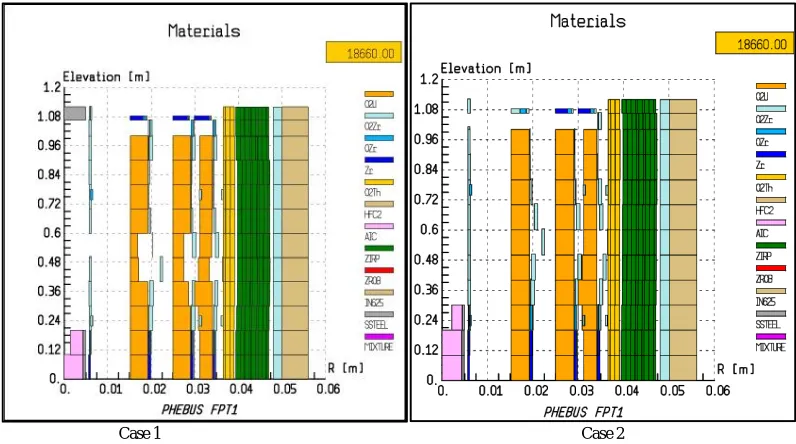
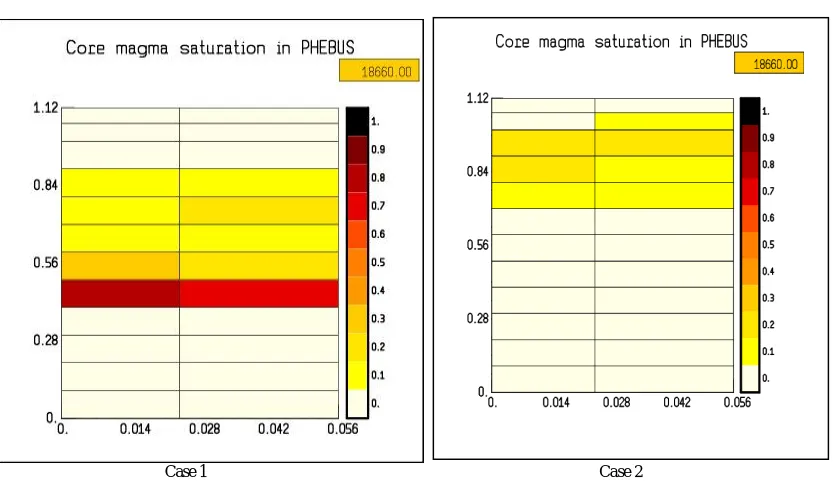
Figure (18) and (19) (case 1 &case2) show the core degradation and core magma saturation, where the material relocation events inside the bundle occurred slower compared to case1.
Case 1 Case 2
Case 1 Case 2
Figure 19 Core magma saturation
VII.CONCLUSION
Our paper is mainly focus on ASTEC code in studying the transient behavior of PHEBUS experiment due to its importance in investigating the fuel bundle degradation of Pressurized Water Reactor. It was found that ASTEC code was capable to model the main severe accidents phenomena in the fuel bundle, heating and melting of FPT-1 experiment. In addition, the consequence of increasing the steam flow rate in the primary circuit to double value was also analysed. Increasing the steam flow rate was leading to a delay in the fuel degradation, with the formation of less amount of magma (about half value). Therefore the peak bundle temperatures, fuel and clad temperatures, decreased as a result of increasing the cooling flow rate. Finally, the hydrogen mass and production rate were compared with the base case, and it was shown that the hydrogen coming from Zr oxidation was reduced due to the decreasing of the steam flow rate.
REFERENCES
[1] V., Hardt, P., Jones, A.V., Lecomte, and C., A., Tattegrain, “Nuclear Safety Research The Phebus FP Severe Accident Experimental Programme,” Nuclear Safety, Vol. 35(2), July-, pp. 187-205 December, 1994.
[2] S., Marco, G., Aleksander A., Luca “Circuit and Containment Aspects of PHÉBUS Experiment FPT-2”, Final Interpretation Report, European Commission, 2015.
[3] M., Schwarz and B., Clement “Practical Lessons from the First Three PHEBUS FP Tests”, JAERI-Conf 2000-015
[4] V.,Vileiniskis, and A., Kaliatka, “Best estimate analysis of PHEBUS FPT1 experiment bundle phase using ASTEC code ICARE module”, Kerntechnik; 76, 4; 254-260; 2011.
[5] “FPT1 Final Report Volume 1 Phebus Progress report”, April-September 2004
[6] L. Bosland,G. Weber,W. Klein-Hessling,N. Girault and B. Clement “Modeling and Interpretation of Iodine Behavior in PHEBUS FPT-1 Containment with ASTEC and COCOSYS Codes”, Nuclear Technology Issue 1 Volume 177, 2012 .
[7] G., Repetto, , J., Birchley, T., Drath, and H., Austregesilo, “Analysis of the PHEBUS FPT3 Core Degradation Using Severe Accidents Codes (ICARE/CATHARE, ATHLET-CD, MELCOR”, in TLEAR SORANSACTIONS- AMERICAN NUCCIETY; 98; 270-27 ; 2008.