INVESTIGATION
How Biochemical Constraints of Cellular Growth
Shape Evolutionary Adaptations in Metabolism
Jan Berkhout,*,†Evert Bosdriesz,*,‡Emrah Nikerel,†,§Douwe Molenaar,*,†Dick de Ridder,†,§ Bas Teusink,*,†,††and Frank J. Bruggeman*,**,††,‡‡,1 *Systems Bioinformatics, The Centre for Integrative Bioinformatics VU, VU University, 1081 HV, Amsterdam, The Netherlands,
†Kluyver Centre for Genomics of Industrial Fermentation, 2600 GA, Delft, The Netherlands,‡The Netherlands Bioinformatics
Centre, 6500 HB, Nijmegen, The Netherlands,§The Delft Bioinformatics Lab, Delft University of Technology, 2600 GA, Delft, The Netherlands, **Netherlands Institute for Systems Biology, 1098 XH, Amsterdam, The Netherlands,††Amsterdam Institute for Molecules, Medicines and Systems, VU University, 1081 HV, Amsterdam, The Netherlands, and‡‡Life Sciences, Centre for Mathematics and Computer Science, 1098 XH, Amsterdam, The Netherlands
ABSTRACTEvolutionary adaptations in metabolic networks are fundamental to evolution of microbial growth. Studies on unneeded-protein synthesis indicate reductions infitness upon nonfunctional protein synthesis, showing that cell growth is limited by constraints acting on cellular protein content. Here, we present a theory for optimal metabolic enzyme activity when cells are selected for maximal growth rate given such growth-limiting biochemical constraints. We show how optimal enzyme levels can be understood to result from an enzyme benefit minus cost optimization. The constraints we consider originate from different biochemical aspects of microbial growth, such as competition for limiting amounts of ribosomes or RNA polymerases, or limitations in available energy. Enzyme benefit is related to its kinetics and its importance for fitness, while enzyme cost expresses to what extent resource consumption reduces
fitness through constraint-induced reductions of other enzyme levels. A metabolicfitness landscape is introduced to define thefitness potential of an enzyme. This concept is related to the selection coefficient of the enzyme and can be expressed in terms of itsfitness benefit and cost.
E
NVIRONMENTAL conditions set the selective pressures acting on unicellular organisms. Microbialfitness is often related to growth properties, such as biomass yield, growth rate, or antibiotic resistance. As a large part of the available resources is spent on the synthesis of metabolic machinery, regulation of the levels of metabolic enzymes can have large influences onfitness (Dean 1989; Donget al. 1995; Dekel and Alon 2005; Stoebelet al.2008). Selection on growth rate may then direct the evolution of microorganisms to optimal allocation of resources for fitness enhancement (Dekel and Alon 2005; Molenaar et al. 2009). Alternatively, evolution may be directed by metabolic trade-offs (Beardmore et al.2011; Wengeret al.2011), which may cause sympatric speci-ation (Friesenet al.2004). To improve our understanding of the driving processes of metabolic evolution, the interplay
be-tween selective pressures and the biochemistry and organiza-tion of metabolic networks must be taken into account.
Studies on the growth effects of unneeded-protein expres-sion, sometimes called gratuitous or nonfunctional protein expression, indicate significant reductions in growth rate in batch cultivations ofEscherichia coli(Novick and Weiner 1957; Donget al.1995; Dekel and Alon 2005; Shachraiet al.2010) andZymomonas mobilis(Snoepet al.1995) and strong selec-tive disadvantages in chemostat cultivations usingE. coli(Dean
et al. 1986; Dean 1989; Lunzer et al. 2002; Stoebel et al.
2008). In Saccharomyces cerevisiae, a trade-off related to un-needed-protein expression was found (Langet al.2009). Dong, Nilsson, and Kurland found that unneeded protein can be expressed up to 30% of the total protein content beforeE. coli
growth halts (Donget al.1995). They concluded that growth reduction was caused by competition for protein synthesis machinery between nonfunctional and growth-promoting pro-teins (cf. Vindet al.1993). They also found significant reduc-tions of ribosomal activity at high unneeded-protein expression, as if the cells experience a nutrient downshift (Dong et al.
1996). Stoebel et al. (2008) discovered that the costs of
Copyright © 2013 by the Genetics Society of America doi: 10.1534/genetics.113.150631
Manuscript received February 20, 2013; accepted for publication March 21, 2013 Supporting information is available online athttp://www.genetics.org/lookup/suppl/
doi:10.1534/genetics.113.150631/-/DC1.
1Corresponding author: Systems Bioinformatics, IBIVU, VU University, 1081 HV
Amsterdam, The Netherlands. E-mail: [email protected]
unneeded-protein synthesis ofE. coli’slacoperon in chemostat cultures is due to the transcription and translation process,e.g., the competition for RNA polymerases and ribosomes, rather than due to toxic effects or excessive usage of nucleotide or amino acid precursors. Other studies (Dong et al.1995; Vind
et al.1993) also indicate that unneeded-protein synthesis is at the expense of the synthesis of other proteins that have growth-related activities; hence, these are all experimental indications of the existence of a cellular constraint that limits the cellular protein content. Several groups (Donget al.1995; Snoepet al.
1995; Stoebel et al. 2008; Shachrai et al. 2010) measured a linear dependency of the reduction of the growth rate on the unneeded-protein fraction whereas Dekel and Alon (2005) found a quadratic dependency of the growth-rate reduction on unneededlacoperon expression byE. coli. In all cases, strong dependencies offitness on unneeded (or excess) protein synthe-sis was found.
From an evolutionary perspective, the high cost of un-needed-protein synthesis suggests that adjustments of protein partitioning over growth processes is an important mechanism forfitness enhancement of bacteria (Donget al.1996; Dekel and Alon 2005). Studies on translation control and the corre-lation between ribosome content and growth rate of E. coli
indeed suggest that this organism aims to maximize its growth rate by optimal partitioning of protein over growth processes (Ehrenberg and Kurland 1984; Klumpp and Hwa 2008; Klumppet al.2009; Zaslaveret al. 2009). This could explain why gratuitous protein expression causes such drastic reduc-tions in growth rate. That nonfunctional protein expression leads to growth-rate reduction is also supported by metabolic control theory, which proves thatfluxes through metabolic net-works scale linearly with the entire (functional) metabolic pro-tein content (Kacser et al. 1973; Westerhoff and van Dam 1987; Snoepet al.1995).
The evolutionary importance of optimal protein partition-ing over growth processes indicates that a better understand-ing of the molecular basis and consequences of the cost of unneeded-protein synthesis is needed. We offer a theoretical framework for studying metabolic pathway evolution while the entire organism is under selection of the maximal specific growth rate in a batch cultivation. We start with an evolu-tionary analysis of metabolic enzyme levels. We derive how the optimal level of a metabolic enzyme can be understood in terms of its direct contribution tofitness (benefit) and its cost (usage of resources at the expense of other needed enzymes). We show that misbalancing of these quantities leads to reductions in fitness and sets thefitness potential (selection coefficients) of individual enzymes. Central to our framework is the concept of limiting growth process,e.g., transcription or translation machinery, which bounds the maximal protein level that can be attained by a cell and is known to be major factor in metabolic evolution (Dekel and Alon 2005; Stoebel
et al. 2008). We show with mechanistic biochemical models that alternative processes for setting the limits of the cellular protein content, i.e., transcription, translation, or energy us-age, all lead to a protein-constraint relation that is linearly
dependent on protein concentrations. Together with basic mathematical properties of enzyme kinetics and metabolic pathways, this leads to a cost of unneeded-protein synthesis that is a linear function of the protein concentration, which is in agreement with most experimental data (Donget al.1995; Snoepet al.1995; Stoebelet al.2008; Shachraiet al.2010). We define afitness potential for every enzyme in thefitness landscape. This concept indicates the importance of every enzyme for enhancingfitness and can be expressed in terms of enzyme benefit and cost. We show that this measure is a specific formulation of the selection coefficient used in ex-perimental studies (Stoebel et al. 2008) and is related to a control coefficient of metabolic control analysis (Kacseret al.
1973; Heinrich and Rapoport 1974).
Results
Growth processes set a limit to the cellular protein content
Generally, evolutionary optimization offitness occurs under constraints. Metabolic networks have functional limits set by biochemical kinetics, thermodynamics, and physics. For instance, total available ATP sets a limit to biomass synthesis (Teusink et al. 2006), diffusion time scales limit reaction rates (Berg and Von Hippel 1985), and available membrane space sets the maximal nutrient uptake rate (Molenaaret al.
2009). Typically, several constraints act simultaneously. We are interested in the constraints that set a bound to cellular protein content. Such a constraint, denoted by Fj, depends in principle on all the enzyme levels,ei, and some weight factor for every enzyme,vi; thus, we obtainFj(v,e) (boldface letters denote vectors). We give each constraint a bound Fj(v,e)# Rj and generally refer to them as re-source bounds. Every weight factor,vi, can be interpreted as the specific resource requirement of the associated meta-bolic enzyme. In the simplest case, only one constraint func-tion occurs; defined as a weighted sum of enzyme levels,
Fðv;eÞ¼X
n
i¼1
viei#R: (1)
The total number of metabolic enzymes equalsn. This equa-tion implicitly sets the total cellular protein content:
eT¼
Pn
i¼1ei. This constraint immediately suggests that un-needed-protein synthesis lowers the level of growth-related proteins. This is in agreement with experimental findings (Vind et al. 1993; Donget al. 1995). These authors found reduced protein expression as a response to unneeded-protein synthesis. Below we quantify this effect and discuss several of its origins.
Regardless of whether a limitation on the number of RNA polymerases (or ribosomes) or in available energy (e.g., in terms of ATP equivalents) is assumed or whether toxic effects resulting from protein synthesis are considered, Equation 1 emerges in each of these cases. The mathematical derivation of these scenarios can be found in theSupporting Information,
File S1. The only difference between these protein-limitation scenarios is that the v’s in Equation 1 have a different bio-chemical interpretation. Each of these alternative limitation scenarios have been suggested in the literature for setting the protein content per cell (Vind et al. 1993; Snoep et al.
1995; Klumpp and Hwa 2008; Stoebel et al. 2008; Klumpp
et al.2009; Molenaaret al.2009; Zaslaveret al.2009). Here we show that they can in principle all be described with the same constraint equation.
Equation 1 has an important consequence for the evolution of metabolic networks. It is an established fact that everyflux in a metabolic network,J, increases with a factoraif the entire protein content of the network is increased with this factora; this is one of thefindings of metabolic control theory (Kacser
et al. 1973; Westerhoff and Van Dam 1987; Giersch 1988). Mathematically, this means that theflux is afirst-order homo-geneous function of the cellular protein content. As a conse-quence, having more protein expressed in a metabolic network leads to higher fluxes. However, the total protein content is limited by constraints such as Equation 1. Given the existence of these constraints, if metabolicfluxes are to be optimized in evolution, it is the partitioning of proteins over the entire met-abolic network that is being optimized.
Equation 1 implies a trade-off for metabolic systems and indicates the existence of an optimal combination of enzyme levels that maximizesfitness. The constraintF(v,e)#Rforces the use of cheap enzymes with low v’s as this allows for an increased cellular protein content and, as a consequence, higher fluxes. In a metabolic network, this will inevitably lead to ex-pensive enzymes becoming progressively more limiting and eventually a requirement for an increase in their concentration. This causes a reduction of the total enzyme level in the network and a reduction of metabolic fluxes. Hence, there must exist some optimal combination of enzyme concentrations that bal-ances these opposing forces and maximizes a specificflux given the constraintR. Thus, the optimization problem of a metabolic flux under a resource constraint involves maximizingJ/R, which can be interpreted as maximizing the return (J) of investment (R).
Specific growth-rate optimization requires optimal
protein allocation over growth processes: Maximization of J/R
The selection pressure in serial dilution experiments of batch cultivations at midexponential growth rate (balanced growth) is the maximal specific growth rate (Vasiet al.1994). Under these conditions, all the nutrients are in excess. The specific growth rate, denoted bym(per hour, hr21), is aJ/Rmeasure and, therefore, it directly applies to the constraint optimization problem we have just introduced (this is illustrated in-depth in
File S2). To understand this, it is instructive to analyze the units ofm. The specific growth rate of a microorganism equals the production rate of biomass (“itself”) expressed as gram biomass per hour pergram biomass or, equivalently the syn-thesis rate of protein by the cell divided by total cellular pro-tein content. In other words, the specific growth rate just gives
the rate at which one unit organism is produced by one unit organism;i.e., the reciprocal growth rate is directly related to the generation time (tg; tg = ln(2)/m). Thus, the specific growth rate is a self-replication rate. Therefore, selection for the maximal specific growth rate is directly related to the total (functional or needed) protein content of a cell and synthesis of unneeded protein will only reduce it.
Strictly speaking, the maximal specific growth rate is the selection pressure in (serial) batch cultivation; the theory that we present below does therefore not directly apply to chemo-stat cultivation. For evolution in chemochemo-stats, a different selec-tion pressure that is not obviously related to cellular protein content applies; we return to this point in the discussion.
Operational definition of enzyme benefits and costs
Maximization of the specific growth rate is achieved by expressing every metabolic enzyme to the right level, such that none of the resources are wasted on the wrong enzymes and none of the enzymes are expressed at a too-low level. How can we figure out what the right expression level is for a specific metabolic enzyme? Intuitively, the right level of an enzyme is the enzyme amount at which the benefit minus the cost of the enzyme is largest. But what would be the biochemical defi -nitions of enzyme benefit and cost such that if their difference is maximized the enzyme has attained its optimal level?
In our theory, pure cost originates from protein burden without function (unneeded-protein expression). Pure ben-efit originates from function without burden. Accordingly, the cost of an enzyme would be equal to the fractional reduction influx (fitness) when a certain amount of the inactive form of the enzyme would be added, and the remaining enzyme concentrations (including the active form of the enzyme under consideration) would redistribute according to the corresponding reduced resource constraint to a new (and necessarily lower)flux optimum. This concept of cost exactly matches the definition of cost used in the analysis of the influences of unneeded-protein synthesis on growth (Vind
et al. 1993; Donget al.1995; Snoepet al.1995; Dekel and Alon 2005; Stoebelet al.2008). When theflux and the con-straint are homogeneous functions of the enzyme concentra-tions to thefirst order, the new optimum simply corresponds to the same fractional distribution of all active enzymes, but now with a reduction in the available resource corresponding to the amount of inactive enzyme. This predicts a linear re-lationship between cost and enzyme concentrations:
Ciðei;RÞ ¼ 2
JðR2vieiÞ2JðRÞ
JðRÞ ¼ viei
R : (2)
The derivation of this equation can be found in File S3. It is based on the assumptions that the constraint function depends linearly on the enzyme concentration (Equation 1) and theflux is afirst-order homogeneous function of the cel-lular protein content, which is generally valid in metabolic
networks (Kacser et al. 1973; Westerhoff and van Dam
1987; Giersch 1988). The notationeisignifies that the enzyme
is expressed in a nonfunctional form; it cannot contribute to fitness. The resource amountR2viei corresponds to the re-sidual resource amount after having spentvieiresource units on unneeded protein.
Experimentally, the cost can be determined by a measure-ment of the reduction infitness upon expressing the enzyme of interest under a condition where it is not used (Donget al.
1995; Dekel and Alon 2005; Stoebelet al.2008). Equation 2 indicates that the cost of an enzyme equals its fractional resource usage. The exact reduction in resources is depen-dent on the enzyme properties as captured in the enzyme’sv
coefficient. Interestingly, wefind that enzyme cost is entirely independent of metabolic enzyme kinetics.
In a similar fashion, we define the benefit of an enzyme as the fractional increase influx when the enzyme’s specific activity would be increased by a certain fraction without a reduction in the available resource (Rremainsfixed) while all other enzymes remain at their (optimal) levels. Thus, the benefit of an enzyme is defined as the fractional increase in fitness upon an increase of active enzyme. This increase is not at the expense of any of the available total resources; this is done cost free. InFile S4, we derive that the benefit equals the following relationship,
Biðei;RÞ ¼
J^eoptðei;RÞ
JeoptðRÞ : (3)
The notation J(eopt(R)) indicates the metabolicflux when all enzymes are expressed at their optimal level;Jð^eoptðei;RÞÞ indicates theflux when all enzymes, except for enzymei, are kept at their optimal level and enzymeiis expressed to level,
ei. This means that the benefit equals 1 only when enzymeiis at its optimal level.
We emphasize that the benefit definition does not neces-sarily have to be defined with reference to the optimal levels of all the other enzymes in the system. We take this perspective here to simplify the discussion of the relationship of the enzyme benefit and itsfitness potential that follows later. For most practical purposes the enzyme benefit can be better defined as:Biðei;RÞ ¼Jð^eðei;RÞÞ=JðeðRÞÞ. In this formulation, the benefit can become.1 if the expression leveleiwas not optimal in the reference condition. When the benefit is mea-sured in an experiment, as done by Dekel and Alon (2005), it this definition of benefit that is most relevant.
The benefit, in contrast to the cost, does depend on enzyme kinetics and requires consideration of the entire metabolic system. Dekel and Alon (2005) measured the benefit for the
lac operon in E. coli. The benefit can be straightforwardly calculated for a mathematical model of a metabolic pathway. First, the reference flux is calculated given enzyme kinetic parameters, a characterization of the environment, and the resource constraint. The benefit curve for each enzyme is then calculated by determining the steady-stateflux as function of enzyme level while all other enzymes remain fixed at their optimal values. Typically, the benefit of an enzyme will display saturation behavior with increasing concentrations. Here we
have generalized Dekel and Alon’s definitions of enzyme ben-efit to make them applicable to general metabolic pathways.
The enzyme benefit minus cost is maximized
at the optimal enzyme level
What remains to be shown at this stage is that a maximiza-tion of the return on investment,i.e., ofJ/R, indeed implies a maximization of benefit minus cost. This we derive inFile S6by showing that the optimization of theflux,J, under the constraint given by Equation 1, indeed gives rise to a maxi-mization of benefit minus cost when the enzyme level is at its optimal level.
The fact that the benefit minus cost is maximal at the optimal level of the enzyme can also be derived from a different perspective. The derivative of benefit minus cost with respect to the enzyme level in the optimum should equal 0:
@Bi
eopti ;R
@ei 2
@Ci
eopti ;R
@ei ¼
@ ln JeoptðRÞ
@ei 2
vi
R ¼0: (4)
Multiplication of this equation with eopti gives rise to the following expression at the optimal state,
@ ln JeoptðRÞ
@ ln ei ¼
vieopti
R : (5)
On the left-hand side we identify the scaled flux control coefficient of enzymei, CJ
i, as defined in metabolic control analysis (MCA) (Kacser et al.1973; Heinrich and Rapoport 1974). Interestingly, this result is in agreement withfindings from Heinrich and co-workers, who arrived at the same re-lationship by maximizing theflux through a metabolic path-way under the constraint offixed total enzyme concentration;
i.e., maximization of J/R (Klipp and Heinrich 1994, 1999; Heinrich and Klipp 1996; Heinrich and Schuster 1998). Examples of this relation for other constraint functions are shown in File S7. We retrieve this equation via a different route: through maximization of the difference between ben-efit and cost. Thus, CJ
i is related to its fractional resource usage at an optimal metabolic state. In a subsequent section, we use from the concept of afitness landscape to show that this coefficient is also related to thefitness contribution of enzymei.
A cost–benefit analysis differentiates the importance
of enzyme kinetics and process costs
The definitions of enzyme benefits and costs address different aspects of protein expression. The benefit exclu-sively addresses the contribution of the enzyme activity to fitness (and is therefore zero for an unneeded or non-functional protein) without consideration of the cost, i.e., the consequent reduction in the levels of other proteins upon protein expression due to a constraint (cf. Vindet al.
1993 for experimental evidence). The cost considers the re-duction in fitness upon expression of the enzyme when it does not contribute tofitness. In Figure 1, the influence of
pathway kinetics and specific enzyme costs (process costs for transcription and translation, for instance) on the optimal enzyme level is illustrated. Changes in the benefit curve, due to changes in kinetic parameters of any of the pathway enzymes, changes not only the enzyme of interest but also others. This can cause changes in the optimal enzyme level or they derive from changes in enzyme costs. Changes in specific enzyme cost can, for instance, be introduced by decreasing the lifetime of the enzyme such that at steady state more ribosomes are required to sustain the enzyme level. The optimal level of the enzyme occurs in this plot when the slope of the benefit and cost curve are equal (Equation 4). The cost slope depends linearly on the specific cost of the enzyme. The benefit slope depends in a non-linear manner on kinetic properties in the metabolic network. A sensitivity analysis of the kinetic parameters and the specific enzyme costs on the optimal enzyme level will give additional insight into kinetic and cost contributions in the optimum,i.e., whether the catalytic enzyme constants (KMorkcat’s) force par-ticular enzyme levels or whether transcription or translation costs dominate.
We emphasize that in Figure 1 the enzyme costs are expressed with respect to the total resource allocated to the pathway. Therefore, the costs in Figure 1 vary from 0 to 1. Alternatively, the total cellular resource amount could have been considered and then the costs would have been much smaller than 1; hence, the cost curves would have been much less steep. Typically, the total cellular resource requirement is unknown but the resource expended on a particular pathway can in principle be deduced from experiments at the pathway level. With math-ematical models of metabolic pathways the resource allocated to the pathway can also be predicted, byfixing the metabolic path-wayflux and the subsequent minimization of the resource re-quirement to achieve thisflux. The predicted enzyme levels can then be compared to measurements. If the boundary metabo-lites of the pathway arefixed to measured concentrations and the metabolic pathwayflux is also chosen according to the same experiment, then the optimal enzyme levels obtained by mini-mizing the resource allocated to the pathway will be in agree-ment with the situation when the entire cellular resource is minimized. Thus when costs are expressed in terms of path-way level resource allocation, the optimal enzyme levels are the same as when the costs are defined with respect to the total cellular resource. The enzyme cost at the cellular level is then obtained fromðRpath=RcellÞðviei=RpathÞ. Theflux con-trol coefficient of the enzyme in the optimal state at the level of the entire cell then reduces by the same factor relative to its pathway level value; hence, the flux control coefficient becomesðRpath=RcellÞCJi.
Exploring the relationships between selection
coefficients, enzyme costs, and benefits,
using afitness landscape
A cost–benefit analysis sheds light on the optimal distribu-tion of enzyme levels, under a given resource constraint, in terms of enzyme costs and metabolic system kinetics (benefit). What we do not understand at this stage is why
some enzymes are more important than others for achieving the optimal state,i.e., for changing (or adapting)fitness. Some enzymes therefore have a higher selection coefficient: for the same change in enzyme level some enzymes will have a higher influence onfitness than others. To address this issue we study thefitness landscape.
We take the steady-stateflux through a metabolic path-way as ourfitness function. Thefitness landscape is defined as the dependency of the pathway flux on all the enzyme levels given a resource constraint that limits total cellular protein content. The constraint bounds thefitness landscape
ð"i:0#ei#R=viÞ. At the optimal combination of enzyme
levels, the metabolic pathwayflux is maximal and thefitness landscape displays a maximum. One sensible way to obtain an impression of such a multidimensionalfitness landscape is to look along an enzyme concentration axis, say of enzymej, and see how the maximalflux depends on the concentration of this enzyme, taking into account the resource constraint. This can be achieved byfixing enzymejat some valueejand then optimizing theflux under the”residual”constraintR2 wjej (and 0 , ej, R/wj). Only when ej equals its optimal value, ej¼eoptj , the maximal flux Jopt is recovered and all enzyme levels will be at their optimal value. The dependency of the optimal flux on ej, resulting from this procedure, is defined as thefitness landscape ofej. We define the scaled slope of thisfitness landscape for enzymejat some level ofej,
i.e.,@ ln Jopt=@ ln ej, as thefitness contribution of enzymejat level ej. We next describe an analytical expression for this fitness contribution that we derive inFile S8.
We are interested in determining the slope of the de-pendency of the optimal flux (Jopt) around the optimal en-zyme distribution eopt for enzyme j. If in this region
Jð^eoptðej;RÞÞ Joptthen changes inejhardly affect the optimal
Figure 1 Influences of enzyme kinetics and specific enzyme cost on optimal enzyme levels. Schematic of the effect of different specific en-zyme cost (left) and different benefit (right) on optimal enzyme expres-sion. Enzyme kinetic parameters exclusively influence the benefit curve (blue) and the enzyme costs (red) depend only on the process costs for enzyme synthesis. These two factors can independently influence the optimal enzyme level. The difference between benefit and cost is shown by the green curves. The largest difference between benefit and cost is indicated for each scenario and corresponds to the optimum of the green curves. The optimal enzyme level occurs when the slope of the benefit and cost curve in these plots are equal (Equation 4).
flux as the dependency ofJð^eoptðej;RÞÞonejisflat and, hence,
@Jopt/@ejwill be small in this region. Alternatively, if@Jopt/@ejis large, the dependency is steep and changes in the level of the enzyme have a large effect near the optimalflux. This suggests that this enzyme should evolve if it is not at its optimal expres-sion level. Thefitness contribution of enzymej,Fj(ej), is given by (seeFile S8for derivation and application to a toy model)
Fj
ej
¼@ ln Jopt @ ln ej ¼
CJ
j 2Cj
ej;R
12Cj
ej;R
¼@Bj=@ ln ej2@Cj=@ ln ej 12Cj
ej;R
:
(6)
This equation has an intuitive interpretation. If the term
CJ
j 2Cjðej;RÞ is large, a large change in the flux can be obtained at the expense of little resource investment in a change in the enzyme concentration. This signifies an enzyme with large evolutionary potential. Unneeded-protein synthesis can also be studied with this equation when the flux control co-efficient is set equal to 0. We note that a conservation relation-ship exists for the fitness contributions at every point in the fitness landscape (File S8).
The expression for the fitness contribution of enzyme j
has some insightful properties. It equals zero whenej¼eoptj because thenCJ
j ¼e opt
j vj=R(Equation 5). Thefitness contri-bution should be positive whenej,eoptj and negative when
ej.eoptj (because we are considering a maximum). The de-nominator is always positive. Therefore, we need to have
CJ
j .ejvj=R when ej,eoptj and CJj,ejvj=R when ej.eoptj , exactly as intuition would suggest. WhenCJ
j ¼1 (note that typically, 0,CJ
j ,1) we retrieve the largestfitness contri-bution. This means that a high CJ
j suggests a large fitness potential.
Discussion
In this work, we studied the biochemical basis of the constraints that limit the evolutionary adjustments in protein levels re-quired to enhancefitness in batch growth conditions,i.e., when selection acts on the specific maximal growth rate. Thisfitness objective, maximization of the specific maximal growth rate, can be interpreted as a maximization of the cellular self-replication rate. This becomes clear from its definition, as the biomass syn-thesisflux per unit biomass or synthesis of the growth machin-ery of a cell per growth machinmachin-ery per cell. Hence, production of protein that does not contribute to growth would enhance the amount of protein machinery but not the synthesisflux of new synthesis machinery and therefore cause enhanced protein costs. Thus, for this selective pressure the minimization of resource usage to attain a particular growth rate—i.e., effectively mini-mizing unneeded-protein synthesis—is a relevant hypothesis with ample experimental support (see Introduction).
In this work, we found that several models of biochemical constraints acting on protein synthesis lead to linear relations between the total available (limited) resources and the protein concentration (Equation 1 and File S1). These models differ in the mechanistic and kinetic interpretation of the specific
resource requirement of an enzyme, its v coefficient. What we did not consider in these models is that at high degrees of enzyme overexpression, additional protein toxicity infl uen-ces can play a role, such as limitations of specific amino acids, cell morphological influences, or the formation of growth-inhibiting protein aggregates. We omitted these phenomena from our theoretical models because we believe their negative influences on growth will typically be negligible when enzyme levels are changed close to their natural expression level (typ-ically ,1% of total cellular protein content). Such experi-ments are required to determine enzyme costs of wild type or evolved strains in evolutionary studies. However, if en-zyme costs are determined from experiments with signifi -cant overexpression, protein toxicity cannot be excluded. Moreover, under those conditions it cannot be ruled out that the enzyme cost is no longer a linear function of the enzyme concentration.
In chemostats, the synthesis of unneeded protein also caused a fitness reduction (Dean et al. 1986; Dean 1989; Lunzeret al.2002; Stoebelet al.2008) as measured by the selection coefficient. This is surprising, because the selective pressure in a chemostat is not directly linked to resource usage in contrast to the selective pressure in batch, which is essentially expressed in terms of total functional/needed
protein. The selective pressure in chemostat is the ability to grow at the specific growth rate set by the dilution rate at the lowest possible concentration of the limiting nutrient in the bioreactor. Essentially, the selection pressure acts on the affinity (or more precisely mmax/KS), where the selection pressure for the affinity for the substrate is most pronounced at low growth rate (far below the maximal specific growth rate of the organism, e.g., Lunzer et al. 2002). It is not immediately evident that under these conditions, fitness can be enhanced by adjusting protein partitioning and whether the functional protein content should be maxi-mized. This is partially because selection acts on substrate affinity and not on reproduction rate (and also not on the number of offspring, not per unit time and in terms of yield). Perhaps, unneeded-protein synthesis in chemostats leads to fitness reduction because the nonfunctional protein pro-duced also goes at the expense of transporter protein, which can be expected to be important under chemostat selection conditions at low growth rates. Alternatively, the fitness in chemostats is enhanced by increased maximal growth rate, which is unlikely at low dilution rates, but cannot be ruled out. However, the basic biological explanations of the impor-tance of protein constraints in chemostat selection are not straightforward, which is why we focused in this article on selection in batch cultures. The role of protein constraints in chemostat evolution experiments deserves more attention in future studies.
The enzyme fitness potential that we have proposed is intimately linked to the selection coefficient used in growth studies. Suppose two mutants,xandy, occur simultaneously in a batch reactor at the same time and they differ in their fitness. Typically a selection coefficient is defined, which
addresses how quickly thefitter mutant outgrows the other mutant. This is done by plotting the time evolution of the quantity lnðx=yÞ. If mutant xderives from genotype yand differs only in the expression level of one enzyme,ej, the rate of change of the selection coefficient, ðd=dtÞlnðx=yÞ, equals
mðejþDejÞ2mðejÞ ð@m=@ejÞdej. In the absence of a con-straint that limits the cellular protein content,@m=@ejwould be the unscaled control coefficient of the enzymejonfitness. In the presence of the protein constraint,@m=@ejequals the unscaled fitness potential of the enzyme (i.e., ðJopt=ejÞFj). This indicates that the selection coefficient in a serial batch experiment is related to thefitness potential of the mutated enzymes and their benefits and costs. In fact, this correspon-dence between the control coefficient and the selection co-efficient was exploited by Steve Oliver’s group (Castrilloet al.
2007; Piret al. 2012) when they measured the control co-efficient of hundreds of enzymes on growth rate in chemostat using a single-allele knockout library. Note that for many applications, thefitness potential will be close to the control coefficientðFjCjJÞ, because the resource usage of enzyme will often be very smallRvjejand negligible compared to the value ofCJ
j.
The theory described in this article can be useful for rationalizing experimental data of metabolic evolution of microorganisms. This theory extends earlier work on the application of metabolic control analysis to study meta-bolicfitness (Dykhuizenet al.1987).
Acknowledgments
We thank Johan van Heerden for critical reading of the manuscript. We also thank anonymous reviewers for helping us improving the manuscript. This work was supported by Netherlands Organization for Scientific Research (NWO) Computational Life Sciences Project (CLS-635.100.18) and supported by Netherlands Bioinformatics Centre (NBIC, BioRange 4.10). This work is a contribution by the Kluyver Centre for Genomics of Industrial Fermentation, which is financially supported by the Netherlands Genomics Initiative. F.J.B. thanks the Netherlands Institute for Systems Biology (NISB), the Centre for Mathematics and Computer Science (CWI), and the Dutch Organization for Scientific Research (NWO, Grant number 837.000.001) for funding.
Literature cited
Beardmore, R. E., I. Gudelj, D. A. Lipson, and L. D. Hurst, 2011 Metabolic trade-offs and the maintenance of thefittest and theflattest. Nature 472(7342): 342–346.
Berg, O. G., and P. H. von Hippel, 1985 Diffusion-controlled mac-romolecular interactions. Annu. Rev. Biophys. Biophys. Chem. 14: 131–160.
Castrillo, J. I., L. A. Zeef, D. C. Hoyle, N. Zhang, A. Hayes et al., 2007 Growth control of the eukaryote cell: a systems biology study in yeast. J. Biol. 6: 4.
Dean, A. M., 1989 Selection and neutrality in lactose operons of
Escherichia Coli. Genetics 123: 441–454.
Dean, A. M., D. E. Dykhuizen, and D. L. Hartl, 1986 Fitness as a function of beta-galactosidase activity in Escherichia coli. Genet. Res. 48(1): 1–8.
Dekel, E., and U. Alon, 2005 Optimality and evolutionary tuning of the expression level of a protein. Nature 436(7050): 588– 592.
Dong, H., L. Nilsson, and C. G. Kurland, 1995 Gratuitous over-expression of genes inEscherichia colileads to growth inhibition and ribosome destruction. J. Bacteriol. 177(6): 1497–1504. Dong, H., L. Nilsson, and C. G. Kurland, 1996 Co-variation of
tRNA abundance and codon usage inEscherichia coliat different growth rates. J. Mol. Biol. 260(5): 649–663.
Dykhuizen, D. E., A. M. Dean, and D. L. Hartl, 1987 Metabolic
flux andfitness. Genetics 115(1): 25–31.
Ehrenberg, M., and C. G. Kurland, 1984 Costs of accuracy deter-mined by a maximal growth rate constraint. Q. Rev. Biophys. 17 (1): 45–82.
Friesen, M. L., G. Saxer, M. Travisano, and M. Doebeli, 2004 Experimental evidence for sympatric ecological
diversi-fication 2 to frequency-dependent competition in Escherichia coli. Evolution 58(2): 245–260.
Giersch, C., 1988 Control analysis of metabolic networks. 1. Ho-mogeneous functions and the summation theorems for control coefficients. Eur. J. Biochem. 174(3): 509–513.
Heinrich, R., and E. Klipp, 1996 Control analysis of unbranched enzymatic chains in states of maximal activity. J. Theor. Biol. 182(3): 243–252.
Heinrich, R., and T. A. Rapoport, 1974 A linear steady-state treat-ment of enzymatic chains. Control 95: 89–95.
Heinrich, R., and S. Schuster, 1998 The modelling of metabolic systems. Structure Control Optimality. Biosystems 47(1–2): 61– 77.
Kacser, H., and J. A. Burns, 1973 The control offlux. Symp. Soc. Exp. Biol. 27: 65–104.
Klipp, E., and R. Heinrich, 1994 Evolutionary optimization of en-zyme kinetic parameters: effect of constraints. J. Theor. Biol. 171(3): 309–323.
Klipp, E., and R. Heinrich, 1999 Competition for enzymes in met-abolic pathways: implications for optimal distributions of en-zyme concentrations and for the distribution of flux control. Biosystems 54(1–2): 1–14.
Klumpp, S., and T. Hwa, 2008 Growth-rate-dependent partition-ing of RNA polymerases in bacteria. Proc. Natl. Acad. Sci. USA 105(51): 20245–20250.
Klumpp, S., Z. Zhang, and T. Hwa, 2009 Growth rate-dependent global effects on gene expression in bacteria. Cell 139(7): 1366– 1375.
Lang, G. I., A. W. Murray, and D. Botstein, 2009 The cost of gene expression underlies a fitness trade-off in yeast. Proc. Natl. Acad. Sci. USA 106(14): 5755–5760.
Lunzer, M., A. Natarajan, D. E. Dykhuizen, and A. M. Dean, 2002 Enzyme kinetics, substitutable resources and competi-tion: from biochemistry to frequency-dependent selection in lac. Genetics 162: 485–499.
Molenaar, D., R. van Berlo, D. de Ridder, and B. Teusink, 2009 Shifts in growth strategies reflect tradeoffs in cellular economics. Mol. Syst. Biol. 5(323): 323.
Novick, A., and M. Weiner, 1957 Enzyme induction as an all-or-none phenomenon. Proc. Natl. Acad. Sci. USA 43(7): 553–566. Pir, P., A. Gutteridge, J. Wu, B. Rash, D. B. Kellet al., 2012 The genetic control of growth rate: a systems biology study in yeast. BMC Syst. Biol. 6: 4.
Shachrai, I., A. Zaslaver, U. Alon, and E. Dekel, 2010 Cost of un-needed proteins inE. coliis reduced after several generations in exponential growth. Mol. Cell 38(5): 758–767.
Snoep, J., L. P. Yomano, H. V. Westerhoff, and L. Ingram, 1995 Protein burden in Zymomonas mobilis: negative flux
and growth control due to overproduction of glycolytic en-zymes. Microbiology 141(9): 2329–2337.
Stoebel, D. M., A. M. Dean, and D. E. Dykhuizen, 2008 The cost of expression ofEscherichia colilac operon proteins is in the pro-cess, not in the products. Genetics 178: 1653–1660.
Teusink, B., A. Wiersma, D. Molenaar, C. Francke, W. M. de Vos
et al., 2006 Analysis of growth of Lactobacillus plantarum
WCFS1 on a complex medium using a genome-scale metabolic model. J. Biol. Chem. 281(52): 40041–40048.
Vasi, F., M. Travisano, and R. E. Lenski, 1994 Long-term experi-mental evolution in Escherichia coli. II. Changes in life-history traits during adaptation to seasonal environment. Am. Nat. 144 (3): 432–456.
Vind, J., M. A. Sørensen, M. D. Rasmussen, and S. Pedersen, 1993 Synthesis of proteins in Escherichia coli is limited by
the concentration of free ribosomes: expression from reporter genes does not always reflect functional mRNA levels. J. Mol. Biol. 231(5): 678–688.
Wenger, J. W., J. Piotrowski, S. Nagarajan, K. Chiotti, G. Sherlock
et al., 2011 Hunger artists: yeast adapted to carbon limitation
show trade-offs under carbon sufficiency. PLoS Genet. 7(8): e1002202.
Westerhoff, H. V., and K. van Dam, 1987 Thermodynamics and
Control Of Biological Free-Energy Transduction. Elsevier,
Amster-dam.
Zaslaver, A., S. Kaplan, A. Bren, A. Jinich, A. Mayoet al., 2009 Invariant distribution of promoter activities inEscherichia coli. PLOS Comput. Biol. 5(10): e1000545.
Communicating editor: J. Lawrence
GENETICS
Supporting Information http://www.genetics.org/lookup/suppl/doi:10.1534/genetics.113.150631/-/DC1
How Biochemical Constraints of Cellular Growth
Shape Evolutionary Adaptations in Metabolism
Jan Berkhout, Evert Bosdriesz, Emrah Nikerel, Douwe Molenaar, Dick de Ridder, Bas Teusink, and Frank J. BruggemanContents
S1 Derivation of enzyme production cost based on underlying transcription and translation
network SI3
S1.1 Derivation of enzyme production cost based on energy or resources constraint . . . SI3 S1.2 Derivation of enzyme production cost based on ribosomal occupancy constraint . . . SI4 S1.3 Derivation of enzyme production cost based on RNA polymerase availability constraint . . . SI4
S2 The specific growth rate is a J/R measure SI6
S2.1 A subnetwork perspective . . . SI7
S3 Derivation of the cost function SI8
S4 Derivation of the benefit function SI9
S5 Disentangling of the interplay between metabolic system kinetics and enzyme production
cost using cost and benefit functions SI10
S6 Maximization of the return of investment SI12
S6.1 Maximal difference between benefit and cost corresponds to maximization of return of investmentSI12
S7 Derivation of relationship between flux control coefficient and constraint function SI13
S7.1 Derivation of the relationship between flux control coefficients and the constraint function . . SI13
S8 Derivation of an enzyme fitness landscape SI15
S8.1 Introduction to the main concept and equations . . . SI15 S8.2 Derivation of the enzyme fitness potential . . . SI15 S8.3 Ordering enzymes according to evolutionary urgency . . . SI16 S8.4 Illustration of the slope of a fitness landscape . . . SI18
S1
Derivation of enzyme production cost based on underlying
transcription and translation network
Evolutionary optimization of fitness will in general occur under constraints. Those constraints can have various origins, such as physical, biochemical or thermodynamic. For instance, total available ATP for biomass synthesis, diffusion timescales, available membrane space, or available cell volume can act as constraints. We here aimed to derive such constraints from underlying biochemical networks. We considered three constraints: (1) a resource (or energy) constraint; (2) a ribosome capacity constraint and (3) a RNA polymerase abundance constraint. In the next sections we will derive the origins of these constraints.
S1.1
Derivation of enzyme production cost based on energy or resources
con-straint
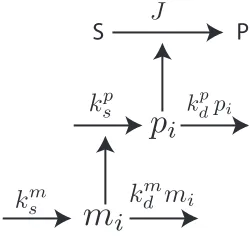
Let us consider the gene network as depicted in Figure S1. In this network, the mRNA product of gene i, indicated as mi, is synthesized and degraded with rate constants: ksmandkdm, respectively. The mRNAmi stimulates protein synthesis of pi and pi is degraded with rate constant k
p
d. The conversion of substrate S into product P is catalyzed bypi, with steady state fluxJ.
S
P
Figure S1. Overview of biochemical network. The product of genei, mi stimulate the synthesis of protein pi, which in turn catalyses the conversion fromS toP at the metabolic network. Both,mi andpi have specific synthesis (s) and degradation (d) rates, with first-order rate constantk.
The enzyme production cost for enzymeiis defined as the amount of resources required per unit enzyme per unit time. Therefore, the enzyme production cost consists of the cost for transcription of the corresponding gene(s) and the cost of translation of the mRNA(s). For the network depicted in Figure S1 this leads to:
ωi=
Jpωp
i
pi
+J
mωm
i
pi
(S1)
whereJmandJpare respectively the rate for transcription and translation, andωm
i andω
p
i, the corresponding cost of transcription and translation per unit rate. Assuming mass-action kinetics for transcription and translation we can write:
ωi=
kdp pi ω
p i
pi
+k m
d mi ωmi
pi
(S2)
The characteristic life times (τ) will generally equal one over a degradation rate constant: 1/kd. As a result, we obtain the equation that characterizes the enzyme production cost:
ωi =
ωm
i mi
τm
i pi
+ω p i
τip
(S3)
This equation can easily be extended with relevant properties for other metabolic networks, such as, for instance, an additional cost term for the misfolded proteins. Note that the ratiomi/pi can be expressed in terms of rate constants,kpd/kp
s.
S1.2
Derivation of enzyme production cost based on ribosomal occupancy
con-straint
Here we assume that the amount of cellular protein is limited by the availability of ribosomes and consequently by the competition of mRNA’s for ribosomes. The total amount of ribosome, r, equals the free amount,rF, and the total bound poolmr=P
jmjrthen,
r=rF+mr=rF+
X
j
mjr (S4)
Note thatrdepends on the specific growth rateµ, we don’t need this dependency now so it is omitted. The total fraction of occupied ribosome, φ, is approximately fixed in E. coli and several other microorganisms across growth conditions and equals,
φ=mr
r =
X
j
mjr
r (S5)
The resource requirement of a mRNA, later we determine the requirement for its protein product, is given by the fraction of all ribosomes it occupies,
Cj =
mjr
r (S6)
So, we have
φ=X
j
Cj (S7)
The concentration of mjr can be approximated by withKj as the dissociation constant of thej-th mRNA for the ribosome,
mjr=r
mj
Kj
1 +P
k
mk
Kk
(S8)
So, we have
Cj =
mjr
r =
mj
Kj
1 +P
k
mk
Kk
(S9)
The concentration of the correspond proteinpj with translation rate constantkj and degradation rate con-stantδj equals,
pj=
kj
δj
mjr (S10)
The ribosome resource consumption expressed for protein now becomes,
Cj=
mjr
r =
pjδj
kjr
(S11)
So, the constraint equation becomes
rφ=X
j
rCj =
X
j
ωjpj (S12)
This last equation sets a bound to the protein concentration in a cell and derives from the limited availability of ribosome for translation of mRNA. Theωj, the specific resource consumption of proteinj now equals,
δj
kj.
S1.3
Derivation of enzyme production cost based on RNA polymerase
avail-ability constraint
The derivation of the biochemical constraint resulting from the competition for a limiting pool of RNA polymerase is equivalent to the derivation in the previous section. We start from the total pool, r, which equals the sum of the unbound polymerases,rF, and the bound pool,Piri,
r=rF+
X
i
ri (S13)
At steady state, the level of mRNAj equals,
mj =
km
j rj
δm
j
, (S14)
where km
j equals the transcription activity constant and δjm the mRNA degradation rate constant. The protein level of enzymej equals,
pj=
kpjmj
δpj =
km
j k
p
jrj
δm
j δ
p j
(S15)
where kpj equals the translation rate constant and δpj the proteins degradation rate constant. From the last equation we obtain an expression forrj in term of the protein level,
rj =
δm
j δ
p j
km
j k
p j
pj (S16)
If we assume that the bound RNA polymerase pool is approximately fixed then the bound fraction φis a constant,
rφ=r
P
iri
r =
X
i
ωipi, (S17)
where ωi is defined as
δm
j δ p j
km
j k p j
. Again the linear protein constraint emerges from a biochemical constraint.
S2
The specific growth rate is a
J/R
measure
A central argument in our work is that the selection pressure in batch cultures of bacteria is the specific growth rate and that this quantity is maximized in evolution by optimal partitioning of proteins over growth processes, given a bound on the cellular protein content that derives from a biochemical constraint in the growth process, such as limited availability of RNA polymerases, ribosomes or energy. We will now illustrate why the specific growth rate is so tightly linked to the biochemical constraint, which sets a limit to a resource (R) for growth.
The specific growth rate,µ(hr−1), is related to the yield on the growth substrate, (S), denoted byYX/S (in gram dry weight per mol substrate) and the uptake rate of the growth substrate, JS, in mol substrate per gram dry weight per hr,
µ=YX/SJS =
JS
1/YX/S = JS
R∗ (S18)
R∗is also a resource requirement but then for growth substrate, i.e. it’s units are molSper gram dry weight. But we are interested in an intracellular growth resource such as ATP equivalents. To make this explicit we decompose R∗ into separate factors,
R∗= 1
YAT P /S
1
YX/AT P
= 1
YAT P /S
R
αeT
(S19)
1
YAT P /S equals the amount of substrate required to make one mole of ATP; this quantity depends on the pathways that the organism uses to make ATP.YX/AT P is the yield of biomass expressed as gram dry weight per 1 mol of ATP. 1
YX/AT P is the ATP resource requirementR =
P
iωiei divided by 1 gram dry weight; 1 gram dry weight can be expressed in terms of the total protein content eT =Piei (ei are now enzyme concentrations) asαEwhereαcontains the cellular protein fraction and protein weight.
Consideration of equation S18 and S19 gives,
µ=YX/SJS =
JS
1 YAT P /S
R
αeT
, (S20)
which shows thatµandJS/Rare linked as described in the main text. Since, the resource equation R = P
iωiei does not set the protein content eT for the same amount of resource, different protein amounts can obtained leading to changes in flux, J. Because J is first-order homogeneous function of the protein content, i.e. λJ =J(λeT), we have, if theYX/S is fixed, λµ=µ(λeT), which shows that analysis of flux gives rise to same results for the cost and benefit as the analysis of µ. Therefore, the specific growth rate can change because the flux changed at a constant yield, which is a stoichiometric property (calculable with FBA),
δµ=YX/SδJS=YX/S
X
i ∂J
∂ei
δei (S21)
If theYX/S is fixed thenR∗ is fixed,
δR∗= ∂R
∗
∂YAT P /S
δYAT P /S+
∂R∗
∂RδR+
∂R∗
∂α δα+
∂R∗
∂eT
δeT = 0 (S22)
We also assumedRto be fixed, i.e. same amount ofAT P is available, and if we assume in addition that the pathways are used forAT P fromS then alsoYAT P /S is fixed and, therefore,
∂R∗
∂α δα=−
∂R∗
∂eT
δeT (S23)
The protein content of the cell (part ofα) must have been changed as a result of a change in the total amount of protein per cell. Then, we haveδeT =Piei which leads to a flux change ofδJ =Pi∂e∂J
iδei.
This section therefore showed the linkage betweenµandR, and how changes in the protein contentδeT at fixedRcan lead to an uptake flux changeδJ, which causes a change in the specific growth rateµat fixed biomass yield on substrate,YX/S. This indicates that theµin equation S20 changes becauseJschanges due to a change in the eT and a compensating change in α. This is the mechanism for evolutionary change of metabolic pathway activity resulting from specific growth rate selection given a biochemical constraint that we discuss in this paper.
S2.1
A subnetwork perspective
One of the questions asked in the main text is whether we can study evolutionary adaptation in µ at the level of a single pathway by only considering the resource amount of the pathway and repartitioning this over pathway enzymes to enhance fitness. Then δR= 0 =δRpathway+δRrest. If we then demand only enzyme changes pathway then ∀i: δRrest,i = 0 and all enzymes in the remained of the network stay fixed. Then, the enzyme changes considered in the previous section only concern pathway enzymes.
S3
Derivation of the cost function
We define a vector of optimal enzyme concentrations, eopt, given an available amount of resource R that maximizes the pathway fluxJ of interest to the valueJopt,
Jopt(R) =J(eopt(R)).
For metabolic pathways, this flux is a first-order homogeneous function of the enzyme concentration such that αJ =J(αe) (1). This property holds for general enzyme kinetics as long as there are no complexes of different enzymes catalyzing metabolic reactions; i.e. in the absence of metabolic channeling (8).
Then the cost of an enzymeiis defined as,
Ci(ei, R) =
J(eopt(R))−J(eopt(R−ωie¯i))
J(eopt(R))
(S24)
where J(eopt(R−ωie¯i)) denotes the maximal flux at the optimal enzyme distribution but at a lower value of R due to the expression of dummy protein. The reduction in ”useful” resource R−ωie¯i can be written as a multiplication of the available resource Rby the factor 1−ωie¯i
R . BecauseJ andR are each first order homogeneous functions with respect to the enzyme concentration (αR=R(αe)), dummy enzyme expression leads to a reduction ofJoptby the factor 1−ωRie¯i. Substitution of this relationship into equation S24 reveals that the functional cost of enzymeiequals its fractional resource usage,
Ci(ei, R) =
ωie¯i
R (S25)
S4
Derivation of the benefit function
To define the benefit of enzyme i at concentration ei we define the fractional change in the flux relative to the optimal state,
f(ei) =
J(ˆeopt(ei, R))−J(eopt(R))
J(eopt(R))
where J(ˆeopt(ei, R)) denotes the flux vector where all enzymes concentrations are at their optimum corre-sponding to resource constraintR except for enzymei, which is at concentrationei. Accordingly, we define the enzyme vector,
ˆ
eopt(ei, R) =
eopt1 , . . . , ei, . . . , eoptn
Hence, the following relationship holds: ˆeopt(eopti , R) =eopt(R). Using this definition for f, it follows that
the relative flux difference is zero, when ei =eopti (see Figure S3). It can be seen thatf becomes negative
whenei< eopti . To avoid this, we define the benefit of enzyme i,Bi(ei) as,
Bi(ei, R) = f(ei) +f(0)
= J(ˆeopt(ei, R))
J(eopt(R))
(S26)
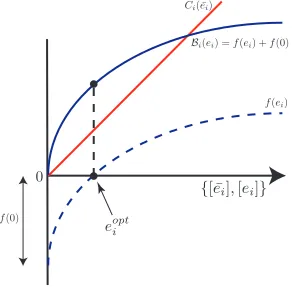
Here we used a property of linear metabolic pathways: J(ˆeopt(ei = 0, R)) = 0. In this formulation, benefit corresponds to intuition: it is positive and will typically be an increasing function with enzyme concentrations. Since we used the optimal state as reference state, the relative flux difference is zero ateopti , as indicated by the arrow (Figure S3). Consequently, at concentration ofei < e
opt
i the relative flux difference is negative (dashed line). To prevent this we add the term, without ei being present, which is denoted byf(0). The benefit function consists thus of two terms: f(ei) +f(0). The addition off(0) does not influence the optimal concentration as indicated by the vertical dashed line.
Figure S3. Illustration of the cost and benefit function as function of dummy ( ¯ei) and useful enzyme (ei), respectively.
S5
Disentangling of the interplay between metabolic system
kinet-ics and enzyme production cost using cost and benefit functions
With the general definitions of cost and benefit as described in the main text, the interplay between pathway kinetics and enzyme costs will be addressed. We will consider a simple toy model, which consists of two enzymatic steps. Both catalyzed by irreversible product-sensitive Michaelis-Menten kinetics. We address three different issues, all relevant for biochemical pathways: i) changing the affinity of the first enzyme for it’s external substrate, ii) changing the maximal capacity of the first enzyme and iii) different enzyme production costs for the enzymes in the pathway.
All simulations are carried out with the constraint function Φ(e) =ω1e1+ω2e2, and Φ(e) ≤R. The resource availability R and all kinetic parameter values are fixed, except for the perturbed parameter as just described. We then optimize the steady state flux using the enzyme concentrations and corresponding metabolite levels as variables. We explain these “direct” optimizations in terms of a cost and benefit analysis. For all three perturbations we present our results as a panel of three plots: in the first plot the cost (red) and benefit (blue) functions are plotted, the second plot shows the benefit minus cost (green) function and the third plot corresponds to the direct optimization where we plot the flux relative to the Vmax. In all three plots the curves are plotted as function of the first enzyme. The solid thick line corresponds to the original parameter values, with a black dot indicating the optimum, and the dashed line to the perturbed case, with a black triangle indicating the optimum. The maximal difference between the benefit and cost curve(s) is indicated with a dashed gray line (Figure S4).
To simulate a change in the affinity of the first enzyme, we decreased the affinity constant with a factor 10 (from 1 to 0.1). Note that a decrease in Km reflects a higher affinity. We find that an increase in affinity leads to a lower optimal expression level. This is reflected by a steeper benefit function, which also saturates at a lower level, indicating that there exists a trade-off between affinity and maximal activity.
The perturbation in kcat was performed by an increase from 2 to 20 (note, that the kcat ofe2 is equal to 10). Increasing the kcat ofe1, results in a lower concentration in the optimum. However, due to the resource constraint, investing a lot resources in an enzyme with a low catalytic capacity is at the expense of other enzyme(s). Therefore, we observe a higher optimum at the benefit minus curve but at the same time a lower steady-state flux.
We also simulated the effect of different enzyme cost strategies: reference values used areω1= 0.25, ω2= 0.75, and for the perturbed case we set these parameters to: ω1= 0.9, ω2= 0.1. We found an inverse relation between enzyme cost and its optimal level: upon an increase of the ω optimal level decreased. However, the story is a bit more complicated because due to the resource constraint; a change in the ω0s will lead to different total enzyme levels and hence different optimal flux values. This is also reflected by the plot showing the direct optimization: ife1=etotal thene2=0 and henceJ = 0. For the reference conditions this is achieved at e1 = (R−e2·w2)/w1 = (1−0·0.75)/0.25 = 4. Following a similar calculation we obtain
e1 = 10/9 for the perturbed scenario. The explanation for this behavior becomes apparent from inspecting the cost and benefit curves: a higher specific enzyme costs makes a steeper cost function and consequently, the optimal enzyme concentration decreases.
Note that for the first two perturbations, the cost line (red) is not affected, e.g. it is entirely independent of enzyme kinetics. This is also what we found in the main text. The benefit functions on the other hand does change for all three perturbations.
0.0 0.2 0.4 0.6 0.8 1.0 1.2 1.4 0.0 0.2 0.4 0.6 0.8 1.0 1.2 1.4 ËË Ù Ù
0.0 0.2 0.4 0.6 0.8 1.0 1.2 1.4
-0.2 0.0 0.2 0.4 ËË Ù Ù
0.0 0.2 0.4 0.6 0.8 1.0 1.2 1.4 0.0 0.2 0.4 0.6 0.8 1.0
0.0 0.2 0.4 0.6 0.8 1.0 1.2 1.4 0.0 0.5 1.0 1.5 ËË Ù Ù
0.0 0.2 0.4 0.6 0.8 1.0 1.2 1.4
-0.2 0.0 0.2 0.4 ËË Ù Ù
0.0 0.2 0.4 0.6 0.8 1.0 1.2 1.4 0.0 0.1 0.2 0.3 0.4 0.5
0 1 2 3 4 0.0 0.5 1.0 1.5 2.0 2.5 ËË Ù Ù
0 1 2 3 4
-0.2 0.0 0.2 0.4 0.6 ËË Ù Ù
0 1 2 3 4
0.00 0.02 0.04 0.06 0.08 0.10 0.12
perturbation in affinity (Km) perturbation in capacity (kcat) perturbation in enzyme cost (ω)
co st , b e n e fit co st - b e n e fit J/ Vma x
concentration of e1
Figure S4. Interplay between enzyme kinetics and enzyme production cost on the optimal enzyme
distribution. For a two-enzyme metabolic network three perturbations were applied: a change in the affinity of the first enzyme for it’s substrate (left panel), a change in the catalytic capacity of the first enzyme (middle panel) and a change in the enzyme production costs (right panel). In all plots the solid line corresponds to the original parameter set and the solid line the to perturbed scenario. The upper row of plots shows the cost (red) and benefit (blue) as function of the concentration ofei. The gray dashed lines indicated the maximum between benefit and cost. The middle row of plots corresponds to the benefit minus cost functions. The optimum of these curves is indicated by a solid black circle (reference parameters) and triangle (perturbed parameters, and corresponds to the maximal difference between benefit and cost curves. The lower row of plots shows the flux relative to the Vmax of the first enzyme. Simulations were performed using the following reaction rate: vi =kcati·ei·s/(1 +s/Kms +p/Kmp) and unless otherwise noted,
parameter values were chosen as follows: kcat1,2= 10;KmS1,2= 1 and
0.1;KP
m1,2= 5;S= 1, P = 1;R= 1, ω1,2= 1
S6
Maximization of the return of investment
Consider the return on investment of a metabolic pathway, defined J(e)/R(e), where e = {ei, . . . , er} is the vector of enzyme concentrations, J is the steady state flux though the pathway andR is the amount of resources needed to maintaine.
We are interested the enzyme levels that maximize the return on investment:
Maximize : J(e)
R(e) (S27)
Note that there is a subtle difference between this objective and maximizing J for a giving amount of R. However, as we will show below, for linear cost functions the optima of these two objectives are equivalent. Since lnxis a monotonically increasing function,f(x) and ln(f(x)) generally have the same maximum, i.e. ln arg(max(lnf(x))) = arg(max(f(x))). Thus, equation S27 is equivalent to
Maximize : ln(J(e)
R(e)) = ln(J(e))−ln(R(e)) (S28)
Clearly, maximizing equation S28 for enzymeirequires
0 =ei
∂lnJ(e)
∂ei
−∂lnR(e)
∂ei
. (S29)
The first term we identify as the flux control coefficient of ei, CiJ. Now, consider the linear cost function
R=
r
X
j=1
wjej. (S30)
for which we see thatei
∂lnR(e)
∂ei =wiei/R. The condition for optimality ofei is thus:
CiJ =
wiei
R . (S31)
Note that this condition does not require the other enzyme, ej6=i, to be optimal. Condition S31 gives the optimal level ofei for any distribution of the other enzymes.
S6.1
Maximal difference between benefit and cost corresponds to maximization
of return of investment
What remains to be shown at this stage is that a maximization of the return on investment, i.e. of J/R, indeed implies a maximization ofBi(ei, R)− Ci(ei, R). At the optimal state (ateopt(R)) we obtain,
∂Bi(e
opt
i , R)
∂ei
−∂Ci(e opt
i , R)
∂e¯i
=∂lnJ(eopt(R))
∂ei
−ωi
R = 0
Multiplication of this equation witheopti gives rise to the following expression at the optimal state:
∂lnJ(eopt(R))
∂lnei
= ωie opt i
R . (S32)
On the left hand side we identify the scaled flux control coefficient of enzymei, CiJ, as defined in metabolic control analysis (MCA) (4). Interestingly, this result is in agreement with findings from Heinrich and co-workers, who arrived at the same relationship by maximizing the flux through a metabolic pathway under the constraint of fixed total enzyme concentration; i.e. maximization of J/R (7; 6; 2; 3) (examples of this relation for other constraint functions are shown below in Section S7).
S7
Derivation of relationship between flux control coefficient and
constraint function
Let us consider a linear metabolic network ofrreactions under the following constraint,
g(e) =
r
X
i=1
ωiei=
r
X
i=1
ci=c (S33)
We assume that the flux is maximal and that the above constraint is true. Using the Lagrange multiplier,
λ, we can find a relationship between the flux derivatives to the enzyme concentrations and the enzyme constraint,
∂
∂ei
J−λ
r
X
i=1
ωiei−c
!!
= 0 (S34)
This gives then for everyei,
∂J
∂ei
−ωiλ= 0 (S35)
From the definition of the flux control coefficient we obtain,
CiJ= ∂J
∂ei
ei
J =ωiλ
ei
J (S36)
The summation theorem of flux control coefficients leads to,
r
X
i=1
CiJ = λ
J r
X
i=1
ωiei = 1 (S37)
Equation S33 then shows that,
J
λ =c (S38)
So the control coefficients at optimal states becomes,
CiJ= wiei
c =
ci
c (S39)
If allwi’s are 1 andc=etotal(total enzyme concentration), we obtain the familiar relationshipCiJ =ei/etotal (2).
S7.1
Derivation of the relationship between flux control coefficients and the
constraint function
Now we consider the same pathway with the more general constraint,
g(e) =c (S40)
The Langrange multiplier now relates to the flux derivative in the optimum as,
∂J
∂ei
− ∂g
∂ei
λ= ∂J
∂ei
−λ= 0 (S41)
From the definition of the flux control coefficient we obtain,
CiJ= ∂J
∂ei
ei
J =
∂g
∂ei
λei
J (S42)
The summation theorem of flux control coefficients leads to,
r
X
i=1
CiJ = λ
J r
X
i=1
∂g
∂ei
ei = 1 (S43)
Since,
J
λ =
r
X
i=1
∂g
∂ei
ei (S44)
and the flux control coefficient then becomes,
CiJ =
∂g
∂eiei
Pr
i=1
∂g
∂eiei
(S45)