Predicting Employee Sustainability Using
Machine Learning
Harish.R 1, Harish.N. K 2 , Tarun.N 3, Nithya.M.R4
U.G. Student, Department of Computer Engineering, Meenakshi Sundararajan Engineering College, Kodambakkam,
Chennai, Tamilnadu, India1,2,3
Associate Professor, Department of Computer Engineering, Meenakshi Sundararajan Engineering College, Chennai,
Tamilnadu, India4
ABSTRACT: This paper aims to integrate the concepts of Machine learning and predictive analytics into developing an approach to predict Employee Sustainability in the industry. The existing model uses a Data mining approach to calculate the employee churn rate using the various existing algorithms. The main idea of our paper is to develop a Machine Learning model which uses the Regression techniques to predict how long an employee will sustain in an industry. The specific algorithm which is used here is the Multiple Linear Regression Algorithm which takes in significant parameters and estimates the approximate numerical value of Sustainability. Our model is able to yield good results when compared to the existing system.
KEYWORDS: Employee Churn Prediction,Data Preprocessing, Multiple Linear Regression , Machine learning , Predictive Analysis.
I. INTRODUCTION
Machine learning is a type of artificial intelligence (AI) that allows software applications to become more accurate in predicting outcomes without being explicitly programmed. The basic premise of machine learning is to build algorithms that can receive input data and use statistical analysis to predict an output value within an acceptable range. The processes involved in machine learning are similar to that of data mining and predictive analytics.
Predictive analytics is a form of advanced analytics that uses both new and historical data to forecast activity, behavior and trends. It involves applying statistical analysis techniques, analytical queries and automated machine learning algorithms to data sets to create predictive models that place a numerical value on the likelihood of a particular event happening.
Employee churn is a booming problem in the software field, where a company may suffer the loss of a skilled employee due to his/her migration to another company. This can create a loss in resources when required to replace the employee. An Employee Sustainability model is built using machine learning to solve this issue. This model predicts the maximum years of sustainability of an employee in an organization by using the relevant details.
II. RELATEDWORK
In the recent years, the sustainability of an employee has been one of the major problem in every industry. This is because of several reasons like work environment, work place, family situation, pay scale etc. The organization suffers a great loss in time and finance to replace an employee. This issue has grabbed the huge attention of many researchers in developing a solution to this problem.
For instance, In the year 2017, [2] Ibrahim Onuralp Yigit proposed a system to predict the employee churn using Data mining techniques. In this study, the current and the past records of the employees are analysed and features with high correlated values are neglected using correlation method. Well known data mining techniques namely, Decision Tree, Naive Bayes, Logistic Regression, Support Vector Machine (SVM), K-Nearest Neighbor(KNN), and Random Forest are applied to the dataset and the best method is taken for the prediction. The results of this method have been analysed by their accuracy, precision, recall, and F-measure values. Finally, a feature scaling method is implemented to select the most important features and the best suitable method is implemented on the datasets. Results of the study shows that it requires enormous amount of human effort and time in predicting the employee churn.
In another study in year 2016, [4]Anusorn Charleonnan, Thipwan Fufaung, Tippawan Niyomwong, Wandee Chokchuey pattanakit, Sathit Suwannawach, Nitat Ninchawee developed a classification model to predict the chronic kidney disease using clinical data. Machine learning methods like including K-nearest neighbors (KNN), support vector machine (SVM), logistic regression (LR), and decision tree classifiers were applied to the dataset and the best suitable algorithm was used for the prediction. The support vector machine(SVM) algorithm h predicts the result with higher accuracy and is appropriated for predicting the chronic kidney disease.
In year 2014, [3]Girma Kejela, Rui Maximo Esteves, and Chunming Rong proposed a model to predict the missing values, or to replace incorrect readings due to malfunctioning of sensors in an oil and gas company. Big data analytics tools like RHadoop, Mahout, Spark etc were used to retrieve the sensored data and machine learning models were applied on it for the prediction of missing measurements. Techniques like Linear regression and gradiant boosting were used for the better results. In this work, only the failure of one sensor was taken into consideration and the model has been built. But there can be many number of sensors that fails to predict missing values at regular intervals.
III.PROPOSED SYSTEM
In the existing system, a predictive model was built using data mining techniques. The problem in that model was that it required more human effort and consumed more time which are not desirable characteristics from an industrial standard point. To overcome this problem, a reliable and user-friendly model is implemented using machine learning techniques. Machine Learning is more easily accessible and much more state-of-the-art than the existing techniques.
The prediction of the sustainability can increase the judgment of the recruiter on whether or not to hire a particular candidate or not. There are some very important parameters which are chosen to make this prediction as to increase the accuracy of the prognosis in years.
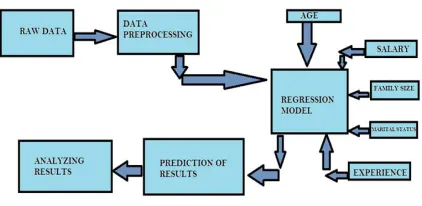
In Figure 1, the raw data is collected and preprocessed by applying various techniques. The pandas library for data analysis and processing is used to perform the various techniques like the reading of the dataset, computing the missing values using the imputer function, Encoding categorical variables, Scaling the data and bringing them into a particular range for achieving higher accuracy.
After preprocessing the dataset, Multiple linear Regression algorithm is applied on to the significant parameters, like the age of the candidate, previous salary, Family size, marital status, Experience and the company switches he/she has made to name a few.
The Multiple Linear Regression Algorithm then takes in these parameters as its own and applies the model on it, to predict the sustainability of the candidate in years. The predicted values are then analyzed and then the recruiter decides whether or not to hire.
Figure 1. Working of the model
Multiple Linear regression is an extension of simple linear regression. It is used when we want to predict the value of a variable based on the value of two or more other variables. The variable we want to predict is called the dependent variable. The variables we are using to predict the value of the dependent variable are called the independent variables.
The representation is a linear equation that combines a specific set of input values (x) the solution to which is the predictedoutput for that set of input values (y). As such, both the input values (x) and the output value are numeric. The linear equation assigns one scale factor to each input value or column, called a coefficient and represented by the capital Greek letter Beta (B). One additional coefficient is also added, giving the line an additional degree of freedom (e.g. moving up and down on a two-dimensional plot) and is often called the intercept or the bias coefficient.
The model is expressed as DATA = FIT + RESIDUAL, where the "FIT" term represents the expression 0 + 1x1 + 2x2 + ... pxp. The "RESIDUAL" term represents the deviations of the observed values y from their means y, which are normally distributed with mean 0 and variance. The notation for the model deviations is.
This is an example graph which visualizes the results of the particular linear regression model which consists of some parameters such as the salary and the experience of a certain employee dataset. The resultant line is a straight line which is a best fit line which covers all the points which have been plotted by the training set of the dataset.
The working of this model consists of varied steps like data preprocessing, applying algorithms etc. The steps concerned in building the model are as follows:
1) Collect and analyze the dataset that consists of current and past worker records.
2) Quantize the dataset and apply feature scaling technique. 3) determine important variables from the dataset that are needed for the prediction
.4) Apply Multiple Linear Regression algorithm.
5) Predict the value of sustainability (in years) of the candidate.
6) Decide whether to accept/reject the candidate based on the predicted values.
IV.EXPERIMENTAL RESULTS
Figures shows the results of Predicting Employee Sustainability using Machine learning techniques based on Multiple Linear Regression algorithm. Figs. 2, shows the dataset of the employees working in the organization and Figs.3, displays the actual values and predicted values of the employees
Figure 2. Dataset Figure 3. Predicted Values
To Predict the number of years the employee will be in the company, Multiple linear regression algorithm is applied on this dataset and the values are predicted with the help of past records.
V. CONCLUSION
[3] Girma Kejela, Rui Maximo Esteves, and Chunming Rong,"Predictive Analytics of Sensor Data Using Distributed Machine Learning
Techniques", Cloud Computing Technology and Science (CloudCom), 2014 IEEE 6th International Conference,2015.
[4] Anusorn Charleonnan, Thipwan Fufaung, Tippawan Niyomwong,"Predictive Analytics for Chronic Kidney Disease Using Machine Learning
Techniques", Management and Innovation Technology International Conference (MITicon), 2016.