Classification of the Lung Diseases from CT Scans by
Advanced Segmentation Techniques using Genetic
Algorithm
C. Bhuvaneswari
Head, Department of Computer Science
Theivanai Ammal College for Women (Autonomous)
Villupuram
P. Aruna
Professor, Department Of Computer Science and
Engineering Annnamalai University
Chidambaram
D. Loganathan
Professor & Head, Department of Computer Science and
Engineering
Pondicherry Engineering College, Pondicherry
ABSTRACT
Lung diseases are the most common disease which causes mortality worldwide .In this study, the computed tomography images are used for the diagnosis of the lung diseases such as normal, small cell lung carcinoma, large cell lung carcinoma and non small cell lung carcinoma by the effective extraction of the global features of the images and feature selection techniques. The images are recognized with the statistical and the shape based features. The texture based features are extracted by Gabor filtering, the feature outputs are combined by watershed segmentation and the fuzzy C means clustering. Feature selection techniques such as Information Gain, correlation based feature selection are employed with Genetic algorithm which is used as an optimal initialisation of the clusters. The dataset of lung diseases for four classes are considered and the training and testing are done by the Naive Bayes and random forest classifier. Results of this work show an accuracy of above 80% for the correlation based feature selection method using naive bayes classifier.
General Terms
Dataset, Optimal, statistical, Texture, Training.
Keywords
Global features, Genetic Algorithm, Image segmentation.
1.
INTRODUCTION
The term lung disease refers to many disorders affecting the lungs such as asthma, chronic obstructive pulmonary disease, infections like influenza, pneumonia and tuberculosis, lung cancer and many other breathing problems. Some lung diseases can lead to respiratory failure. Smoking is directly responsible for almost 90 percent of lung cancer deaths. Smoking might act to increase the frequency or severity of infections.Lung cancer, an abnormal, continual multiplying of cells that can result in lumps, masses, or tumors can begin in the lining of the bronchi or other areas of the respiratory system. Other symptoms may include constant chest pain, shortness of breath, wheezing, recurring lung infections, bloody or rust-colored sputum, hoarseness, swelling of the neck and face, pain and weakness in the shoulder, arm, or hand, and unexplained fever.
In this paper, an automated approach for classification of the lung diseases such as large cell lung carcinoma, small cell lung carcinoma using CT images are presented. The CT image
to 128 by 128 JPEG images. The evaluation of the proposed system of lung diseases detection has been performed by using a set of 59 CT images (normal-15 images, small cell lung carcinoma-20 images, large cell lung carcinoma-10 images and non small cell lung carcinoma-14 images).The original image is converted to gray scale image. After that, removal of the noises and contrast enhancement is done for obtaining the enhanced images. The Gabor filter is used to extract the texture features of the images at different orientations. Fuzzy c-Means clustering and watershed segmentation is applied to segment the image and then the genetic algorithm based feature selection by the Information Gain, correlation based feature selection is done. Finally the Naive Bayes classifier is used to classify the images and the results are shown with the performance measures.
The paper is organized as follows: Section 2 deals with the related works available in literature. Section 3 explains the proposed work. In the section 4 experiments and results is detailed and section 5 deals with the performance analysis and section 6 deals with the findings of the study.
2.
LITERATURE REVIEW
Manish Kakar et al., [1] proposed a method based upon the texture features, as extracted from Gabor filtering, our choice is based on the evidence from psychophysical research the FCM can be used for segmentation of CT of thorax given that the cluster centres are initialized by using a Genetic Algorithm. From the segmentation results, the accuracy of delineation was seen to be above 90%.For automatically recognizing the segmented regions, an average sensitivity of 89.48%was achieved by combining cortex-like, shape and position-based features in a Simple SVM classifier.
Ribeiro, et al., [2] proposed StARMiner (Statistical Association Rule Miner) that aims at identifying the most relevant features from those extracted from each image, taking advantage of statistical association rules. The proposed mining algorithm finds rules involving the attributes that discriminate medical image the most. The feature vectors condense the texture information of segmented images in just 30 features.
method’s classification accuracy measured. Investigate the efficacy of feature selection and reduction using Association Rule Mining (ARM) on medical images. Naïve Bayes and Classification and Regression Tree (CART) classifiers were used for evaluating the accuracy of proposed method. Uppaluri et al. [4] have developed a general system for regional classification by using small areas that were classified into one of the six categories based upon 15 statistical and fractal texture features.
Shyu et al, [5] have developed a system that retrieves reference cases similar to the case at hand from a proven database. In their approach they have combined global and anatomical knowledge, combining features from several pathological regions and anatomical indicators per slice. The regions are however manually delineated rather then automatically detected. In all the studies mentioned above, some sort of grid over slices/ROI marking or marked pathologies beforehand are needed for training, thus a supervised approach is used.
3. PROPOSED WORK
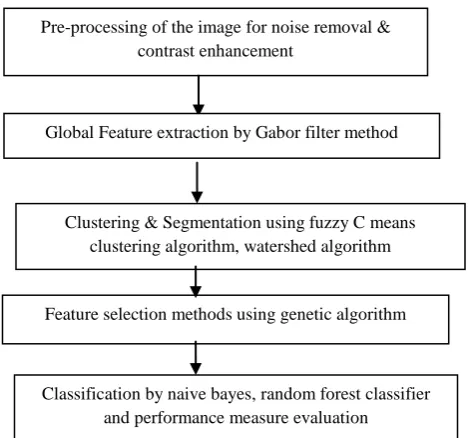
The following is the block diagram of the proposed system.
Fig 1: Block diagram of the proposed work
3.1 PRE-PROCESSING
Image pre-processing can significantly increase the reliability of an optical inspection.
a. The CT lung disease image is taken as an input image. b. The image is resized to 128 by 128of16 x16window and grey scale image is extracted
c. Median filter technique is applied to remove the noise from the images.
a. Input CT image:
A combination of normal, small cell lung carcinoma, large cell lung carcinoma and non small cell lung carcinoma images are taken for preprocessing. The size of the input retinal images is 256×256 pixels. It can be preprocessed with the help of the following steps. Fig. 2 shows the input CT image of lung diseases.
(a)
(b)
(c)
[image:2.595.323.533.69.418.2](d)
Fig 2. Input images of normal, small cell lung carcinoma, large cell lung carcinoma and non small cell lung
carcinoma.
b. Resizing of the image
The image is resized to 128 by 128 of 16 x16window and grey scale image is extracted. The imresize ( ) of the image returns image B that is scale times the size of A.
[image:2.595.46.281.310.529.2]Fig 3. Resizing of the grey scale image
Fig 3. Shows the resizing of the image for the effective preprocessing steps that will be used for the median filter. c. Median filter technique
To remove noise and enhance contrast to make it suitable for further processing, median filter was used for noise removal. For contrast enhancement, intensity values in the image were mapped such that a minimal percentage of data is saturated at low and high intensities to prepare it for feature extraction. Pre-processing of the image for noise removal &
contrast enhancement
Global Feature extraction by Gabor filter method
Feature selection methods using genetic algorithm
Classification by naive bayes, random forestclassifier and performance measure evaluation Clustering & Segmentation using fuzzy C means
[image:2.595.333.521.508.606.2]
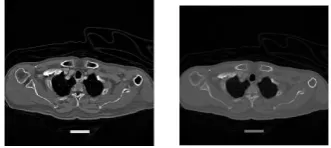
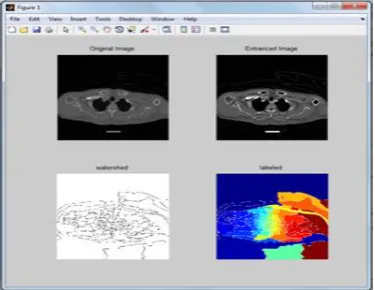
(a) (b) Fig 4.Pre-processed images of patients selected randomly
The original and the preprocessed image of the lung diseases are processed and the images are depicted.
3.2 FEATURE EXTRACTION
After the preprocessing steps the preprocessed images are obtained. Feature extraction is a special form of dimensionality reduction where Gabor Filtering is chosen in order to extract texture features. The global Features that describe an entire image are extracted, calculations on the pixel values to get other numerical representations are known asfeature vectorsand they represent particularfeatures.
The Gabor filter is used to extract the texture features from the preprocessed image. The coding is implemented using the Matlab. The following are the steps done in this work for feature extraction
1. Creates a flat, disk-shaped structuring element, of the radius R which specifies the radius which is a nonnegative integer.
2. Performs the morphological bottom-hat filtering on the greyscale or binary input image, which returns the filtered image.
3. The structuring element returned by the strel function must be a single structuring element object, not an array containing multiple structuring element objects.
4. The Top-hat filtering and bottom-hat filtering are used together to enhance contrast in an image.
5. Add the original image and the top-hat filtered image and then subtract the bottom-hat filtered image.
By applying the above techniques the noise will be removed and contrast enhancement will be done.
3.3 GABOR KERNEL FILTERS
A complex Gabor filter is defined as the product of a Gaussian kernel times a complex sinusoid. A Gabor filter set with a given direction gives a strong response for locations of the target images that have structures in this given direction. For instance, if the target image is made of a periodic grating in a diagonal direction.A 2-D Gabor function is a harmonic oscillator, which is a sinusoidal plane wave of some frequency and orientation within a Gaussian envelope.
A 2-D Gabor filter over the image domain(x,y) is given by
2 2
0 0
2 2
0 0 0 0
, exp
2 2
X exp 2
x y
x x y y
G x y
i u x x v y y
(1)
where
00 00
2 2
0 0 0
0 0
0
, is location in the image,
, specifies modulation which has
frequency and
orientation arctan
and are standard deviation of Gaussian envelope
x y
x y u v
u v v
u
Gabor filter calculates all the convolutions of the input image IMG with the Gabor-filter kernels for all combinations of orientations and all phase-offsets with the input image IMG. The result is a 4-dimensional matrix of which the first two indices are the image-coordinates, the third index is the phase offset, the fourth index is the orientation.
The following are the steps for the Gabor kernel calculation 1. Calculate the ratio σ / λ from bandwidth then test if the σ / λ ratio.
2 .Creation of two (2n+1) x (2n+1) matrices x and y that contain the x- and y-coordinates of a square 2D-mesh. 3. The wave vector of the Gabor function is calculated. 4. Pre compute coefficients of the function.
5. Convolution of images is done by fast Fourier transform. The global features of the images are taken where each image corresponds to a point in a high dimensional feature space. To accurately determine the orientation field, the input image is divided into equal-sized blocks of 16 x 16 window, it is used to extract for each angle. Each block is processed independently.
Some of the features used for the extraction of the images are
Orientation: The angle between the x-axis and the major axis of the ellipse.
Minimum: The minimum pixel value of the image in the 16 x 16 window.
Maximum: The maximum pixel value of the image in the 16 x 16 window.
Mean: The mean (also known as average), is obtained by dividing the sum of observed values by the number of observations, n.
m = x/y where, x= sum of items, y= total number of items. The orientation of the angles at 15, 30,45,60,75 are observed for each image. The features considered in this study are the orientation in 5 angles such as 15, 30,45,60,75 degrees, min, max, mean totaling 8 features and 8 pixel points for the window generating 64 features of min, max and the average with respect to each angle is taken thus generating 192 features values. To be able to detect images on all possible orientations, the kernel image must be rotated to all possible orientations and the average response from the value is registered.
[image:3.595.86.251.69.168.2] [image:3.595.345.511.660.734.2]3.4 FUZZY C MEANS CLUSTERING
Fuzzy clustering methods allow the pixel to belong to several clusters simultaneously, with different degrees of membership. The measure of dissimilarity in FCM is given by the squared distance between each data point and the cluster centre, i.e. the Euclidean distance between them and the distance is weighted by the power of the membership degree at that data point. The algorithm is an iterative clustering method that produces an optimal c partition by minimizing the weighted within group sum of squared error objective function.(2)
where X = {x1, x2, ・・・ , xn} ⊆ Rp is the data set in the
p-dimensional vector space,n is the number of data items, c is the number of clusters with 2 ≤ c < n, uik is the degree of
membership of xk in the i th
cluster, q is a weighting exponent on each fuzzy membership, vi is the prototype of the centre of
cluster i, d2 (xk, vi) is a distance measure between object xk
and cluster centre vi. The choice of using fuzzy clustering
algorithm, in particular, Fuzzy C Means (FCM) has been due to the fact that boundaries of lungs are generally not well defined and seem to be fuzzy.
The fuzzyc-means algorithm is works as follows: 1. Choose number of clusters.
2. Assign randomly to each point coefficients for being in the clusters.
3. Repeat until the algorithm has converged. 4. Compute the centroid for each cluster.
5. For each point, compute its coefficients of being in the clusters.
[image:4.595.314.544.261.351.2]6. The algorithm minimizes intra-cluster variance as well, but has the same problems as k-means; the minimum is a local minimum, and the results depend on the initial choice of weights.
Fig 6: watershed images
3.5
SEGMENTATION
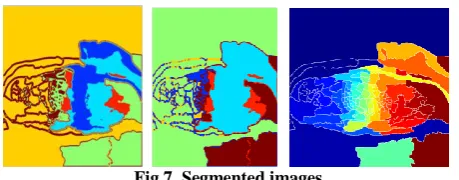
Image segmentation is the process of dividing an image into multiple parts which is typically used to identify objects or other relevant information in digital images. The watershed transform finds "catchment basins" and "watershed ridge lines" in an image by treating it as a surface where light pixels are high and dark pixels are low. Segmentation using the watershed transform identifies or mark foreground objects and background locations. The region description is done by segmentation. Watershed segmentation is applied where the watershed transform is to search for regions of high intensity
gradients (watersheds) that divide neighboured local minima (basins). Marker-controlled watershed segmentation follows this procedure:
1. Compute a segmentation function: The dark regions of the images are the objects that need to be segmented. Read in the Color Image and Convert it to Grayscale. Use the Gradient Magnitude as the Segmentation Function
2. Mark foreground objects: These are connected blobs of pixels within each of the objects.
3. Compute background markers: These are pixels that are not part of any object.
4. Modify the segmentation function so that it only has minima at the foreground and background marker locations. 5. Compute the watershed transform of the modified segmentation function and visualize the Result.
Fig 7. Segmented images
3.6 FEATURE SELECTION
Feature selection is a process commonly used in machine learning, wherein subsets of the features available from the data are selected for application of a learning algorithm. The best subset contains the least number of dimensions that most contribute to accuracy. The univariate filter model search of the feature selection method i.e., Information gain method, the multivariate filter model search of correlation based feature selection method are chosen for this work. Optimisation process is done by the genetic algorithm which is the efficient methods for function minimization.
3.6.1 Correlation-based feature selection (CFS)
One of the filter based multivariate model search which is models feature dependencies, Independent of the classifier, better computational complexity than wrapper methods is correlation based feature selection. CFS searches feature subsets according to the degree of redundancy among the features. The evaluator aims to find the subsets of features that are individually highly correlated with the class but have low inter-correlation. Correlation coefficients are used to estimate correlation between subset of attributes and class, as well as inter-correlations between the features.
CFS is used to determine the best feature subset and is usually combined with search strategies such as forward selection, backward elimination, bi-directional search, best-first search and genetic search.CFS first calculates a matrix of feature-class and feature-feature correlations from the training data.
Equation for CFS is given.
(3) Where rxc is the correlation between the summed feature
subsets and the class variable k is the number of subset features
rzi is the average of the correlations between the subset
rii is the average inter-correlation between subset features.
The output of the feature extracted (ie) 196 values is given as an input the optimized top ranking 100 values are ranked. 3.6.2 Information gain
Another filter based univariate model search which is Fast, Scalable, Independent of the Classifier is Information gain method. It measures the number of bits of information obtained for category prediction, it measures the decrease in entropy when the feature is given or absent. The information gain of an attribute is measured by the reduction in entropy IG(X) = H(D) − H(D|X). The greater the decrease in entropy when considering attribute X individually, the more significant feature X is for prediction. Information gain (IG) measures the amount of information in bits about the class prediction, if the only information available is the presence of a feature and the corresponding class distribution. The output of the feature extracted (ie) 196 values is given as an input where the REPTree is created. The REPTree is a fast decision tree learner which builds a decision/regression treeusing information gain as the splitting criterion, and prunes it using reduced error pruning. The optimized top ranking 100 values are ranked.
3.6.3 Genetic algorithm based Initialization
Genetic Algorithm (GA) is a particular class of evolutionary algorithms that makes use of techniques inspired by evolutionary biology such as inheritance, mutation, selection, and crossover. In feature selection problems, each feature subset is represented by a binary string. 1 of N th bit means that the feature set contained feature X .A genetic algorithm mainly composed of three operators: selection, crossover, and mutation. In feature selection, Genetic Algorithm is used as a random selection algorithm, capable of effectively exploring large search spaces, which is usually required in case of attribute selection. The genetic algorithm approach is used along with the feature selection techniques where the feature subsets are reduced to the maximum to obtain the optimal solution. The purpose of using genetic algorithm in the feature selection methods in this study is that the huge datasets are reduced to the optimal size for appropriate segmentation of the images.
Top ranked features of the images in 40, 60, 80,100 are calculated for the feature selection methods used in this study. According to the ranking the images are classified by the classifiers.
3.8 CLASSIFIERS
The two classifiers are used to classify the images and the performance measures of them are calculated.
3.8.1 Naive Bayes classifier
Finally the Naive Bayes classifier is used for classifying the images and the performance measures are calculated and the comparative study of the successful feature selection algorithm is chosen .Naïve Bayes is used for classifying the extracted features in this study. The extracted features are classified to the most likely class. Learning in Naïve Bayes is simplified by assuming that the features are independent for a given class. The feature is classified as shown in equation (3):
(4)
Where X=(X1,…, Xn) is the feature vector and C is a class. The choice of choosing this classifier is the feature extraction
handles all type of value i.e., univariate wrapper, multivariate values. The experiments and results shows the results of the work done by the classifier and the results are shown. 3.8.2 Random Forest classifier
The random forest is ensemble approaches that can be a form of nearest neighbour predictor. Ensembles are a divide-and-conquer approach used to improve performance. The main principle behind ensemble methods is that a group of “weak learners” can come together to form a “strong learner”. Each classifier, individually, is a “weak learner,” while all the classifiers taken together are a “strong learner”. Random forest add an additional layer of randomness to bagging. In addition to constructing each tree using a different bootstrap sample of the data, random forests change how the classification or regression trees are constructed. In standard trees, each node is split using the best split among all variables. In a random forest, each node is split using the best among a subset of predictors randomly chosen at that node.
4.
EXPERIMENT AND RESULTS
[image:5.595.335.523.492.637.2]In order to prepare the image for segmentation, pre-processing of the image was done by contrast enhancement and median filtering. Median filter was used for noise removal. Contrast enhancement was performed. The number of features reduced by feature selection methods with Genetic algorithm based Initialization for the optimization of results. Reducing the number of features of dataset is important .All methods were successful in reducing the number of features. The image is resized to 128 by 128 and the average, min and max of 16x16 window is used to extract for each angle. Thus generating 64 features of min, max and avg. Then the average with respect to each angle is taken thus generating 192 features. The Fuzzy c means clustering is done to cluster the images and segmentation of the images are done. CFS and IG is used to rank this feature and classification accuracy is used to measure with 40, 60, 80, 100 features using genetic algorithm. The classification accuracy of datasets with 10-fold cross validation for finding the accuracy of the images are computed.
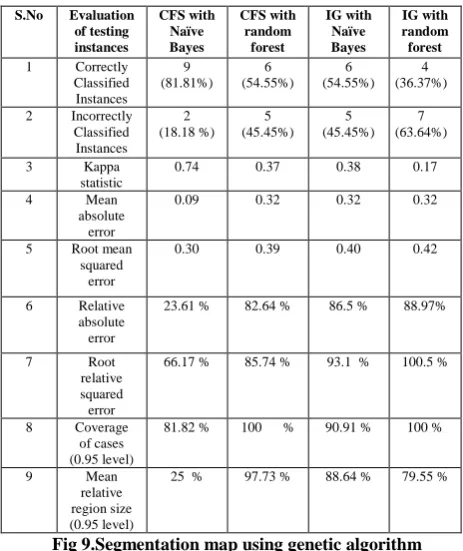
Fig 9.Segmentation map using genetic algorithm
The output of the images and the segmentation map for the datasets are implemented
.
5. PERFORMANCE ANALYSIS
The correctly and incorrectly classified instances show the percentage of test instances. The percentage of correctly classified instances is often called accuracy or sample accuracy. Kappa is a chance-corrected measure of agreement between the classifications and the true classes. It is calculated by taking the agreement expected by chance away from the observed agreement and dividing by the maximum possible agreement. A value greater than zero means that the classifier is doing better than chance.
The mean absolute error is the sum over all the instances and their AbsErrorPerInstance divided by the number of instances in the test set with an actual class label.
MeanAbsErr = Sum (AbsErrPerInstance) / number of instances with class label.
Root mean squared error, Relative absolute error, Root relative squared error is used to assess performance when the task is numeric prediction. Root relative squared error is computed by dividing the Root mean squared error by predicting the mean of the target values.
Table 1: Comparative Study and Summary of the classification of the images using Naive Bayes classifier Total Number of Instances 11
Once the model has been trained and tested, the performance measure of the model is to be done
.
5.1. Performance measures
The performance measures such as The True Positive
(TP) rate is the proportion of examples which were classified
as class x, among all examples which truly have class x, i.e. how much part of the class was captured. It is equivalent to Recall.The False Positive (FP) rate is the proportion of examples which were classified as class x, but belong to a different class, among all examples which are not of class x.
[image:6.595.48.280.73.349.2]The Precision is the proportion of the examples which truly have class x among all those which were classified as class x. Precision (P) = tp/(tp+fp) the recall is defined by Recall (R) = tp/(tp+fn) Where tp, fp, tn and fn are true positive, false positive, true negative and false negative respectively. The F-Measure is simply 2*Precision*Recall/(Precision+Recall) are calculated and displayed.
Table 2, 3: Detailed Performance Accuracy for classes using Naive bayes
TP Rate FP Rate Precision Class
C1 C2 C1 C2 C1 C2
1 0.667 0.167 0.125 0.833 0.667 1
0.5 0.5 0 0.286 1 0.5 2
0 0 0 0 0 0 3
1 1 0 0.222 1 1 4
0.909 0.545 0.076 0.178 0.924 0.924 Weighted average
Where C1- Correlation based feature selection
[image:6.595.309.551.345.558.2]C2-Information Gain
Table 4, 5 : Detailed Performance Accuracy for classes using random forest classifier
TP Rate FP Rate Precision Class
C1 C2 C1 C2 C1 C2
0.6 1 0.17 0.38 0.75 0.5 1
0.5 0 0 0 1 0 2
0 0 0 0 0 0 3
1 0.5 0.44 0.44 0.33 0.2 4
0.545 0.364 0.157 0.183 0.583 0.173 Weighted average
S.No Evaluation of testing instances
CFS with Naïve Bayes
CFS with random
forest
IG with Naïve Bayes
IG with random forest
1 Correctly Classified Instances
9 (81.81%)
6 (54.55%)
6 (54.55%)
4 (36.37%)
2 Incorrectly Classified Instances
2 (18.18 %)
5 (45.45%)
5 (45.45%)
7 (63.64%)
3 Kappa
statistic
0.74 0.37 0.38 0.17
4 Mean
absolute error
0.09 0.32 0.32 0.32
5 Root mean squared
error
0.30 0.39 0.40 0.42
6 Relative
absolute error
23.61 % 82.64 % 86.5 % 88.97%
7 Root
relative squared error
66.17 % 85.74 % 93.1 % 100.5 %
8 Coverage
of cases (0.95 level)
81.82 % 100 % 90.91 % 100 %
9 Mean
relative region size (0.95 level)
25 % 97.73 % 88.64 % 79.55 %
Recall F-Measure ROC Area Class
C1 C2 C1 C2 C1 C2
1 0.667 0.909 0.667 0.917 0.833 1
0.5 0.5 0.667 0.5 0.639 0.607 2
0 0 0 0 0 0.583 3
1 1 1 0.667 1 0.889 4
[image:6.595.311.548.632.714.2]Where C1- Correlation based feature selection
C2-Information Gain
6. CONCLUSION
In this work the texture based features are extracted by Gabor filtering, the feature outputs are combined by watershed segmentation and the fuzzy C means clustering. Feature selection techniques are employed with Genetic algorithm which is used as an optimal initialisation of the clusters. The naive Bayes and random forest classifier are used for classification. The accuracy was found to be 81.81%, 54.55%, 54.55%, 36.37% for correlation based feature selection, information gain using naive bayes and random forest respectively. Performance measure shows that the Correlation based feature selection with naive bayes classifier produces more accurate results.This method may be enhanced by taking some more features and by combining with other classification models.
7. ACKNOWLEDGEMENT
We would like to take this opportunity to thank Radiologist Dr. Ramesh Kumar M.D.,(R.D) ,Professor and Head, Department of Radiology Sri Manakula Vinayagar Medical college and Hospital Madagadipet for anonymizing the Dicom Images and helpful discussions regarding the lung diseases.
6. REFERENCES
[1] Manish Kakara, Dag Rune Olsen “Automatic
segmentation and recognition of lungs and lesion from CT scans of thorax “ IEEE transactions on Computerized Medical Imaging and Graphics 33 (2009) 72–82. [2] Ribeiro, M. X., Balan, A. G. R., Felipe, J. C., Traina, A. J.
M., Traina Jr., C.,” Mining statistical association rules to select the most relevant medical image features” , First International Workshop on Mining Complex Data (IEEE MCD’05), Houston, USA, IEEE Computer Society, 2005, p. 91–98.
[3]C.Bhuvaneswari,P.Aruna, D.Loganathan“Feature Selection Using Association Rules for CBIR and Computer Aided Medical Diagnostic”, International Journal of Computer & Communication Technology ISSN (PRINT): 0975 - 7449, Volume-4, Issue-1, 2013.
[4] Uppaluri R, Hoffman EA, Sonka M, Hartley PG, Hunninghake GW, McLennan G,”Computer recognition of regional lung disease patterns” American Journal of Respiratory Critical Care Medicine 1999;160:648–54. [5] Shyu CR, Brodley CE, Kak AC, Kosaka A, Aisen AM,
Broderick L, ASSERT:“A physician-in-the-loop content based retrieval system for HRCT image databases” Computer Vision Image Understanding, 1999;75:111– 32.
[6] C. Brambilla and S. Spiro” HIGHLIGHTS IN LUNG CANCER”, Copyright #ERS Journals Ltd .2001 European Respiratory Journal, ISSN 0903-1936. [7] Armato SG, Giger ML, MacMohan H.” Automated
detection of lung nodules in CT scans: preliminary results”,. Med Phys 2001; 28:1552–61.
[8] Lee Y, Hara T, FujitaH, Itoh S, Ishigaki T.,”Automated detection of pulmonary nodules in helical CT images based on an improved template-matching technique”.
[9] McNitt-Gray MF, Har EM, Wyckoff N, Sayre JW, Goldin JG.,” A pattern classification approach to characterizing solitary pulmonary nodules imaged on high resolution CT: preliminary results”, Med Phys 1999;26:880–8. [10] Yankelevitz DF, Reeves AP, Kostis WJ, Zhao B,
Henschke CI. ,”Small pulmonary nodules: volumetrically determined growth rates based upon CT evaluation”, Radiology 2000;217:251.
[11] Zagers H, VroomanHA,Aarts NJM, Stolk J,Kool LJS, Dijkman JH, et al. “Assessment of the progression of emphysema by quantitative analysis of spirometrically gated computed tomography images.”,Invest Radiology 1996;31:761–7.
[12]Adelson, E. H. and Bergen, J. R. .” Spationtemporal energy models for the perception of motion”, Journal of the optical society of america A, 2:284–299.
[13]Rajdev Tiwari and Manu Pratap Singh, “Correlation-based Attribute Selection using Genetic Algorithm”, International Journal of Computer Applications (0975 – 8887), Volume 4– No.8, August 2010:28-34.
[14]. I. H. Witten, E. Frank..” Data Mining: Practical machine learning tools and techniques”,2nd Edition, Morgan Kaufman, San Francisco, 2005.
[15] H.D.Tagare, C. Jafe, J. Duncan, “Medical image databases: A content-based retrieval approach”, Journal of the American Medical Informatics Asssociation,4 (3),1997, pp. 184-198.
[16] Nassir Salman” Image Segmentation Based on Watershed and Edge Detection Techniques”,The International Arab Journal of Information Technology, Vol. 3, No. 2, April 2006, pp.104-110.
[17] A. Jain and D. Zongker, “Feature Selection: Evaluation,Application, and Small Sample Performance”, IEEE Transactions on Pattern Analysis and Machine Intelligence, 1997, Vol. 19, No. 2, pp. 153-158.
[18] M.J Martin-Bautista and M-A Vila, “A Survey of Genetic Feature Selection in Mining Issues”, Proceedings of the Congress on Evolutionary Computation, 1999, Vol. 2, pp. 1314-1321.
[19] Prati RC, Batista GEAPA, Monard MC,” Class imbalances versus class overlapping: an analysis of learning system behavior”. Lectuer Notes Computer Science 2004, 2972, 312–21.
[20] Chawla NV, Boywer KW, Hall LO, Kegelmeyer WP. SMOTE:,”synthetic minority over-sampling technique” Journ Artif Intell Res 2002;:321.
[21]Priya.R , Aruna.P, ” Automated Classification System For Early Detection Of Diabetic Retinopathy In Fundus Images”, International Journal Of Applied Engineering Recall F-Measure ROC Area Class
C1 C2 C1 C2 C1 C2
0.6 1 0.667 0.667 0.917 0.958 1 0.5 0 0.667 0 0.889 0.833 2
0 0 0 0 0.889 0.6 3
1 0.5 0.5 0.286 0.889 0.472 4 0.545 0.364 0.515 0.234 0.902 0.781 Weighted