http://dx.doi.org/10.4236/jbm.2014.23001
Computer Image Analysis as a Tool for
Microbial Viability Assessment: Examples
of Use and Prospects
Evgeny Puchkov
All-Russian Collection of Microorganisms, Skryabin Institute of Biochemistry and Physiolog of Microorganisms, Pushchino, Russia
Email: [email protected]
Received January 2014
Abstract
Application of the computer image analysis for improving microbial viability assessment by plate count and fluorescence microscopy was investigated. Yeast cells were used as a model microor-ganism. The application of the improved methods for the viability assessment of yeast cells after preservation by freezing and freeze-drying was demonstrated.
Keywords
Microbial Viability, Microbial Preservation, Plate Count, Yeast, Computer Image Analysis, Fluorescence Microscopy, Saccharomyces cerevisiae, Cryptococcus terreus,
Xanthophyllomyces dendrorhous
1. Introduction
Microbial viability is a feature that needs to be evaluated quantitatively in many areas of the research and applied microbiology. It is generally agreed to consider microbial viability as an ability of the cells to multiply and to give progeny. However quantitative assessment of this ability is not straight forward and there is no any universal method that could be used in all cases [1].
Two groups of so-called direct and indirect methods have been developed to date. The direct methods allow as-sessing the multiplication ability of the cells by cultivating them at appropriate conditions. So, viability is considered as culturability [2]. The plate count technique is the best example, and it is often used as a “gold standard” in many practical cases. However, the technique, in its original form [3], is time- and labor-consuming.
The main goal of this study was to investigate application of the computer image analysis for improving microbial viability assessment by plate count and fluorescence microscopy. Yeast cells were used as a model microorganism. The use of the improved methods for the viability assessment of yeast cells after preservation by freezing and freeze- drying was studied.
2. Materials and Methods
2.1. Microbiological Procedures
Experiments were carried out with Saccharomyces cerevisiae VKM Y-2549 (type strain); Cryptococcus terreus VKM Y-2253; Xanthophyllomyces dendrorhous VKM Y-2786 (all from All-Russian Collection of Microorgan-isms) and Saccharomyces cerevisia cells of dry commercial Fermiol preparation (DSM Food Specialties Beve-rage Ingredients, The Netherlands).
The cells were freeze-dryed in a protecting medium containing 10% sucrose, 1.5% gelatine, and 0.1% agar-agar using an EF6 centrifuge-type Edwards apparatus and rehydrated in distilled water. Freezing of the cells was carried in an MDF-Ultra Low Sanyo fridge at –68˚C followed by thawing at 36˚C.
For colony-forming capacity assessment, the cell suspensions were homogenized by pipetting. Only sus-pensions free from microscopically visible aggregates were used for plating. Serial tenfold dilutions were plated onto Petri dishes with agarized medium containing wort (7˚B). In case of conventional inoculation, en-tire plate area was seeded. For implementation of the Miles and Misra procedure [6], drops of 0.02 - 0.05 ml of each dilution were applied to one of eight sectors drawn on a Petri dish. The colonies were counted after incubation at 20 - 23˚C for 3 - 4 days. Total concentration of cells was determined using conventional light microscopy with a Goryaev chamber for blood cells’ counting.
2.2. Computer Colony Counting
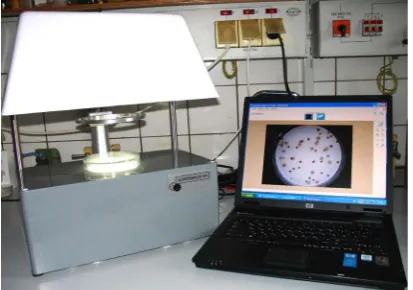
A computer colony analyzer KOMPANKOL-M1 (Figure 1) developed in our laboratory [7] was used throughout this work. The instrument was capable of getting digital images of microbial colonies in Petri dishes (Figure 2). A computer software of the analyzer allowed automatic and “manual” counting of the
Figure 1. A computer colony analyzer KOMPANKOL-M1.
[image:2.595.211.418.428.573.2]colonies of 0.3 mm in diameter and higher. Automatic counting was based on the “top hat” thresholding. “Manual” counting was accomplished visually using virtual mouse-controlled “markers” with automated counting of the marked colonies.
2.3. Microscopy and Digital Photography
The cells were concentrated by centrifugation up to ca. 5 × 10⁸ cells/ml and supplemented with 3,8-diamino- 5-ethyl-6-phenylphenanthridinium bromide (ethidium bromide, Eth) (Sigma) at a concentration of 50 μM and 4,6-diamidino-2-phenylindole, dilactate (DAPI) (Serva) at a concentration of 15 μM. Upon 5 - 10 min of in-cubation at 25˚C ± 0.5˚C, 6 μl aliquots of the cell suspension were placed onto specimen slides, covered with cover glass, and sealed with nail polish to prevent evaporation. Observations were started ca. 20 min after sealing, when most cells had stuck to the slide’s glass.
Fluoresce microscopy and color digital photography were carried out on a ML-2B fluorescence microscope (LOMO, Russia) equipped with a Sony DSC-V3 digital camera [8]. By applying appropriate filter sets, the fol-lowing combinations of λex/λem were used: in the fluorescence mode—360 nm/>400 nm; in the light
transmis-sion mode—520 nm/>400 nm.
2.4. Computer Data Treatment
The color digital images of the fluorescing cells were processed by the Adobe Photoshop v. 8.0 (Adobe Systems Inc., USA). Quantitative image analysis was made, in case of colony counting, using original KOMPANKOL- M1 software, and in case of microscopic cell counting, using ImageJ 1.42 software (National Institute of Health, USA, http://rsb.info.nih.gov/ij). Other quantitative treatments were made by MS Excel 2003 and OriginPro 7.5 (OriginLab, USA) software.
3. Results and Discussion
3.1. Computer-Aided Colony Counting
The “manual” and automated KOMPANKOL-M1 colony counting methods in case of conventional spread- in-oculation onto the entire area of a Petri dish were compared (Figure 3). The data indicated that, within the error of determination, both methods gave close results. However, it was noticed that automatic counting systematically gave some underestimation. This was the consequence of the presence of some fraction of merged colonies. Unfortunately, the “threshold” adjustments could not completely “resolve” single colonies in comparatively large aggregates.
The Miles and Misra procedure [6] of inoculation of the small volume samples upon serial dilution onto a single Petri dish significantly lessen labor consumption in assessing of the colony-forming capacity. However, visual identification and counting of small colonies is practically impossible. Therefore, this procedure is nor-mally used for estimating quantitatively the colony forming ability only to the order of magnitude (or the degree of dilution) by evaluating of the colony growth presence/absence in the section of the corresponding dilution (Figure 2(B)).
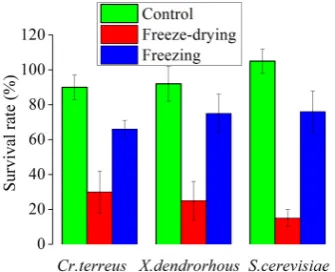
KOMPANKOL-M1 is capable of getting images of single colonies outgrown upon Miles and Misra [6] in-oculation (Figure 2(C)). Comparison of the “manual” and automated colony counting methods for this protocol of inoculation and the conventional one revealed good agreement of all counts (Figure 4). This opens new po-tential applications of the Miles and Misra protocol of inoculation by assessing survival rates within the percent scale. For example, there is need in assessing survival rate in the percent scale for evaluating efficacy of micro-bial preservation procedures. Figure 5 illustrates application of the developed computer-aided approach for as-sessing survival rates of three yeast species after freezing and freeze-drying.
3.2. Computer-Aided Fluorescence Microscopy Viability Assessment
Figure 3. Comparison of the automated and “manual” counting by KOMPANKOL-M1 of the yeast S. cerevisiae Y-2549 colonies upon conventional whole Petri dish inoculation.
Figure 4. Comparison of the automated and “manual” counting by KOMPANKOL-M1 of the yeast S. cerevisiae Y-2549 colonies upon conventional whole Petri dish and Miles and Misra [6] protocols of inoculation.
[image:4.595.219.412.291.426.2] [image:4.595.230.398.497.633.2]images of the stained cells were splitted to red, green and blue components (Figures 6(C)-(E)). By so doing, damaged cells with the compromised membranes could be “separated” from the undamaged cells (bluish-green ones) (Figures 6(B) and (F)). Also, the green component of fluorescence was found to be present in both dam-aged and undamdam-aged cells (Figures 6(F)-(H)). Then an algorithm of assessing a fraction of damdam-aged (or unda-maged) cells was developed comprising “RGB-split” and “Analyze particles” options of the Image J software. This algorithm made the fluorescence microscopy technique more objective and less tedious.
Cytoplasmic membrane is generally considered to be a critical for viability cell component [4] [5]. It was found that upon sever treatments of the yeast S. cerevisiae Y-2549 cells by 60˚C or repeated freeze-thaw cycles there was close correlation between fractions of damaged cells assessed by the computer-aided fluorescence mi-croscopy and the survival rate decreases determined by plate counting of colonies (data not shown). Also, a good correlation was found between data of the developed approach and direct survival assessment by plate counting of starter cultures of the commercial alcohol producing yeast strain of S. cerevisia (Figure 7). These data could be considered as a good argument for a potential practical application of the developed approach for
[image:5.595.201.426.254.444.2]Figure 6. Microscopic digital images of the S. cerevisiae Y- 2549 cells. A—transmission mode; B and F (a magnified fragment of B)—fluorescence mode; C,D,E,G,H—images B and F upon RGB-splitting by Image J software, respectively.
[image:5.595.237.392.508.620.2]viability/culturability prediction of at least yeast cultures.
4. Conclusion
The use of computer image analysis can significantly improve microbial viability assessment by either direct plate count techniques or indirect (predictive) fluorescence microscopy methods. This improvement includes a reduction in time and labor consumption and makes methods more objective. The major principles of the image analysis use presented herein may be applied to other microbial objects with commercially available computer colony counters and to fluorescence microscopy approaches utilizing other fluorophores. However, a number of requirements are to be complied with in order to get the advantages of computer analysis and to avoid crucial mistakes. Computer automated counts are performed with a certain error, the value of which depends on the number of merged colonies, on the ratio between numbers of small and large colonies, irregularities of the me-dium thickness over the dish, etc. The choice between automated and manual counting is to be made depending on the aim of the experiment and of the sample characteristics. For using computerized indirect (predictive) techniques, correlation with data of direct methods must be investigated in every particular case.
References
[1] Davey, H.M. (2011) Life, Death, and in between: Meanings and Methods in Microbiology. Applied and Environmental Microbiology, 77, 5571-5576. http://dx.doi.org/10.1128/AEM.00744-11
[2] Barer, M.R. and Harwood, C.R. (1999) Bacterial Viability and Culturability. Advances in Microbial Physiology, 41, 93-137. http://dx.doi.org/10.1016/S0065-2911(08)60166-6
[3] Postgate, J.R. (1969) Viable Counts and Viability. Methods in Microbiology, 1, 611-628.
http://dx.doi.org/10.1016/S0580-9517(08)70149-1
[4] Lloyd, D. and Hayes, A.J. (1995) Vigour, Vitality and Viability of Microorganisms. FEMS Microbiology Letters, 133, 1-7. http://dx.doi.org/10.1111/j.1574-6968.1995.tb07852.x
[5] Jones, R.P. (1987) Measures of Yeast Death and Deactivation and Their Meaning. Process Biochemistry, 22, 118-128.
[6] Miles, A. and Misra, S. (1938) The estimation of the bactericidal power of the blood. Journal of Hygiene, 38, 732-748.
http://dx.doi.org/10.1017/S002217240001158X
[7] Puchkov, E.O. and Lasukov, Yu.I. (2008) Computer Analyzer KOMPANKOL-M1 to Monitor Microorganism Colo-nies. Water: Chemistry and Ecology, 5, 29-33. (in Russian) http://watchemec.ru/en/article/2241/
[8] Puchkov, E.O. and McCarren, M. (2011) Locating of Nucleic acid Intercalators in Yeast Cells by Image Analysis Combined Fluorescence Microscopy. Journal of Fluorescence, 21, 1009-1013.