Published Online July 2014 in SciRes. http://www.scirp.org/journal/jbise http://dx.doi.org/10.4236/jbise.2014.79074
How to cite this paper: Degheidy, H., et al. (2014) Flow Cytometer Performance Characterization, Standardization and Calibration against CD4 on T Lymphocytes Enables Quantification of Biomarker Expressions for Immunological Applications. J. Biomedical Science and Engineering, 7, 756-768. http://dx.doi.org/10.4236/jbise.2014.79074
Flow Cytometer Performance
Characterization, Standardization and
Calibration against CD4 on T Lymphocytes
Enables Quantification of Biomarker
Expressions for Immunological Applications
Heba Degheidy1*, Steven Bauer1, Gerald Marti2, Lili Wang3*
1Center for Biologics Evaluation and Research, US Food and Drug Administration (FDA), Bethesda, Maryland,
USA
2Center for Devices and Radiological Health, FDA, Silver Spring, Maryland, USA 3National Institute of Standards and Technology (NIST), Gaithersburg, Maryland, USA
Email: *[email protected], *[email protected]
Received 15May 2014; revised 30June 2014; accepted 15July 2014 Copyright © 2014 by authors and Scientific Research Publishing Inc.
This work is licensed under the Creative Commons Attribution International License (CC BY).
http://creativecommons.org/licenses/by/4.0/
Abstract
important information for monitoring antibody-based therapy and could be potentially used to adjust dosing. Presently, we are implementing this protocol to quantify critical disease biomar- kers, and making necessary modifications to the procedure to include instruments from different instrument manufacturers.
Keywords
Flow Cytometry, Biomarker Quantification, Instrument Standardization, Target Median Fluorescence Intensity (MFI)
1. Introduction
Flow cytometry allows simultaneous measurement of the light scatter properties of different cell types as well as the fluorescence intensities of distinct fluorophores attached to these cell types. It is a powerful analytical tool that has been widely used to perform immunophenotyping, cell counting and numerous cell function assess-ments, such as intracellular cytokine production, protein phosphorylation, cell proliferation and apoptosis.
Development of quantitative flow cytometry (QFC) has been urged for clinical biomarker standardization be-cause accurate and reproducible results will greatly aid our understanding of diseases, enable timely diagnosis and allow proactive monitoring of therapeutic and off-target drug side effects. Standardization of flow cytome-tryin hematological malignancies has been a great challenge. A few published studies describe standardization of data at the analytical stage by exchanging the list mode files to harmonize and standardize the analysis of minimal residual disease in multiple study groups [1]-[4]. Letestuand co-workerse valuated ZAP-70 expression in Chronic Lymphocytic Leukemia (CLL) in a multicenter international harmonization process [5]. Kraan et al. [6] presented general rules for cytometer setup using up to four colors in clinical settings using analog flow-cytome- tric systems, and Shankey et al. [7] reported complete standardization of 4-color ZAP-70 investigation among three institutions. Additionally, the Euro Flow Consortium demonstrated successful standardization of flow cy-tometer settings and measurement protocols for immunophenotyping in a multicenter study [8].
Quantitative flow cytometry has been demonstrated in a single laboratory study [9]-[11]. However, multicen-ter quantitative studies including various flow cytomemulticen-ter platforms have not yet been reported, suggesting the enormous difficulty of the task. This type of study requires both multi-platform instrument standardization and the use of a biological reference marker with a known expression level for ultimate biomarker quantification. The instrument standardization includes multiple steps, e.g. characterization of each instrument performance, target instrument identification, optimization of the target instrument fluorescence detector voltages as well as the application of the median fluorescence intensity (MFI) values from the target instrument to other instrument platforms. Once all flow cytometers are standardized, cell biomarker expression levels can be quantified with a reference biomarker, e.g. CD4 on normal human T lymphocytes with a known number of the antibody bound per cell (ABC) value [12]-[14]. In the present study, we have developed an instrument standardization procedure across three different flow cytometer platforms from the same vendor with somewhat different optical configu-rations and in two different locations. After the standardization of these instruments, CD19 quantification is car-ried out to validate the ABC quantification approach and demonstrate that consistent and reliable results can be accomplished between instruments using the developed procedure.
2. Material & Method
H. Degheidy
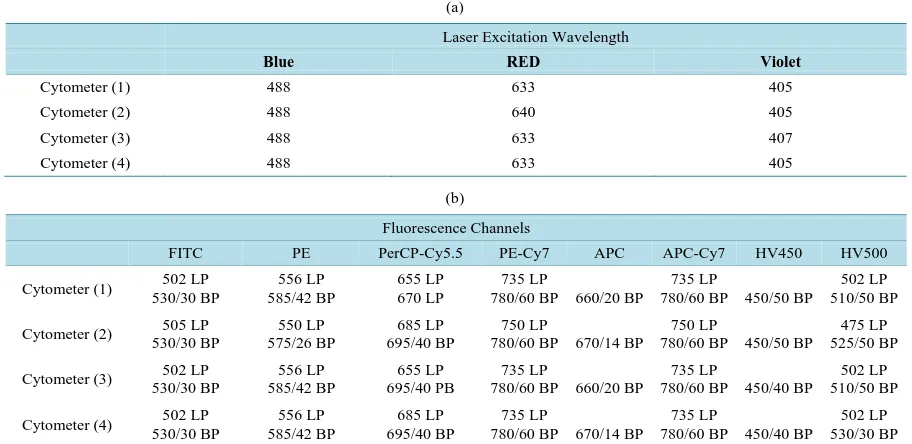
Table 1.(a) Laser excitation wavelength for instruments used in the study; (b) Optical configuration and filter specifications for instruments used in this study.
(a)
Laser Excitation Wavelength
Blue RED Violet
Cytometer (1) 488 633 405
Cytometer (2) 488 640 405
Cytometer (3) 488 633 407
Cytometer (4) 488 633 405
(b)
Fluorescence Channels
FITC PE PerCP-Cy5.5 PE-Cy7 APC APC-Cy7 HV450 HV500
Cytometer (1) 502 LP 530/30 BP 556 LP 585/42 BP 655 LP 670 LP 735 LP
780/60 BP 660/20 BP
735 LP
780/60 BP 450/50 BP
502 LP 510/50 BP
Cytometer (2) 505 LP 530/30 BP 550 LP 575/26 BP 685 LP 695/40 BP 750 LP
780/60 BP 670/14 BP
750 LP
780/60 BP 450/50 BP
475 LP 525/50 BP
Cytometer (3) 502 LP 530/30 BP 556 LP 585/42 BP 655 LP 695/40 PB 735 LP
780/60 BP 660/20 BP
735 LP
780/60 BP 450/40 BP
502 LP 510/50 BP
Cytometer (4) 502 LP 530/30 BP 556 LP 585/42 BP 685 LP 695/40 BP 735 LP
780/60 BP 670/14 BP
735 LP
780/60 BP 450/40 BP
502 LP 530/30 BP
μm (dim bead), 3 μm (mid and bright beads)]. The same master lot of CS & T beads was used throughout the study to define the base line for each instrument and daily QC/QA for the instrument. In addition, the bright bead population wasutilized to determine the target MFI values that were transferred to the other flow cytome-ters. Ultra Rainbow bead kit (Catalog #: URCP-38-2K) containing a blank and five different fluorescence inten-sity populations was acquired from Spherotech Inc (Lake Forest, IL) and used to calibrate the linearity of the fluorescence channels used for biomarker quantification in the unit of equivalent reference fluorophore fluores-cence (ERF) [10].
Anonymous heparinized normal donor samples were obtained from NIH’s Department of Transfusion Medi-cine according to the institutional review boards (IRB) guidelines. The unstained normal donor blood was used to adjust the Photomultiplier tube (PMT) voltage for each fluorescence detector to adequately segregate the auto-fluorescent negative signal from instrument electronic noise in such a way that dim fluorescent events can be discriminated from the true negative. Singly stained normal donor blood was used to ensure that the brightest populations are within the dynamic scale of each detector and to derive the compensation matrix. Lastly, multi-color stained normal donor blood was employed to compare blood cell subset typing results across the selected platforms and determine CD19 expression levels on B lymphocytes.
3. Results & Discussion
3.1. Selection of a Target Flow Cytometer
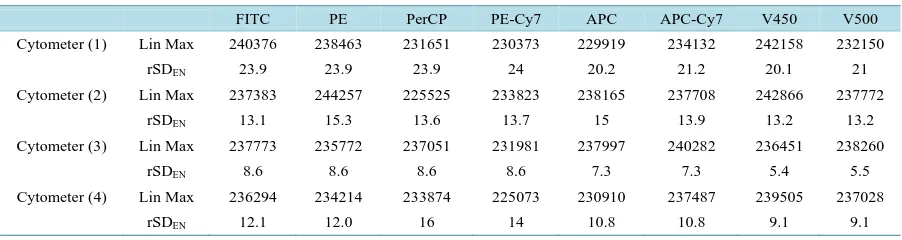
A two-step approach was used for the selection of a target cytometer [15]: 1) Forall cytometers to be standard-ized, a baseline performance was carried out for instrument performance characterization. The robust standard deviation of electronic noise (rSDEN), linearity maximum (Lin Max), and linearity minimum (Lin Min) values were determined for each detector as provided from the baseline performance report; 2) A target cytometer was determined across multiple platforms based on the highest rSDEN and lowest Lin Max for each detector (Table 2). On the basis of these two criteria, Cytometer (1) was identified as the primary target cytometer for this study.
3.2. Photomultiplier (PMT) Voltage Adjustment
Table 2.Cytometer characterization based on electronic noise robust standard deviation (rSDEN) and linearity maximum (Lin Max).
FITC PE PerCP PE-Cy7 APC APC-Cy7 V450 V500
Cytometer (1) Lin Max 240376 238463 231651 230373 229919 234132 242158 232150
rSDEN 23.9 23.9 23.9 24 20.2 21.2 20.1 21
Cytometer (2) Lin Max 237383 244257 225525 233823 238165 237708 242866 237772
rSDEN 13.1 15.3 13.6 13.7 15 13.9 13.2 13.2
Cytometer (3) Lin Max 237773 235772 237051 231981 237997 240282 236451 238260
rSDEN 8.6 8.6 8.6 8.6 7.3 7.3 5.4 5.5
Cytometer (4) Lin Max 236294 234214 233874 225073 230910 237487 239505 237028
rSDEN 12.1 12.0 16 14 10.8 10.8 9.1 9.1
Solution (BD Biosciences) according to the manufacturer’s recommendations. After centrifugation, the cell pel-let was washed twice with 5% FBS/PBS and re-suspended in 2 ml of the same buffer. On the flow cytometers, the FSC/SSC gate for lymphocytes was used and the PMT voltages of the primary target instrument were ad-justed to established voltages in such a way that the robust standard deviations of the autofluorescence signals from unstained cells are within 2.5 to 3 times the rSDEN of each detector to be used in the analysis. These opti-mized PMT voltages were further verified using singly stained blood control stained with either CD45 or CD3for each channel to ensure that the brightest populations are within the dynamic scale of each detector. In summary, the PMT voltages were adjusted so that negatively stained cell populations were located above the electronic noise on the low end, and the positively stained cell populations were within the linear range of the detector for each fluorochrome used.
3.3. Target Values Determination and Application for Multiplatform Standardization
Using the optimized PMT values obtained from the previous step, the bright CS & T bead population was gated and its fluorescence intensities were recorded in all channels of the primary target flow cytometer. These inten-sity values were sed as preliminary “Target MFIs” (See Supplement Figure S1) and transferred to all other companion instruments utilized in this study. After each companion cytometer passed its routine CS & T per-formance check, the PMT voltages in these instruments were adjusted in such way that the same bright bead population has equal or nearly equal “Target MFI” in each detector. In other words, the bright bead MFI values were copied from the primary instrument to other cytometers to be standardized by adjusting PMT voltages to bring the same bright bead peak to the target MFI of each detector. The adjusted PMT voltages of all instru-ments were recorded and followed on a daily basis to monitor instrument stability. With the recorded PMT voltages applied, the MFI of the bright CS & T bead population in each fluorescence channel of any cytometer used in the study was monitored on the day of use with the corresponding target MFIs for that instrument after the instrument standardization process was completed. Variations of only a few volts were acceptable. When-ever instrument performance failed on any instrument, measures such as thorough cleaning, de-gassing flow cell and laser delay verification were taken. When the performance was not restored to pass the monitoring criteria, a service visit was requested. Note that if the target MFI setting resulted in suboptimal PMT setting on any in-strument, the target MFI values were adjusted accordingly on the target flow cytometer until consensus target MFI values were reached under optimal PMT settings for all instruments.
3.4. Verification of Instrument Standardization by Single Tube Analysis of Blood Cell Subsets
ac-H. Degheidy
quired within 1 - 2 hours of cell fixation at both locations. Unstained control cells and singly stained tubes for the eight fluorochromes (FITC, PE, PerCP-Cy5.5, PE-Cy7, APC, APC-Cy7, eFluor 450 and V500) were also prepared and used to set the flow cytometer compensation. The number of events collected in each sample of these experiments varied from 500,000 to 1 million events.
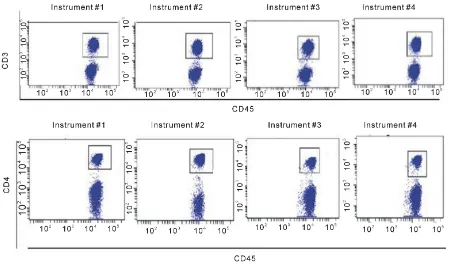
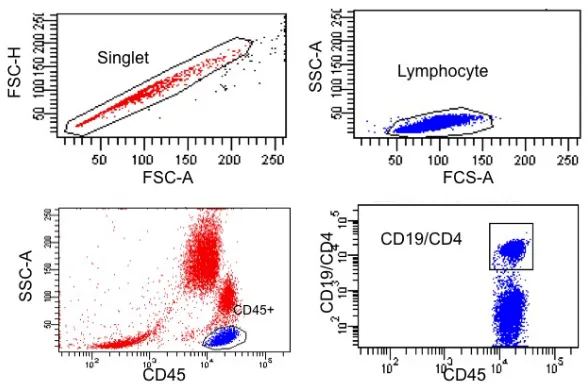
Blood Cell Subset Typing: The stained normal donor sample was acquired in the four optimized and stan-dardized flow cytometers at a “low” flow rate mode within the first 2 hour after sample preparation. Data were subsequently analyzed using the FACSDiva V6software. A doublet exclusion gate based upon (FSC-A vs. FSC-H) was utilized to gate on singlet cells, and within this singlet cell gate, a lymphocyte gate was drawn in a dot plot of FSC-A vs. SSC-A (Supplement Figure S2). Using a dot plot of CD45 vs. SSC-A under the lym-phocyte gate, aR1 gate was drawn around the CD45 positive cells and used for all subsequent gating.Figure 1 shows comparative dot plots of CD3 vs. CD20 and CD20 vs. CD5 and Figure 2 displays dot plots of CD45 vs. CD3 and CD45 vs. CD4, both under R1 gate. The percentage of CD3, CD4, CD8, CD19, and CD20 were ob-tained and provided in Table 3.
Under the CD45+ cell gate, the percentage of CD3 positive cells was 53.8% for instrument 1, 53.1% for in-strument 2, 53.7% for inin-strument 3, and 53.3% for inin-strument 4, respectively. Under the same CD45+ main gate, the percentage of CD4 positive cells was 33% for instrument 1, 32.7% for instrument 2, 32.1% for instrument 3, and 32.6% for instrument 4, respectively. For CD8 expression, the percentage obtained was 22.2%, 19.4%, 20%, and 20.6% for instruments 1 to 4, respectively. The percentage of CD19 positive cells was 29.6%, 31.7%, 32.5%, and 30% for instruments 1 to 4, respectively. Lastly, for cells expressing CD20 the percentage obtained was 28.2%, 31.8%, 28.9%, and 31.5% for instruments 1 to 4, respectively.
When gated on CD3 positive cells, the percentage of CD4+ cells was 53.3%, 58%, 58.8%, and 57.6% for in-struments 1 to 4, respectively; for cells with CD 8 expression the percentage obtained was 35.5%, 34.9%, 35%, and 36.7% for instruments 1 to 4, respectively. The results on the percentages of the blood cell subsets are rea-sonably consistent among the four instruments demonstrate that these instruments are standardized with the procedure implemented. The slightly larger coefficient variations of the mean percentages derived for CD8+, CD19+ and CD20+ cells under the CD45+ cell gate (Table 3) might be related to difference in band path pass filters equipped, e.g. in PerCP Cy5.5 and APC channels (Table 1(b)), and wider expression of CD45 on many different blood cell types.
3.5. Biomarker Quantification
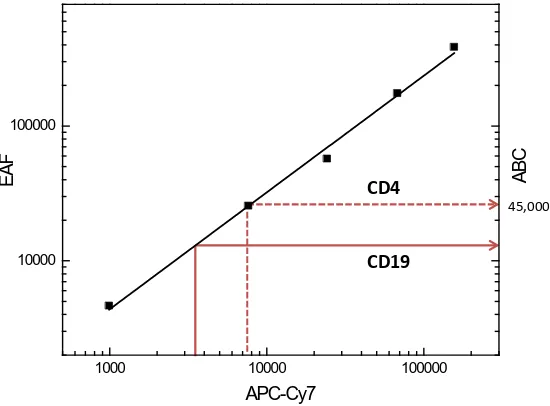
Quantification Scheme: Three different flow cytometer platforms (instrument 1 to 3) at one location were used for CD19 quantification, a B lymphocyte marker after the three instruments were standardized. The quantifica-tion scheme using CD19 APC-Cy7 as an example is illustrated in Figure 3. The linearity of APC-Cy7 channel is assured by using Ultra Rainbow beads for linearity calibration in the unit of the equivalent APC fluorescence (EAF) [10] (square symbol). Using CD4 APC-Cy7 as a reference biomarker with a known antibody bound per cell (ABC) value of 45,000 for fixed whole blood [14], the linear fluorescence calibration scale (left Y-axis in Figure 3) obtained by using Rainbow beads is transformed to the ABC scale (right Y-axis). The quantification of CD19 APC-Cy7 is then carried out using the converted ABC calibration on the right Y-axis. With this rela-tive quantification scheme, it is assumed that different antibodies against different antigens have very similar average fluorescence per antibody values because both CD4 APC-Cy7 and CD19 APC-Cy7 are from the same vendor such that the same conjugation chemistry and process control for APC-Cy7 labeling were applied. It is critical that the labeled antibodies are free of unconjugated APC-Cy7 fluorophores due to likely higher binding affinity for unconjugated antibodies than fluorophore conjugated antibodies. This assumption is further tested in this study using different fluorophore labeled antibodies, CD4 PerCP-Cy5.5 and CD19 PerCP-Cy5.5. Note that monoclonal antibody affinity issue on both CD4 reference marker and the marker of interest has not been taken into account. However, high affinity monoclonal antibodies against specific antigen epitopes are generally used for quantitative flow cytometry measurements in terms of ABC values.
Figure 1. Comparative Dot plots of CD3 on X-axis vs. CD20 on Y-axis upper row and CD20 on X-axis vs. CD5 on Y-axis lower row for one normal donor. Data was obtained from the same sample acquired on four different flow cytometersin two different locations. The instruments were set using one set of target values as described in “Method”. Percentages of positive cells were determined after gating on CD45 positive cells following the doublet exclusion.
[image:6.595.89.541.399.666.2]H. Degheidy
Figure 3. Schematic of CD19 quantification on APC-Cy7 channel. The linearity of APC-Cy7 channel is assured by using Ultra Rainbow beads for the calibration in the unit of the equivalent APC fluorescence (EAF) [10] (square symbol). The adjusted R-squared for the linear fit to the log transformed data as shown is 0.994. Using CD4 APC-Cy7 as a reference biomarker with a known ABC value of 45,000 for fixed whole blood, the CD19 expression level in ABC unit is determined.
Table 3. Percentage of CD3, CD4, CD8, CD19, and CD20 cells gated on CD45 positive cells obtained from individual instruments, and mean percentage and associated CV of each cell subset averaged from all four instruments.
Gated on CD45+ cells Gated on CD3+ cells
CD3 CD4 CD8 CD19 CD20 CD4 CD8
Instrument 1 53.8 33.0 22.2 29.6 28.2 58.3 35.5
Instrument 2 53.1 32.7 19.4 31.7 31.8 58.0 34.9
Instrument 3 53.7 32.1 20 32.5 28.9 58.8 35
Instrument 4 53.3 32.6 20.6 30.0 31.5 57.6 36.7
Mean (CV%) 53.5 (0.6) 32.6 (1.1) 20.6 (5.8) 31.0 (4.4) 30.1 (6.0) 58.2 (0.9) 35.5 (2.3)
CD45 vs. CD 19 or CD45 vs. CD 4 was used to gate on either CD19+ cells or CD4+ cells, respectively, using either APC-Cy7 or PerCP-Cy5.5 fluorochrome.
The median fluorescence intensity (MFI) values for CD19 receptor protein in both APC-Cy7 and PerCP- Cy5.5 channels on two fixed normal whole blood samples are provided in Table 4. Although these values were obtained on the same day with assured linear responses from both fluorescence channels of the standardized in-struments, they show large variations with at least 20% of CV for the same sample among different instruments. Upon the application of the ABC calibration with CD4 as the reference biomarker, an ABC value for CD19 APC-Cy7 for the sample, ND-1 and instrument 2 is calculated to be
19
19 4
4
3746
45000 22374 7534
CD
CD CD
CD MFI
ABC ABC
MFI
= × = × =
,
with the assumption that the effective fluorescence per antibody for anti-CD4 and anti-CD19 made by the same manufacturer is the same [16]. The ABC values obtained for CD19 as summarized in Table 5 are highly com-parable for the same donor sample, independent of fluorochrome label (APC-Cy7 or PerCP-Cy5.5) and cytome-ter plat form used. The mean ABC value and associated CV summarized over three instruments and two fluoro-phores are 22,153 and 2.8% for ND-1 and 25,519 and 4.6% for ND-2, respectively. The consistent results from two different fluorophore labels verify the validity of the assumption that different antibodies against different antigens with the same fluorophore label likely have very similar average fluorescence per antibody values as long as they are produced by the same vendor under rigorous good manufacturing practice (GMP). The study results demonstrate comparable and consistent biomarker quantification across different fluorescence channels
CD4
CD19
45,000
1000 10000 100000
10000 100000
ABC
EAF
[image:7.595.175.450.84.287.2] [image:7.595.87.539.372.462.2]Table 4.Median fluorescence intensity (MFI) values for CD19 in APC-Cy7 and PerCP-Cy5.5 channels obtained from two normal donors (ND). The mean MFI value and CV (column 5 and 6) are obtained for each donor from three different instruments.
MFI (CD19 APC-Cy7)
Instrument 1 Instrument 2 Instrument 3 Mean CV%
ND-1 2588 3746 2671 3002 21.5
ND-2 2841 4280 2960 3360 23.8
MFI (CD19 PerCP-Cy5.5)
Instrument 1 Instrument 2 Instrument 3 Mean CV%
ND-1 3913 2763 2588 3088 23.3
ND-2 4303 3176 3021 3500 20.0
Table 5.The antibody bound per cell (ABC) values obtained for CD19 on two fixed normal whole blood samples using two different fluorophore labels, APC-Cy7 and PerCP-Cy5.5 and three different cytometer platforms. The mean ABC value and CV (column 5 and 6) are obtained for each donor from three different instrument platforms. The quantification of CD19 is carried out relative to CD4 with a known expression level of 45,000 for fixed whole blood.
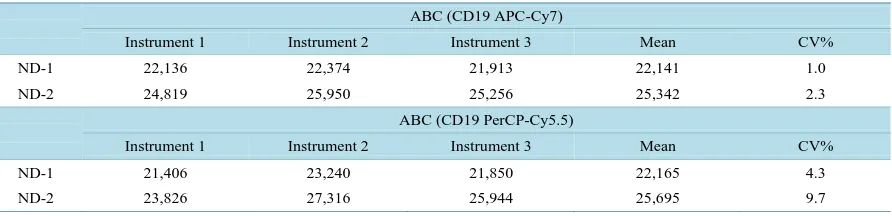
ABC (CD19 APC-Cy7)
Instrument 1 Instrument 2 Instrument 3 Mean CV%
ND-1 22,136 22,374 21,913 22,141 1.0
ND-2 24,819 25,950 25,256 25,342 2.3
ABC (CD19 PerCP-Cy5.5)
Instrument 1 Instrument 2 Instrument 3 Mean CV%
ND-1 21,406 23,240 21,850 22,165 4.3
ND-2 23,826 27,316 25,944 25,695 9.7
and cytometer platforms can be only achieved with the use of the ABC calibration scheme.
4. Summary
Quantitative flow cytometer assays are routinely used in clinical laboratories to estimate the number of specific receptor/antigen sites on the surface or inside of cells taken from blood, lymph nodes, and bone marrow. It is also appropriate for other body fluids such as a bronchial lavage, pleural and peritoneal fluids and even bladder washings. Specific receptors/antigens can serve as biomarkers for pathological conditions at various stages of a disease. Additionally, flow cytometry measurements are used to support many clinical, pharmacologic, and calibration and measurement capability claims used for drug/vaccine, device, and biologics product develop-ment and approval. However, it is still a great challenge to obtain comparable results from different laboratories using different instrument platforms due to the lack of the optimized and standardized procedures and biological reference materials. This study was designed in a small scale to develop a standardized procedure for quantifying CD19 expression level relative to CD4 reference marker. The comparable results of CD19 expression from two normal individuals on three different instruments and two different fluorophore labels support the biomarker quantification approach that relies on instrument standardization and the use of CD4 reference biomarker. To expand the scope of the investigation, flow cytometers from different manufacturers are included in an on-going study to quantify several disease markers of CLL. In addition, efforts on the production of lyophilized peripheral blood mononuclear cells (PBMC) pre-stained with fluorescently labeled anti-CD4 antibodies would simplify the developed quantification scheme without the use of fresh human whole blood.
Acknowledgements
[image:8.595.93.539.287.395.2]H. Degheidy
References
[1] Van de Loosdrecht, A.A., Alhan, C., Bene, M.C., Della Porta, M.G., Drager, A.M., Feuillard, J., et al. (2009) Stan-dardization of Flow Cytometry in Myelodysplastic Syndromes: Report from the First European Leukemia Net Working Conference on Flow Cytometry Inmyelodysplastic Syndromes. Haematologica, 94, 1124-1134.
http://dx.doi.org/10.3324/haematol.2009.005801
[2] Bjorklund, E., Matinlauri, I., Tierens, A., Axelsson, S., Forestier, E., Jacobsson, S. et al. (2009) Quality Control of Flow Cytometry Data Analysis for Evaluation of Minimal Residual Disease in Bone Marrow from Acute Leukemia Patients during Treatment. Journal of Pediatric Hematology/Oncology, 31, 406-415.
http://dx.doi.org/10.1097/MPH.0b013e3181a1c0e8
[3] Dworzak, M.N., Gaipa, G., Ratei, R., Veltroni, M., Schumich, A., Maglia, O., et al. (2008) Standardization of Flow Cytometric Minimal Residual Disease Evaluation in Acute Lymphoblastic Leukemia: Multicentric Assessment Is Fea-sible. Cytometry Part B: Clinical Cytometry, 74, 331-340. http://dx.doi.org/10.1002/cyto.b.20430
[4] Irving, J., Jesson, J., Virgo, P., Case, M., Minto, L., Eyre, L., et al. (2009) Establishment and Validation of a Standard Protocol for the Detection of Minimal Residual Disease in B Lineage Childhood Acute Lymphoblastic Leukemia by Flow Cytometry in a Multicenter Setting. Haematologica, 94, 870-874.
http://dx.doi.org/10.3324/haematol.2008.000414
[5] Letestu, R., Rawstron, A., Ghia, P., Villamor, N., Leuven, N.B., Boettcher, S., Buhl, A.M., Duerig, J., Ibbotson, R., Kroeber, A., Langerak, A., Le Garff-Tavernier, M. and Mockridge, I. (2006) Evaluation of ZAP-70 Expression by Flow Cytometry in Chronic Lymphocytic Leukemia: AMulticentric International Harmonization Process. Cytometry Part B (Clinical Cytometry), 70B, 309-314.
[6] Kraan, J., Gratama, J.W., Keeney, M., D’Hautcourt, J.L. (2003) Setting up and Calibration of a Flow Cytometer for Multicolor Immunophenotyping. Journal of Biological Regulators Homeostatic Agents, 17, 223-233.
[7] Shankey, T.V., Forman, M., Scibelli, P., Cobb, J., Smith, C.M., Mills, R., et al. (2006) An Optimized Whole Blood Method for Flow Cytometric Measurement of ZAP-70 Protein Expression in Chronic Lymphocytic Leukemia. Cy-tometry Part B: Clinical Cytometry, 70, 259-269. http://dx.doi.org/10.1002/cyto.b.20135
[8] Kalina, T., Flores-Montero, J., van der Velden, V.H.J., Martin-Ayuso, M., Bottcher, S., Ritgen, M., Almeida, J., Lher-mitte, L., Asnafi, V., Mendonca, A., de Tute, R., Cullen, M., Sedek, L., Vidriales, M.B., Perez, J.J., teMarvelde, J.G., Mejstrikova, E., Hrusak, O., Szczepanski, T., van Dongen, J.J.M. and Orfao, A. (2012) On Behalf of the EuroFlow Consortium. EuroFlow Standardization of Flow Cytometer Instrument Settings and Immunophenotyping Protocols.
Leukemia, 26, 1986-2010. http://dx.doi.org/10.1038/leu.2012.122
[9] Hultin, L.E., Matud, J.L. and Giorgi, J.V. (1998) Quantitation of CD38 Activation Antigen Expression on CD8+ T cells in HIV-1 Infection Using CD4 Expression on CD4+ T Lymphocytes as a Biological Calibrator. Cytometry, 33, 123-132. http://dx.doi.org/10.1002/(SICI)1097-0320(19981001)33:2<123::AID-CYTO6>3.0.CO;2-K
[10] Wang, L., Gaigalas, A.K., Marti, G.E., Abbasi, F. and Hoffman, R.A. (2008) Toward Quantitative Fluorescence Meas-urements with Multicolor Flow Cytometry. Cytometry Part A, 73A, 279-288. http://dx.doi.org/10.1002/cyto.a.20507
[11] Wang, L., Gaigalas, A.K. and Yan, M. (2011) Quantitative Fluorescence Measurements with Multicolor Flow Cy-tometry. Flow Cytometry Protocols, 3rd Edition, Humana Press/Springer, New York, 53-65.
[12] Poncelet, P., Poinas, G., Corbeau, P., Devaux, C., Tubiana, N., Muloko, N., Tamalet, C., Chermann, J.C., Kourilsky, F., and Sampol, J. (1991) Surface CD4 Density Remains Constant on Lymphocytes of HIV-Infected Patients in the Pro-gression of Disease. Research in Immunology, 142, 291-298. http://dx.doi.org/10.1016/0923-2494(91)90078-W
[13] Davis, K.A., Abrams, B., Iyer, S.B., Hoffman, R.A. and Bishop, J.E. (1998) Determination of CD4 Antigen Density on Cells: Role of Antibody Valency, Avidity, Clones, and Conjugation. Cytometry, 33, 197-205.
http://dx.doi.org/10.1002/(SICI)1097-0320(19981001)33:2<197::AID-CYTO14>3.0.CO;2-P
[14] Wang L., Abbasi F., Ornatsky O., Cole K.D., Misakian M., Gaigalas A.K., He, H.-J., Marti, G.E., Tanner, S. and Steb-bings, R. (2012) Human CD4+ Lymphocytes for Antigen Quantification: Characterization Using Conventional Flow Cytometry and Mass Cytometry. Cytometry Part A, 81A, 567-575. http://dx.doi.org/10.1002/cyto.a.22060
[15] Technical Bulletin of BD Biosciences: BD_FACSDiva_Stndrd_App_Setup_TechBulletin.pdf
Abbreviations
FITC, fluorescein isothiocyanate;
PE, phycoerythrin;
PerCP-Cy5.5, peridinin-chlorophyll protein-cyanine 5.5;
PE-Cy7, phycoerythrin-cyanine 7;
APC, allophycocyanin;
APC-Cy7, allophycocyanin-cyanine 7;
HV450, Horizon V450;
HV500, Horizon V500;
LP, long pass filter;
BP, band pass filter;
CS & T beads, cytometer setting & tracking beads;
MFI, Median Fluorescence Intensity;
rSDEN, electronic noise robust standard deviation;
Lin Max, linearity maximum;
ND, normal donor;
ABC, antibody bound per cell;
FDA, Food and Drug Administration;
H. Degheidy
Supplement
Population FITC Mean
PE Mean
PerCP-Cy5.5 Mean
PE-Cy7 Mean
APC Mean
APC-Cy7 Mean
Pacific Blue Mean
AmCyan Mean
P3 180 205 210 44 273 274 109 200
P4 1324 823 1408 512 1982 3035 1094 2871
P5 33,273 25,903 39,391 25,034 31,579 83,303 19,983 69,327
P6 175 210 202 44 274 276 108 200
P7 1318 824 1407 511 1977 3030 1092 2866
P8 33,274 25,905 39,395 25,042 31,581 83,332 19,975 69,327
P9 175 202 213 39 273 273 105 199
P10 1318 821 1405 505 1980 3009 1095 2869
P11 33,275 25,906 39,389 25,032 31,588 83,310 19,976 69,330
P12 417 341 457 101 614 774 345 765
P13 1300 810 1376 586 1948 2987 1078 2822
P14 33,215 25,909 39,592 25,376 31,382 84,446 19,990 69,393
Continued
P16 1321 824 1407 511 1992 3035 1093 2873
P17 33,230 25,890 39,463 25,179 31,458 83,736 19,969 69,305
P18 177 206 202 42 271 288 107 202
P19 1331 831 1408 508 1990 3027 1111 2897
P20 33,177 25,878 39,585 25,421 31,334 84,447 19,968 69,322
P21 176 205 215 44 273 273 113 196
P22 1320 823 1404 512 1982 3036 1094 2872
P23 33,277 25,908 39,402 25,051 31,582 83,366 19,972 69,334
P24 175 204 206 45 274 273 104 203
P25 1320 823 1405 512 1981 3033 1094 2871
P26 33,270 25,900 39,384 25,024 31,573 83,274 19,990 69,322
Figure S1. Mean Fluorescent Intensity (MFI) values of cytometer setting & tracking (CS & T) beads on the target flow cytometer were obtained using FACS Diva software. After gating on the singlet’s using FSC-A vs. FSC-H, a subsequent gate on the two size beads using SSC-A vs. FSC-A was performed. The negative, dim and bright bead populations were gated in a histogram for each channel. The target MFIs for the eight fluorescence channels of the target flow cytometer are the MFIs of the bright CS & T bead population marked in the statistical review table on the right.The CVs for the bright CS & T bead population over the eight fluorescence channels are generally no more than 3%.
[image:12.595.89.537.98.242.2] [image:12.595.127.499.330.620.2]H. Degheidy
currently publishing more than 200 open access, online, peer-reviewed journals covering a wide range of academic disciplines. SCIRP serves the worldwide academic communities and contributes to the progress and application of science with its publication.
Other selected journals from SCIRP are listed as below. Submit your manuscript to us via either