http://dx.doi.org/10.4236/jcpt.2014.42014
Kinetic Study of Non-Isothermal
Crystallization in Se
90
−
x
Zn
10
Sb
x
(x = 0, 2, 4, 6)
Chalcogenide Glasses
Lamia Heireche, Mohamed Heireche, Maamar Belhadji
Physics Department, Faculty of Science, Oran University, Oran, AlgeriaEmail: [email protected], [email protected], [email protected]
Received 25 February 2014; revised 25 March 2014; accepted 1 April 2014
Copyright © 2014 by authors and Scientific Research Publishing Inc.
This work is licensed under the Creative Commons Attribution International License (CC BY).
http://creativecommons.org/licenses/by/4.0/
Abstract
Crystallization and glass transition kinetics of Se90−xZn10Sbx (x = 0, 2, 4, 6) chalcogenide glasses
prepared by conventional melt-quenching technique were studied under non-isothermal condi-tion using a differential scanning Calorimeter (DSC) measurement at different heating rates 5, 7, 10 and 12˚C/min. The glass transition temperatures Tg, the crystallization temperatures Tc and the
peak temperatures of crystallization Tp were found to be dependent on the compositions and the
heating rates. From the dependence on the heating rates of Tg and Tp, the activation energy for
glass transition, Eg, and the activation energy for crystallization, Ec, are calculated and their
com-position dependence is discussed. The activation energy of glass transition Eg, Avrami index n,
di-mensionality of growth m and activation energy of crystallization Ec have been determined from
different models.
Keywords
Crystallization Kinetics, Chalcogenide Glasses, Crystallization Temperature, Activation Energy, Differential Scanning Calorimetry
1. Introduction
applications such as photoreceptors in photocopying and laser printing [12]-[14]. The binary Se-Zn alloys have more advantages due to their wide band gap; they are an example of potential applications in optoelectronic de-vices like blue light emitting diodes and blue diode lasers [15] and white Light Emitting Diodes (LEDs) and in-frared lenses [16]. The proprieties of binary SeZn can be modified by adding a third element. The work pre-sented in this paper has been done with the purpose of studying the effect of Sb on various thermal parameters in binary Se-Zn system, the crystallization kinetics and the evaluation of the crystallization parameters of Se90-xZn10Sbx (x = 0, 2, 4, 6) glassy alloy under non-isothermal conditions. Using the differential scanning calo-rimetry (DSC) measurement, the kinetic parameters such as activation energy of glass transition Eg, Avrami in-dex n, dimensional growth m and activation energy of crystallization Ec have been determined from different models.
2. Experimental
Bulk sample of the Se90-xZn10Sbx (x = 0, 2, 4, 6) were prepared by the melt quenching technique. High purity materials (99.999%)were weighted according to their atomic percentages and were sealed in quartz ampoules under the vacuumof 10−5 Torr. The sealed ampoules are kept inside the furnace where the temperature was raised to 800˚C for 10 h. The ampoule was frequently rocked to ensure the homogeneity of the melt. The quenching was done in ice water to obtain the composition in the glass state.
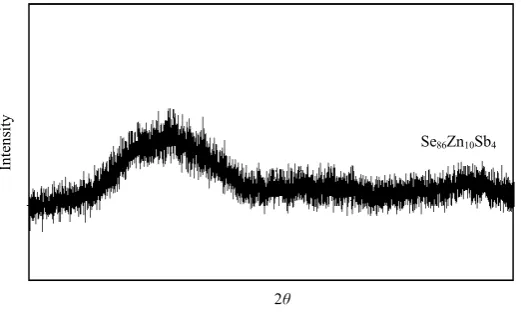
The amorphocity of the samples was confirmed by the absence of any sharp peak in the X-ray diffraction pat-tern, Figure 1 shows the X-ray diffraction pattern of Se86Zn10Sb4 glass at room temperature.
3. Results and Discussions
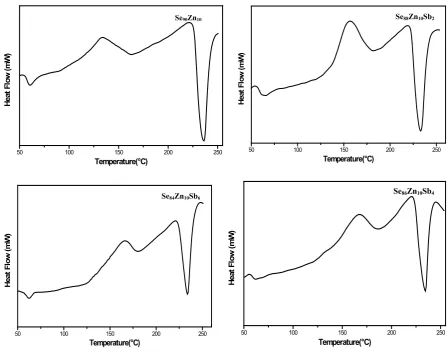
DSC therograms of glassy alloys Se90-xZn10Sbx (x = 0, 2, 4, 6) were recorded at different heating rate 10˚C/min is shown in Figure 2. The endothermic peak of glass transition, exothermic peak of crystallization and endother- mic pick present the melting of sample have been clearly observed in the Figure 2. The values of the glass tran- sition temperature Tg and the crystallization temperature Tc for each sample at different heating rates 5, 7, 10, 12˚C/min are given in Table 1. From the Table 1 it is clear that glass transition temperature Tg and crystalliza-tion temperature Tc both shift towards higher temperatures as the heating rate increases from 5 to 12˚C/min. is found that the glass transition temperature Tg decreases as Sb concentration increases and the crystallization temperature Tc increases with increasing Sb.
Glass transition region
Two approaches have been used to study the dependence of Tg on the heating rate α the first approach is the empirical relation suggested by Lasocka [17]
ln g
T = +A B α (1) where A and B are constants for a given glass composition. The value of A indicates the glass transition tem-perature for the heating rate of 1˚C/min, while B is proportional to the time taken by the system to reduce its glass transition temperature, when its heating rate is lowered from 10 to 1 K/min [18]. Figure 3 depicts the
In
te
ns
ity
Se86Zn10Sb4
[image:2.595.184.445.553.710.2]2θ
50 100 150 200 250 He at Fl ow (m W ) Temperature(°C)
Se90Zn10
50 100 150 200 250
He at Fl ow (m W ) Temperature(°C)
Se88Zn10Sb2
50 100 150 200 250
He at Fl ow (m W ) Temperature(°C)
Se84Zn10Sb6
50 100 150 200 250
He at Fl ow (m W ) Temperature(°C)
[image:3.595.85.534.80.434.2]Se86Zn10Sb4
Figure 2. DSC thermograms of Se90-xZn10Sbx (x = 0, 2, 4, 6) glassy alloys at heating rate of 10˚C/min.
Table 1.The values of glass transition temperature Tg and crystallization temperature Tc at different heating rates 5, 7, 10, 12˚C/min for Se90-xZn10Sbx (x = 0, 2, 4, 6) glassy alloys.
Heating rate (˚C/min)
Se90Zn10 Se89Zn10Sb2 Se88Zn10Sb4 Se86Zn10Sb6
Tg (K) Tc(K) Tg (K) Tc(K) Tg (K) Tc(K) Tg (K) Tc(K)
05 325 374 323 388 321 391 319 397
07 328 377 326 397 325 403 324 426
10 331 381 329 401 327 408 325 429
12 332 385 331 405 328 412 327 431
variation of the glass transition temperature Tg with lnα for the investigated Se90-xZn10Sbx (x = 0, 2, 4, 6) glassy systems. from Figure 3 the value of A and B can be obtained form the slop of straight line of the plot Tg versus lnα.
The calculated values of A and B for the different compositions are listed in Table 1.
The second approach is the evaluation of the activation energy for the glass transition Eg using Kissinger equ-ation [19]
(
2)
ln
α
Tgp = −E RTg gp+constant (2) [image:3.595.92.540.484.586.2]Se90-xZn10Sbx (x = 0, 2, 4, 6) glassy systems.
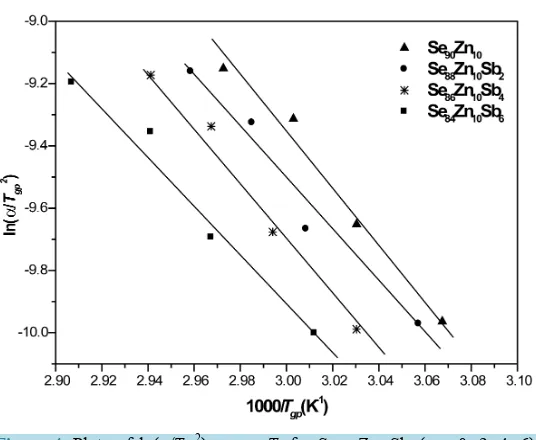
[image:4.595.181.447.146.342.2]The values of activation energy of glass transition Eg calculated from the slope of the straight line of the plots between ln(α/Tgp2) and 1000/Tgpare listed in Table 2. From Table 2 the value of Eg decreases with increasing Sb.
Figure 3. Plots of Tg versus lnα for Se90-xZn10Sbx (x = 0, 2, 4, 6) glasses.
Figure 4. Plots of ln(α/Tgp2) versus T
g for Se90-xZn10Sbx (x = 0, 2, 4, 6) glasses.
Table 2.The values of A, B and Activation energy of glass transition Eg for Se90-xZn10Sbx (x = 0, 2, 4, 6).
Composition A (K) B (min) Eg(KJ/mol)
Se90Zn10 312.30 ± 0.79 8.01 ± 0.37 73.92 ± 0.85
Se88Zn10Sb2 308.84 ± 1.67 9.02 ± 0.79 70.65 ± 1.03
Se86Zn10Sb4 307.33 ± 1.90 8.70 ± 0.90 68.98 ± 0.74
[image:4.595.181.449.364.584.2] [image:4.595.107.490.630.716.2]Crystallization region
The crystallization fraction x, can be expressed as a function of time according to the Johnson–Mehl–Avrami equation [20]-[22]:
( )
1 exp( )
nx t = − − kt (3)
where n is the Avrami exponent which depends on the mechanism of the growth and dimensionality of crystal growth and K is defined as the reaction rate constant and is given by:
(
)
0exp c
K=K −E kT (4)
where Ec is the activation on energy of crystallization, k is the Boltzmann constant, T is the isothermal tempera-tureand K0 is the frequency factor. The activation energy of crystallization Ec for Se90-xZn10Sbx (x = 0, 2, 4, 6) glassy system have been determined using Matusita, Kissinger and Ozawa methods.
3.1. Matusita Model
In the non-isothermal method, the crystallized fraction x, precipitated in a glass heated at constant rate α, is re-lated to the activation energy for crystallization Ec through the following expression [23] [24]
(
)
ln ln 1− −x = −nln
α
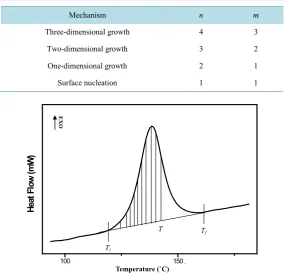
−1.052mE RTc +constant (5).where n is the Avrami index depending on the nucleation process, m is an integer which depends on the dimen-sionality of the crystal. Here n = m + 1 is taken for a quenched glass containing no nuclei and n = m for a pre-heated glass containing sufficiently large number of nuclei, the values of n and m for different crystallization are given in Table 3. The fraction volume x crystallized at any temperature T is given as x = S/ST, where ST is the total area of the exotherm between Ti where the crystallization just begins and the temperature Tfwhere the crystallization is completed and S is the area between Tiand T as shown by the hatched portion in Figure 5.
[image:5.595.155.442.420.696.2]Figure 6 shows linear plots of ln [−ln(1 − x)] versus lnα at three fixed temperatures for Se90-xZn10Sbx (x = 0,
Table 3. The Values of n and m for different crystallization mechanism.
Mechanism n m
Three-dimensional growth 4 3
Two-dimensional growth 3 2
One-dimensional growth 2 1
Surface nucleation 1 1
100 150
He
at
Fl
ow
(m
W
)
癈
Ti
Tf
T
E
XO
Temperature (˚C)
2, 4, 6) glasses system .Using Equation (5), the values of n have been determined from the slopes of these curves at each temperature and are given in Table 4 for Se90-xZn10Sbx (x = 0, 2, 4, 6) glassy system, the observed values reveal the dimension growth is two dimensional for the binary Se90Zn10 and three for the ternaries Se90-xZn10Sbx (x = 2, 4, 6).
Figure 7 shows the plot of ln[−ln(1 − x)] versus 1000/T for Se90-xZn10Sbx (x = 0, 2, 4, 6 ) at different heating rates 5, 7, 10 and 12˚C/min. The deviation from the straight line nature at higher temperature is due to saturation of nucleation sites during the latter stage in the process of crystallization [25] or to the restriction of crystal growth by the small size of the particles [26]. From Figure 7, the value of activation energy of crystallization Ec was calculated from the slope of the ln[−ln(1 − x)] versus 1000/T for all heating rates, the values are given in
[image:6.595.88.540.627.720.2]Figure 6.The plots of ln[−ln(1 −x)] versus lnα for different composition Se90-xZn10Sbx (x = 0, 2, 4, 6) at any fixed temperature.
Table 4. The values of Avrami index n and dimensionality of growth m.
Sample Se90Zn10 Se88Zn10Sb2 Se86Zn10Sb4 Se84Zn10Sb6
T (K) 384 392 400 405 411 415 402 407 415 405 410 415
n 4.14 0.52 ± 3.21 0.10 ± 2.13 0.18 ± 4.49 0.15 ± 3.85 0.26 ± 4.03 0.25 ± 4.39 0.22 ± 4.26 0.28 ± 3.66 0.40 ± 4.37 0.26 ± 4.44 0.41 ± 4.53 0.32 ±
Average value n 3.16 ± 0.26 4.12 ± 0.22 4.10 ± 0.30 4.11 ± 0.33
Table 5. From Table 5 the value of activation energy of crystallization Ec of Se Zn Sb glassy increases with de-creasing Sb.
3.2. Kissinger Method
The activation energy for crystallization Ec can be obtained from the heating-rate dependence on the peak tem-perature of crystallization Tp, using the Kissinger equation [19].
(
2)
ln
α
Tp = −E RTc p+constant (6) [image:7.595.186.411.630.720.2]Figure 7. The plots of ln[−ln(1 −x)] versus lnα at different heating rates for Se90-xZn10Sbx (x = 0, 2, 4, 6) glasses.
Table 5. The values of activation energy of crystallisation ob-tained from Matusita method.
Composition Ec(KJ/mol) Ec(eV)
Se90Zn10 93.53 ± 8.42 0.96 ± 0.08
Se88Zn10Sb2 104.44 ± 6.60 1.08 ± 0.06
Se86Zn10Sb4 127.52 ± 4.30 1.32 ± 0.04
A plot of ln(α/Tp2) versus 1/Tp for compositions Se90-xZn10Sbx (x = 0, 2, 4, 6 ) is shown in Figure 8 The slope of these straight lines gives the activation energy of crystallization Ec, the values of Ec for all compositions are given in Table 6.
3.3. Ozawa Method
The activation energy of crystallization Ec can also be obtained from the variation of the temperature at maxi-mum peak Tp with heating rate by using Ozawa’s [27] relation as
lnα = −E RTc p+constant (7)
The plots of lnα versus 1/Tp for different compositions are shown in Figure 9. The Values of the activation energy Ec for the crystallization processes are listed in Table 6.
4. Conclusion
[image:8.595.195.430.286.462.2]The crystallization kinetics in glassy Se90-xZn10Sbx (x = 0, 2, 4, 6) alloys have been studied under non-isother- mal conditions using the DSC technique. The glass transition temperature Tg decreases with an increase in the Sb
Figure 8. The plots of ln(α/Tp2) versus 1/T
p for Se90-xZn10Sbx (x = 0, 2, 4, 6) glasses.
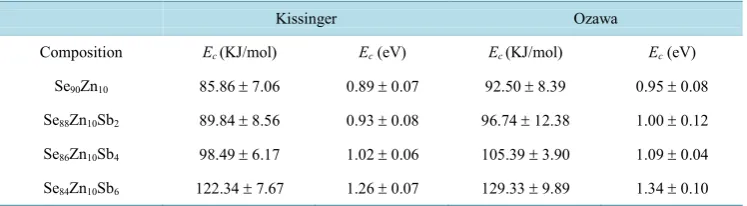
[image:8.595.195.434.495.689.2]Table 6.The values of activation energy of crystallisation obtained from Kissinger and Ozawa methods.
Kissinger Ozawa
Composition Ec(KJ/mol) Ec(eV) Ec(KJ/mol) Ec(eV)
Se90Zn10 85.86 ± 7.06 0.89 ± 0.07 92.50 ± 8.39 0.95 ± 0.08
Se88Zn10Sb2 89.84 ± 8.56 0.93 ± 0.08 96.74 ± 12.38 1.00 ± 0.12
Se86Zn10Sb4 98.49 ± 6.17 1.02 ± 0.06 105.39 ± 3.90 1.09 ± 0.04
Se84Zn10Sb6 122.34 ± 7.67 1.26 ± 0.07 129.33 ± 9.89 1.34 ± 0.10
contents and the crystallizationtemperature Tc increase with increase in Sb. The activation energy of glass tran-sition Eg calculated from Kissinger model decreases with the increase in Sb. The calculated values of the kinetic exponent n suggest two dimensional growth for the binary Se90Zn10 and three dimensional growth for ternaries Se90-xZn10Sbx (x = 0, 2, 4, 6 ), the activation energy of crystallization Ec has been calculated using Kissinger, Ozawa and Matusita models there are in good agreement with each other.
References
[1] Heireche, L. and Belhadji, M. (2009) A New Concept of Glass Transition and Modification of Johnson-Mehl-Avrami Equation in Chalcogenide Glass Ge-Sb-Te. Journal of Optoelectronics and Advanced Materials, 11, 1058-1066. [2] Yahia, I.S., Shakra, A.M., Fadel, M., Hegab, N.A., Salem, A.M. and Farid, A.S. (2011) Kinetics of Non-Isothermal
Crystallization of Ternary Se85Te15-xSbx Glassy Alloys. Chalcogenide Letters, 8, 453-467.
[3] Naqvi, S.F., Deepika, Saxena, N.S. Sharma, K. and Bhandari, D. (2010) Glass-Crystal Transformations in Se80-xTe20Agx (x = 0, 3, 5, 7 and 9) Glasses. Journal of Alloys and Compounds, 506, 956-962.
http://dx.doi.org/10.1016/j.jallcom.2010.07.128
[4] Abdel-Wahab, F.A., El-Hakim, S.A. and Kotkata, M.F. (2005) Electrical Conductivity and Crystallization Kinetics of Amorphous Se0.81In0.19 Films. Physica B, 366, 38-43. http://dx.doi.org/10.1016/j.physb.2005.05.018
[5] Ziani, N., Belhadji, M., Heireche, L., Bouchaour, Z. and Belbachir, M. (2005) Crystallization Kinetics of Ge20Te80 Chalcogenide Glasses Doped with Sb. Physica B: Condensed Matter, 358, 132-137.
http://dx.doi.org/10.1016/j.physb.2004.12.068
[6] Majeed Khan, M.A., Kumar, S., Husain, M. and Zulfequar, M. (2008) The Effect of Annealing on the Electrical Con-duction of Amorphous Bi0.5Se99.4Zn0.1 Thin Films. Materials Letters, 62, 1572-1574.
http://dx.doi.org/10.1016/j.matlet.2007.09.025
[7] Ammar, A.H., Abdel-Moniem, N.M., Farag, A.A.M. and Farag, E.-S.M. (2012) InfluenceofIndium Contenton the Optical, ElectricalandCrystallization KineticsofSe100-x Inx Thin Films Depositedby Flash Evaporation Technique
Physica B, 407, 356-360. http://dx.doi.org/10.1016/j.physb.2011.10.053
[8] Hunt, D.C., Kirby, S.S. and Rowlands. J.A. (2002) X-Ray Imaging with Amorphous Selenium: X-Ray to Charge Con-version Gain and Avalanche Multiplication Gain. Medical Physics, 29, 2464-2471.
http://dx.doi.org/10.1118/1.1513157
[9] Zhang, J., Zhang, S.Y., Xu, J.J. and Chen, H.Y.(2004) A New Method for the Synthesis of Selenium Nanoparticles and the Application to Construction of H2O2 Biosensor.Chinese Chemical Letters, 15, 1345-1348.
[10] Yamada, N., Ohno, E., Akahira, N., Nishiuchi, K., Nagata, K. and Takao, M. (1987) Proceedings of the International Symposium on Optical Memory. Japanese Journal of Applied Physics, Tokyo, 26.
[11] Thornburg, D.D. (1972) Memory Switching in Amorphous Arsenic Triselenide. Journal of Non-Crystalline Solids, 11, 113-120.
[12] Le Neindre, L., Smektala, F., Le Foulgoc, K., Zhang, X.H. and Lucas, J. (1998) Tellurium Halide Optical Fibers.
Journal of Non-Crystalline Solids, 242, 299-103.
[13] Akiyama, T. Uno, M. Kitaura, H., Narumi, K., Kojima, R., Nishiuchi, K. and Yamada, N. (2001) Rewritable Dual- Layer Phase-Change Optical Disk Utilizing a Blue-Violet Laser.Japanese Journal of Applied Physics, 40, 1598-1603. http://dx.doi.org/10.1143/JJAP.40.1598
[14] Ohta, T. (2001) Phase-Change Optical Memory Promotes the DVD Optical Disk. Journal of Optoelectronics and Ad-vanced Materials, 3, 609-626.
State Sciences, 12, 963-965. http://dx.doi.org/10.1016/j.solidstatesciences.2010.01.028
[16] Bhargava, R.N. (1997) Properties of Wide Band Gap II—VI Semiconductors. INSPEC, IEE, London.
[17] Lasocka, M. (1976) The Effect of Scanning Rate on Glass Transition Temperature of Splat-Cooled Te85Ge15. Materials
Science and Engineering, 23, 173-177.
[18] Naqvi, S.F. and Saxena, N.S. (2012) Kinetics of Phase Transition and Thermal Stability in Se80-xTe20Znx (x= 2, 4, 6, 8, and 10) Glasses. Journal of Thermal Analysis and Calorimetry, 108, 1161-1169.
http://dx.doi.org/10.1007/s10973-011-1857-2
[19] Kissinger, H.E. (1957) Reaction Kinetics in Differential Thermal Analysis. Analytical Chemistry, 29, 1702-1706. http://dx.doi.org/10.1021/ac60131a045
[20] Avrami, M. (1939) Kinetics of Phase Change. I. General Theory. Journal of Chemical Physics, 7, 1103-1112. http://dx.doi.org/10.1063/1.1750380
[21] Avrami, M. (1940) Kinetics of Phase Change. II. Transformation-Timerelations for Random Distribution of Nuclei.
Journal of Chemical Physics, 8, 212-224. http://dx.doi.org/10.1063/1.1750631
[22] Avrami, M. (1941) Granulation, Phase Change and Microstructure Kinetics of Phase Change. III. Journal of Chemical Physics, 9, 177-184. http://dx.doi.org/10.1063/1.1750872
[23] Afify, N. (1992) Calorimetric Study on the Crystallization of a Se0.8Te0.2 Chalcogenide Glass. Journal of Non-Cry-
stalline Solids, 142, 247-259.
[24] Matusita, K., Konastsu, T. and Yokota. R. (1984) Kinetics of Non-Isothermal Crystallization Process and Activation Energy for Crystal Growth in Amorphous Materials. Journal of Materials Science, 19, 291-296.
[25] Colmenero, J. and Barandiaran, J.M. (1979) Crystallization of Al23Te77 Glasses. Journal of Non-Crystalline Solids, 30, 263-271.
[26] Kaur, G. and Komatsu, T. (2001) Crystallization Behavior of Bulk Amorphous Se-Sb-In System. Journal of Materials Science, 36, 4531-4533.
[27] Ozawa, T. (1965) A New Method of Analyzing Thermo Gravimetric Data. Bulletin of the Chemical Society of Japan,
![Figure 7 shows the plot of ln[of nucleation sites during the latter stage in the process of crystallization rates 5, 7, 10 and 12growth by the small size of the particles was calculated from the slope of the ln[−ln(1 − x)] versus 1000/T for Se90-xZn10Sbx (](https://thumb-us.123doks.com/thumbv2/123dok_us/8034472.769808/6.595.103.496.206.575/figure-nucleation-process-crystallization-growth-particles-calculated-versus.webp)
![Figure 7. The plots of ln[−ln(1 − x)] versus lnα at different heating rates for Se90-xZn10Sbx (x = 0, 2, 4, 6) glasses](https://thumb-us.123doks.com/thumbv2/123dok_us/8034472.769808/7.595.115.519.182.580/figure-plots-versus-lna-different-heating-rates-glasses.webp)