International Journal of Computer Applications (0975 – 8887) Volume 79 – No 12, October 2013
Clustering the Age Classified Preprocessed Automated
Blood Cell Counter Data using K-Means First Distinct
Element Selection and Random Selection Algorithms
D. Minnie
Department of Computer Science Madras Christian College Tambaram East, Chennai
Tamil Nadu, India
S. Srinivasan
Department of Computer Science and Engineering Anna University Regional Office
Madurai Tamil Nadu, India
ABSTRACT
The raw Complete Blood Count (CBC) or Full Blood Count (FBC) data from an Automated Blood Cell Counter are collected and transformed in to a Preprocessed and Flattened data using the preprocessing phases of the Knowledge Discovery in Databases. The data is classified into child and adult data sets. The transformed data is used to create clusters of the database in this paper. The K-Means algorithm with two initial mean selection such as first element selection and random element selection is applied on the attributes of the Automated Blood Cell Counter Data to form various clusters. Twelve thousand records are taken from a clinical laboratory for processing.
General Terms
Algorithms.
Keywords
Hematology, Blood Cell Counter, Knowledge Discovery in Databases, Data Mining, Clustering, K-Means Clustering.
1.
INTRODUCTION
A huge volume of automated medical data are currently available in various forms such as text, numbers, combination of text and numbers, images, scan reports, video and audio reports. This data are used along with various analysis techniques to generate results that can be used by the health care professionals in efficient decision making.
Hematology is the study of blood, diseases related to blood and blood forming organs such as bone marrow. Clinical Pathology is a study that is concerned with conducting laboratory experiments on body fluids such as blood and urine to diagnose diseases. Hematology department of Clinical Pathology performs various tests on blood. Some of the common tests on blood are the Complete Blood Count (CBC) to diagnose diseases such as anemia and some types of blood cancers, Erythrocyte Sedimentation Rate (ESR) to diagnose inflammation and Prothrombin Time (PT) to diagnose coagulation disorders.
Complete Blood Count (CBC) [1] or Full Blood Count (FBC) of the blood can be found using either a manual procedure or an automated procedure. A Blood Cell Counter [2] is an automated system that generates the CBC blood test results.
The preprocessing phases of the Knowledge Discovery in Databases (KDD) [3,4] is used to convert the raw Automated Blood Cell Counter Data into a form that is appropriate for the
Data Mining process and then to generate meaningful results from data. The KDD steps are hence applied in this paper on the blood cell counter data to generate knowledge.
Various combinations of Data Mining classification algorithms are used on medical data for efficient classification of the data. [5] K-Means clustering is used to predict missing attribute values in four types of medical data sets such as Dermatology, Cleveland Heart, Lung Cancer and Wisconsin. [6] Data mining techniques are used to explore physicians' therapeutic decisions when clinical guidelines do not provide recommendations.[7]
Medical data is taken most of the times from medical records [8] and the data is found to be heterogeneous in nature. The privacy issues are to be finalized before handling medical data. [9] The data that is taken from the Blood Cell Counter for our work is De-identified and the patient id and names are changed by the Clinical Pathology department before supplying the medical data for analysis.
The quality of Blood Cell Counter Data is ensured by the application of range checks and delta checks on the various attributes of the data.[10] Association rules are generated for the Automated Blood Cell Counter Data.[11] Automated Blood Cell Counter Data is clustered using the RBC attribute where the initial mean is selected as first k elements from the sorted ABCC data. [12] Genetic Algorithm (GA) and Entropy based fuzzy clustering (EFC) are used to assign k-means initial cluster centers for clustering PIMA Indian diabetic dataset. [13]
2.
MATERIALS AND METHODS
2.1 Automated Blood Cell Counter Data
A Blood Cell Counter is an automated machine that can be loaded with blood samples and Complete Blood Count of the given blood samples are generated as an excel report. The report also contains the patient id, hospital number, date and time of the test which are extracted from the barcode pasted on the blood sample container. The number of red blood cells, white blood cells and platelets are some of the blood counts generated by the Automated Blood Cell Counter.
2.2 Data collection
2.3 Automated Blood Cell Counter Data
Format
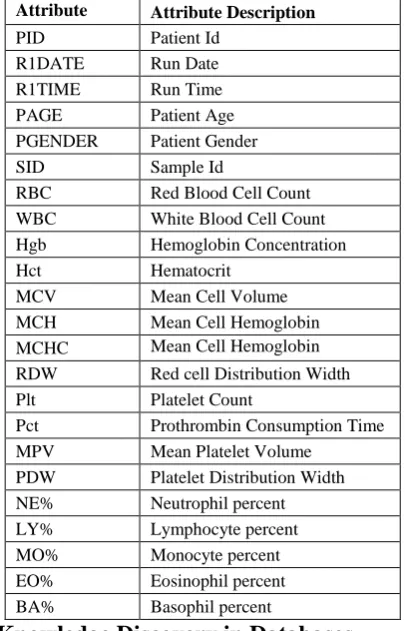
[image:2.595.74.277.185.501.2]The Blood Cell Counter Data is given as an excel file. The Blood Cell Counter data consists of values for each sample of blood for the various attributes such as RBC, WBC, PId, SId, PAge, PGender, RDate, RTime, Hgb, MCH and so on. The list of attributes5 along with a detailed description is shown in table 1. A sample of the data is given in table 2.
Table 1. Automated Blood Cell Counter Data Attributes Attribute
Name
Attribute Description
PID Patient Id
R1DATE Run Date
R1TIME Run Time
PAGE Patient Age
PGENDER Patient Gender
SID Sample Id
RBC Red Blood Cell Count WBC White Blood Cell Count Hgb Hemoglobin Concentration
Hct Hematocrit
MCV Mean Cell Volume
MCH Mean Cell Hemoglobin MCHC Mean Cell Hemoglobin
Concentration
RDW Red cell Distribution Width
Plt Platelet Count
Pct Prothrombin Consumption Time MPV Mean Platelet Volume
PDW Platelet Distribution Width NE% Neutrophil percent
LY% Lymphocyte percent
MO% Monocyte percent
EO% Eosinophil percent BA% Basophil percent
2.4 Knowledge Discovery in Databases
(KDD)
The data is subjected to the KDD processes to generate knowledge from it. The processes include Data Cleaning,
Data Integration, Data Selection, Data Transformation, Data Mining, Generation of Patterns and Knowledge Interpretation.
In Data Cleaning the irrelevant data are removed from the collected data. In Data Integration multiple sources are combined into a data warehouse. The Data Selection process is involved with the selection of data relevant to the analysis and extracting them from the integrated data. The selected data is transformed to the appropriate form for the mining procedure.
The process of extracting useful and implicit information from the transformed data is referred to as Data Mining. In Pattern Evaluation interesting patterns are identified from the processed data. The discovered knowledge is visually presented to the user in the Knowledge Representation process.
2.5 Data Mining
Data Mining is the Knowledge Discovery stage of KDD and it is the process of extracting implicit, useful, previously unknown, non-trivial information from data. The techniques involved in Data Mining are grouped as Classification, Clustering, Association Rules and Sequences that represent the knowledge generated from the data.
Classification is a supervised learning process and it maps data into known classes using Decision Trees, Neural Networks and Genetic Algorithms. Clustering is an unsupervised learning and it groups similar data into unknown clusters using K-Means, Nearest Neighbour and various other algorithms. Association Rule Mining (ARM) uncovers relationships among data in a database.
2.6 Classification
Classification is used to classify each item in a set of data into one of the predefined set of classes or groups. Classification techniques use Decision Trees, Neural Networks and so on. Classification algorithms are supervised in nature as they use the class labels.
2.7 Clustering
Clustering is the task of assigning a set of objects into groups so that objects in the same group are more similar to each other than the objects in other groups. Clustering is an unsupervised algorithm and it does not use class labels. The class labels are needed for the Classification algorithms.
Table 2. Sample Automated Blood Cell Counter Data
Patient ID Gende
r
Run1
Date Age
WB C
RB
C Hgb Hct
MC
V MCH
MCH C
RD
W Plt Pct
MP V
110324010 1
Male 01/02/201 1
30"Years "
4.43 4.97 6
17.2 4
50.5 1
101.5 34.64 34.13 13.9 8 235. 8 0.18 2 7.75 110324010 2
Male 01/02/201 1 24"Years " 15.5 2 3.38 9
9.44 28.4 1
83.84 27.86 33.23 16.2 2 343. 2 0.29 7 8.66 01/02/201 1
6.82 4.50 6
13.9 7
41.2 1
91.46 30.99 33.89 13.0 2 143. 9 0.20 2 14.0 8 110324010 4
Male 01/02/201 1
50"Years "
4.26 1.96 1
7 20.1 102.5 35.68 34.81 18.8 4
93.4 0.07 8 8.35 110324010 5 Femal e 01/02/201 1 44"Years " 14.2 1 3.64 2 11.0 9 31.9 4
87.7 30.44 34.72 12.7 272. 8 0.25 6 9.39 110324010 6 Femal e 01/02/201 1 23"Years " 16.3 9 3.84 5
8.66 27.3 9
71.22 22.51 31.61 18.9 2 184. 8 0.23 1 12.5 4 110324010 7
Male 01/02/201 1
39"Years "
9.48 2.32 9
7.41 21.4 3
92.03 31.81 34.56 14.1 3
92 0.08 5
9.25
110324010 8
Male 01/02/201 1
51"Years "
7.99 4.72 9
14.1 8
41.7 6
88.31 29.98 33.95 15.7 3
87.7 0.07 1
8.19
110324010 9
Male 01/02/201 1 73"Years " 15.6 5 4.09 2 12.0 7 36.1 5
88.35 29.5 33.39 13.8 2 223. 1 0.26 6 11.9 4 110324011 1
Male 01/02/201 1
54"Years "
7.79 2.33 3
6.73 20.1 9
[image:2.595.60.547.577.751.2]International Journal of Computer Applications (0975 – 8887) Volume 79 – No 12, October 2013
Some of the major clustering models are Centroid based clustering, Density based clustering, Connectivity based clustering and Distribution based clustering. The K-Means Clustering is a Centroid based clustering model in which the database is partitioned into K clusters in which each record belongs to the cluster with the nearest mean value. The
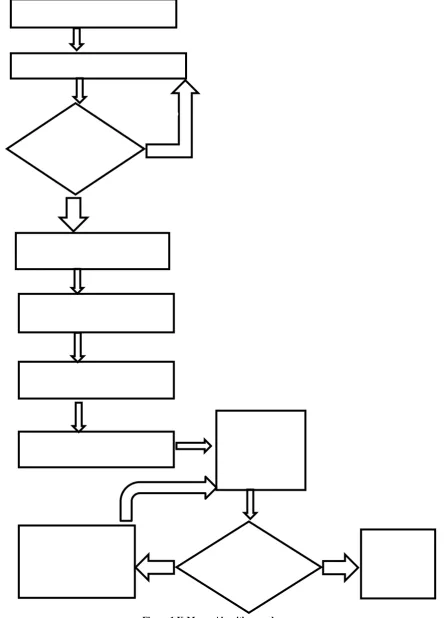
[image:3.595.89.534.140.759.2]algorithm starts with given initial set of mean values and allocates each object to a cluster with nearest mean value. The mean values for each cluster are calculated then using the elements in each cluster. The K-Means algorithm used for this paper is shown in figure 1.
Figure 1 K-Means Algorithm used
s
Assign initial mean according
to the method selected
Assign NA to all missing values
in the attribute
Mean is
recalculated for
each cluster
Create dynamic tables for the
process
Assign all the values to the
nearest initial mean
Again values are
assigned to the
nearest initial mean
Get the K value from the user
>12Classified Data
groupIf
selected
attribute has k
distinct values
Yes
No
If new mean
and previous
mean are same
International Journal of Computer Applications (0975 – 8887) Volume 79 – No 12, October 2013
[image:4.595.56.282.119.274.2]The ABCC Data are clustered using two initial mean selection techniques such as First K distinct elements selection and K Random elements selection. The interface for the application is shown in figure 2.
Figure 2 application Interface
3.
RESULTS AND DISCUSSION
The Cell Counter Data was taken as a raw data and the preprocessing phase of the KDD process was applied on the data to generate transformed data that was used to extract knowledge from the data.
3.1 Data Cleaning
The process of detecting and correcting or removing corrupt or inaccurate records from a record set, table, or database is Data Cleaning. The missing values in the Blood Cell Counter
data cannot be replaced by any other value and hence those records were not considered for further processing.
The attributes RBC, WBC, Hg count, MCH, MCHC, MCV, MPV, PCT, RDW and WBC components percentages were required for analyzing the blood cell counter data and hence the records without these fields were removed. The resultant excel file contained the records with patient id, gender, age, date and time of results and the blood count fields were selected for further processing.
3.2 Data Selection
The cleaned blood cell counter data was taken as the data source for data selection process. The attributes Patient Id, Age, RBC, MCV, MCH, MCHC and RDW were selected for the knowledge generation from the ABCC data and a sample of the selected data is shown in table 3.
3.3 Data Transformation
In the Data Transformation stage the data are transformed or consolidated in to forms appropriate for mining. The excel data is converted into a SQL Data base.
3.4 Classification
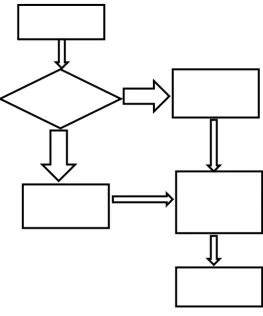
[image:4.595.119.383.396.713.2]The entire Automated Blood Cell Counter Data is classified using Decision Tree algorithm into two sets such as Adult and Child based on the age of the patient. If the age of the patient is less than 12, then the record is for a child and otherwise for adult and is shown in figure 3.
Figure 3 Child, Adult Classification
Preprocessed
Data
Select data
with age <=12
Select only red
cell
components
Start Clustering
process
Select data
with age
Select Age
ChildYe
Ad
u
International Journal of Computer Applications (0975 – 8887) Volume 79 – No 12, October 2013
Table 3 Sample Preprocessed Data
Patient ID Age WBC RBC Hgb Hct MCV MCH MCHC RDW Plt Pct MPV
1103240101 30"Years" 4.43 4.976 17.24 50.51 101.5 34.64 34.13 13.98 235.8 0.182 7.75
1103240102 24"Years" 15.52 3.389 9.44 28.41 83.84 27.86 33.23 16.22 343.2 0.297 8.66
1103240104 50"Years" 4.26 1.961 7 20.1 102.5 35.68 34.81 18.84 93.4 0.078 8.35
1103240105 44"Years" 14.21 3.642 11.09 31.94 87.7 30.44 34.72 12.7 272.8 0.256 9.39
1103240106 23"Years" 16.39 3.845 8.66 27.39 71.22 22.51 31.61 18.92 184.8 0.231 12.54
1103240107 39"Years" 9.48 2.329 7.41 21.43 92.03 31.81 34.56 14.13 92 0.085 9.25
1103240108 51"Years" 7.99 4.729 14.18 41.76 88.31 29.98 33.95 15.73 87.7 0.071 8.19
1103240109 73"Years" 15.65 4.092 12.07 36.15 88.35 29.5 33.39 13.82 223.1 0.266 11.94
1103240111 54"Years" 7.79 2.333 6.73 20.19 86.54 28.85 33.33 19.39 187.6 0.216 11.52
3.5 Clustering
The classified ABCC Adult data and ABCC child data are separately clustered using the attributes of the ABCC Data into K clusters where the K value is given by the user. The attributes RBC, MCV, MCH, MCHC and RDW are used for clustering. The initial mean selections First element selection and Random element selection generates different set of clusters of data.
In the first element selection method the first K elements are taken as the starting mean values and all the elements are compared with the mean values and the records are placed in the cluster in which the element value and the mean value are closer. If there is a tie the element is placed in the first cluster among the set of equal clusters. The final cluster mean values are also generated. In the Random element selection method, K random elements are selected as the starting mean values.
The cluster details such as the minimum element, maximum element, average value of the elements, number of elements per each cluster and the number of iterations for the completion of the clustering process are recorded.
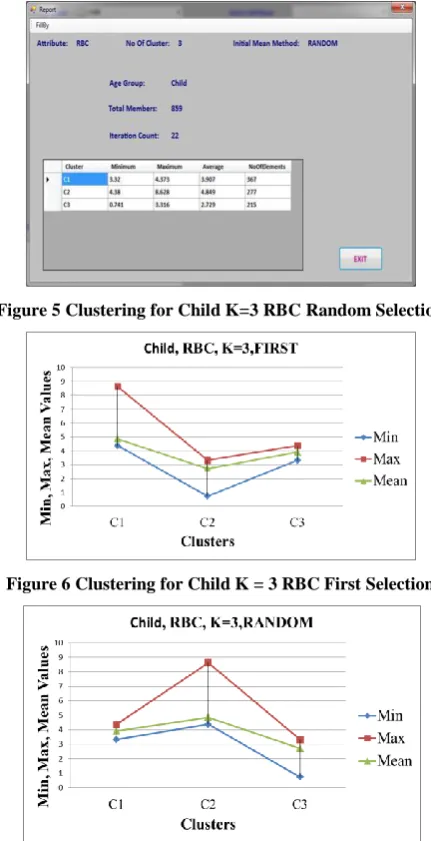
Figure 4 shows the clustering details for the classified Child data for attribute RBC and K = 3 and initial selection of First element selection and figure 5 shows the cluster details for Random element selection.
Figure 4 Clustering for Child K = 3 RBC First Selection
The cluster details such as minimum, maximum and average for child, RBC, K = 3 and for the first element selection and
[image:5.595.328.528.294.446.2]random element selection are shown in a graphical representation in figures 6 and 7.
Figure 5 Clustering for Child K=3 RBC Random Selection
Figure 6 Clustering for Child K = 3 RBC First Selection
Figure 7 Clustering for Child K=3 RBC Random Selection
[image:5.595.318.534.297.718.2] [image:5.595.56.283.545.711.2]3,4,5 and for the First selection and Random selection of initial mean selection are given in table 4.
Table 4 Iteration Table for Child and Adult for RBC K = 3,4,5 and First selection and Random selection
K-Value
Child Adult
First Random First Random
3 7 22 27 11
4 17 16 40 21
5 23 10 64 76
The results show that the number of iterations required for clustering child data for RBC using First Selection is better
than Random Selection for K = 3 and is equal for K = 4 and is not better for K = 5 whereas the number of iterations required for clustering adult data for RBC using Random Selection is better than First Selection for K = 3 and 4 and is not better for K = 5.
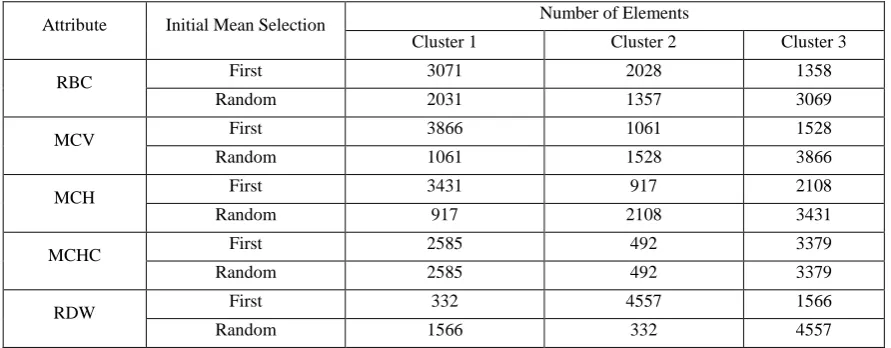
The number of elements in each of the clusters formed using RBC, MCV, MCH, MCHC and RDW when the k value is 3 for First Selection and Random Selection are given in table 5.
The results show that there is not much difference in the performance of clustering by First Selection and Random Selection with respect to the number of elements per cluster.
Table 5 No. of elements K = 3, First selection and Random selection for RBC, MCV, MCH, MCHC and RDW for Adult ABCC Data
Attribute Initial Mean Selection Number of Elements
Cluster 1 Cluster 2 Cluster 3
RBC First 3071 2028 1358
Random 2031 1357 3069
MCV First 3866 1061 1528
Random 1061 1528 3866
MCH First 3431 917 2108
Random 917 2108 3431
MCHC First 2585 492 3379
Random 2585 492 3379
RDW First 332 4557 1566
Random 1566 332 4557
4.
CONCLUSION
A brief study of Hematology, Automated Blood Cell Counter and Blood Cell Counter data is presented in the paper. The format of the blood cell counter result was described and few of the attributes were selected for processing, based on the knowledge given by the Clinical Pathologist. The KDD steps were explained and were applied on the Blood Cell Counter Data to convert the raw data into a transformed data and clusters are formed using two initial mean selection such as first selection and random selection. The performances of the two selection methods are compared.
A single test result was considered here and the data is to be collected from various laboratories and various Blood Cell Counter machines for integrating the data.
5.
ACKNOWLEDGMENTS
The authors wish to thank Dr. Joy John Mammen, MD, Department of Transfusion Medicine and Immunohematology, Christian Medical College, Vellore, Tamilnadu, India for sharing his knowledge in Hematology, specially the functions of the Blood Cell Counter and also for providing the De-identified blood cell counter data.
6.
REFERENCES
[1] Complete Blood Count (CBC) with Five-Part Differential NHANES 2003–2004, pp. 3 – 4.
[2] Automated Blood Cell Counter: www.medscape.com
[3] Jaiwei Han, Michelinne Kamber, Data Mining : Concepts and Techniques, Morgan Kaufmann Publishers, Second Edition, 2006
[4] Margaret H.Dunham, Data Mining: Introductory and Advanced Topics, Pearson Education, 2007.
[5] Alp Aslandogan Y. and Gauri A.Mahajani, Evidence Combination in Medical Data Mining, Proceedings of the International Conference on Information Technology: Coding and Computing (ITCC’04), Volume 2, 2004, pp. 465 – 469
[6] Suguna, N. and K.G. Thanushkodi, 2011. Predicting missing attribute values using k-means clustering. Journal of Computer Science, Volume 7, issue 2, pp. 216-224.
[7] Massoud Toussi, Jean-Baptiste Lamy, Philippe Le Toumelin, and Alain Venot, Using data mining techniques to explore physicians' therapeutic decisions when clinical guidelines do not provide recommendations: methods and example for type 2 diabetes, BMC Medical Informatics and Decision Making 2009; pp. 9:28
[image:6.595.75.521.270.444.2]International Journal of Computer Applications (0975 – 8887) Volume 79 – No 12, October 2013
[9] Cios KJ, Moore GW, Uniqueness of Medical Data Mining, Artificial Intelligence in Medicine, 2002 Sep-Oct; 26(1-2): 2002, pp. 1- 24.
[10]Minnie D, Srinivasan S, Application of Knowledge Discovery in Database to Blood Cell Counter Data to Improve Quality Control in Clinical Pathology, Proceedings of 6th International Conference on Bio Inspired Computing – Theory and Applications 2011, September 2011, pp 338 – 342.
[11]Minnie D, Srinivasan S, Preprocessing and Genearation of Association Rules for Automated Blood Cell Counter Data in Haematology, Proceedings of International Conference on Recent Advances in Computing and Software Systems 2012, April 2012, pp 27 – 32.
[12] Minnie D, Srinivasan S, Clustering the Preprocessed Automated Blood Cell Counter Data using modified K-Means algorithms and Generation of Association Rules, International Journal of Computer Applications (IJCA), August 2012, 52(17), Foundation of Computer Science, New York, USA, pp. 38-42.