http://dx.doi.org/10.4236/ojce.2016.62017
How to cite this paper: Chaudhari, D.J. and Dhoot, G.O. (2016) Performance Based Seismic Design of Reinforced Concrete
Performance Based Seismic Design of
Reinforced Concrete Building
Dilip J. Chaudhari, Gopal O. Dhoot*Applied Mechanics Department, Government College of Engineering, Amravati, India
Received 6 February 2016; accepted 27 March 2016; published 30 March 2016
Copyright © 2016 by authors and Scientific Research Publishing Inc.
This work is licensed under the Creative Commons Attribution International License (CC BY). http://creativecommons.org/licenses/by/4.0/
Abstract
In past two decades earthquake disasters in the world have shown that significant damage oc-curred even when the buildings were designed as per the conventional earthquake-resistant de-sign philosophy (force-based approach) exposing the inability of the codes to ensure minimum performance of the structures under design earthquake. The performance based seismic design (PBSD), evaluates how the buildings are likely to perform under a design earthquake. As com-pared to force-based approach, PBSD provides a methodology for assessing the seismic perfor-mance of a building, ensuring life safety and minimum economic losses. The non-linear static pro-cedures also known as pushover analysis are used to analyze the performance of structure under lateral loads. Pushover analysis gives pattern of the plastic hinge formations in structural mem-bers along with other structural parameters which directly show the performance of member af-ter an earthquake event. In this paper, a four-storey RC building is modelled and designed as per IS 456:2000 and analyzed for life safety performance level in SAP2000 v17. Analysis is carried out as per ATC 40 to find out storey drift, pushover curve, capacity spectrum curve, performance point and plastic hinges as per FEMA 273 in SAP2000 v17. From the analysis, it is checked that the per-formance level of the building is as per the assumption.
Keywords
PBSD, Performance Level, Pushover Analysis, Performance Point, Plastic Hinge
1. Introduction
As per the conventional earthquake-resistant design philosophy, the structures are designed for forces which are much less than the expected design earthquake forces. Hence, when a structure is struck with severe earthquake
ground motion, it undergoes inelastic deformations. Even though the structure may not collapse, the damages can be beyond repairs. These methods usually don’t consider the expected performance level and seismic risk levels of the structure after an earthquake event. Since, these methods give high base shear, high ductility de-mand and also don’t give the actual performance of structure after an earthquake event need of new method comes which would give the actual performance of the structure after an earthquake event.
2. Literature Survey
The literature shows considerable research in PBSD. This research is reviewed keeping in view the methodology, principles and various aspects of PBSD. Some of related works are discussed below.
Seismic evaluation and retrofitting of concrete buildings are studied considering seismic safety and re-streng- thening [1]. Also pre-standard and commentary for the Seismic Rehabilitation of Buildings are provided by ASCE FEMA repost where provisions are given for the same [2]-[4]. This paper outline and compares the three methods along with discussion in the context of traditional force based seismic design and earlier design ap-proaches of performance based design. Factors defining different performance states were discussed including the need to include residual displacement as a key performance limit. Sashi K. Kunnath (2006), conducted study on seismic design and evaluation of building structures using PBSD. Deterministic approach and probabilistic approach is discussed in which capacity spectrum method from ATC-40 and standard pushover analysis from FEMA 356 is in brief. Comparative study of ATC-40 and FEMA 356 is done (Farzad Naeim, Hussain Bhatia, 2008). This paper provides a basic understanding of the promises and limitations of performance based seismic engineering. The state-of-the-art methodologies and techniques embodied in the two leading guidelines on this subject ATC-40 and FEMA 273/274 are introduced and discussed. Numerical examples are provided to illu-strate the practical applications of the methods discussed (Vivinkumar, R.V., 2013). This study explains about two major seismic design methods (i.e.) Force based design and direct displacement based design in which for-mer is a conventional method while later one is a performance approach of design. Design and analysis were done on two dimensional bare frames of four, eight and twelve stories based on following codes IS 456, IS 1893:2000, FEMA 356 and the two design approaches were studied [5].
3. System Development
3.1. Performance Based Seismic Design
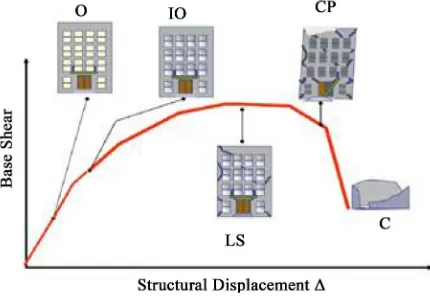
Performance based seismic design is a process of designing new buildings or seismic up-gradation of existing buildings, which includes a specific intent to achieve defined performance objectives in future earthquakes. Performance objectives relate to expectations regarding the amount of damage a building may experience in re-sponse to earthquake shaking and the consequences of that damage. Performance objectives are operational (O), immediate occupancy (IO), life safety (LS), collapse prevention (CP), in which Life safety is the major focus to reduce the threats to the life safety of the structure in Figure 1.
[image:2.595.204.419.558.708.2]Performance based design approach in which performance levels are described in terms of displacement as damage is better correlated to displacements rather than forces. The fundamental goal of PSBD is to obtain a
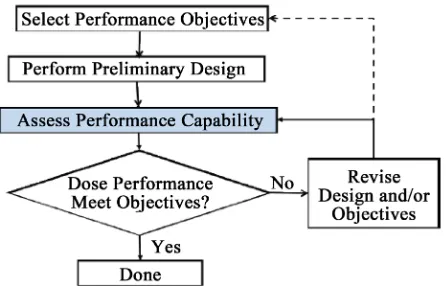
structure which will reach a target displacement profile when subjected to earthquakes consistent with a given reference response spectrum. The performance levels of the structure are governed through the selection of suitable values of the maximum displacement and maximum inter storey drift. Figure 2 shows the typical process of design is to be followed.
3.2. Capacity Response Spectra
The conventional response spectrum is represented by the acceleration versus period relationship for different damping levels. In the capacity response spectrum format, the period axis is converted in the displacement axis. The structure period T is represented by radial lines, instead of being the horizontal axis. The advantage of this representation is that both strength and displacement demands are evident in a single graph. The elastic dis-placement demand and the structure period may be determined for elastic forces. Considering the inelastic be-haviour, the inelastic displacement at the reduced force is obtained in the horizontal branch of the capacity curve corresponding to the intersection with inelastic reduced spectra. At the same time, the reduced period due to inelastic deformation may be determined. Another advantage of this representation is that both earthquake de-mands and structure capacity may be compared directly from the same figure.
3.3. Structural Model Development
In the present work, a four storey RC frame building situated in zone IV is taken for the purpose of study. It consists of 2 bays of 5 m each in X-direction and 2 bays of 4 m each in Y-direction. The total height of the building is 14 m. The building is modelled and designed as per IS 456:2000 in SAP 2000 v17.
Material Properties: Grade of Concrete: M 25
Grade of Reinforcing Steel: Fe-415 Elastic Modulus = 5000 fck0.5
Sectional Properties:
Size of Beam = 350 mm × 500 mm Size of Column = 350 mm × 350 mm Thickness of Slab = 125 mm
Tensile Strength = 0.7 fck0.5
Loading Considered: Dead Load:
a) Roof Level:
Weight of Slab = 3.125 kN/m2 Weight of F.F. = 3.2 kN/m2 b) Floor Level:
Weight of Slab = 3.125 kN/m2 Weight of F.F. = 2.260 kN/m2
[image:3.595.204.427.562.705.2]Weight of Partition Walls = 1.5 kN/m2
Seismic Properties (as per IS 1893:2002 part 1): Zone Factor = 0.24
Response Reduction Factor = 5 Soil Profile Type = II
Importance Factor = 1 Assumptions:
1) All columns supports are considered as fixed at the foundation.
2) Plastic hinges are assigned to all the member ends. In case of columns PMM hinges (i.e. Axial Force and Biaxial Moment Hinge) are provided at both the ends, while in case of beams M3 hinges (i.e. Bending Moment Hinge) are provided at both ends.
3) The maximum target displacement of the structure is kept at 4.0% of the height of the building (4.0/100) × 14 = 0.56 m = 560 mm.
4. Performance Analysis
The seismic performance of a building is evaluated in terms of pushover curve, performance point and plastic hinge formation [6][7].
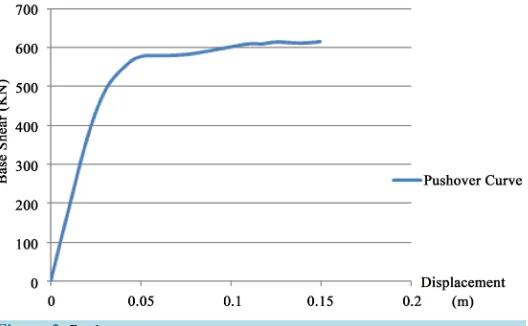
4.1. Pushover Analysis
An incremental static analysis used to determine the force displacement relationship or the capacity curve for a structure in Figure 3. The analysis involves applying horizontal loads, in a prescribed pattern to a computer model of the structure incrementally and plotting the total applied shear force and associated lateral displace-ment at each incredisplace-ment until the structure reaches a limit state or collapse condition.
From Table 1 it is seen that performance point lies in between step 6 and step 7. It is also seen that all hinges are within assumed performance level life safety.
4.2. Capacity Demand Spectrum
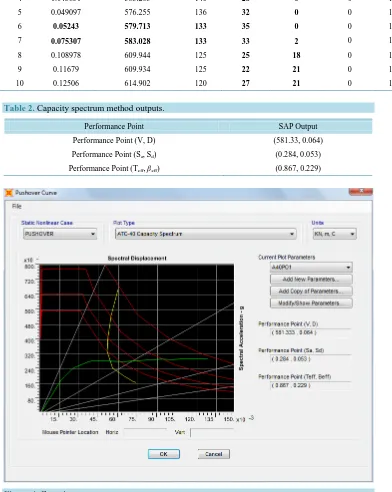
Capacity demand spectrum is the representation of structures ability to resist the seismic demand. The point of intersection of capacity spectrum and demand spectrum is required performance point. Figure 4 shows the ca-pacity spectrum curve as per ATC-40. Table 2 shows the performance point in terms of different structural pa-rameter like base shear (V), displacement (D), spectral acceleration (Sa), spectral displacement (Sd), effective time period (Teff), effective damping (βeff).
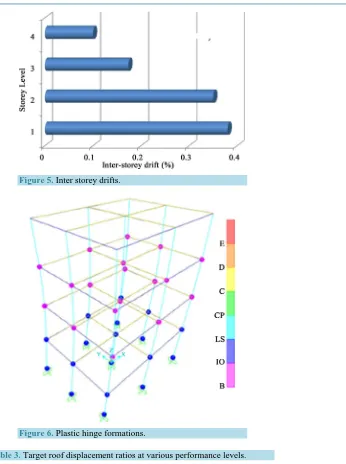
4.3. Inter Storey Drift
[image:4.595.184.448.550.713.2]The inter storey drifts corresponding to the displacement profiles are shown in Figure 5. The limiting value of inter storey drift is 0.4% as per IS 1893:2002. For building under consideration inter storey drift is within per-missible limit satisfying the displacement requirements. Hence, the building performance is satisfactory.
Table 1. Pushover analysis details.
Case Step Displ. (m) Base Force (kN) A to B B to IO IO to LS LS to CP Total
PUSH 1 0.0001732 0 168 0 0 0 168
PUSH 2 0.02009 364.022 167 1 0 0 168
PUSH 3 0.031053 496.87 153 15 0 0 168
PUSH 4 0.043831 563.203 140 28 0 0 168
PUSH 5 0.049097 576.255 136 32 0 0 168
PUSH 6 0.05243 579.713 133 35 0 0 168
PUSH 7 0.075307 583.028 133 33 2 0 168
PUSH 8 0.108978 609.944 125 25 18 0 168
PUSH 9 0.11679 609.934 125 22 21 0 168
[image:5.595.125.517.167.659.2]PUSH 10 0.12506 614.902 120 27 21 0 168
Table 2. Capacity spectrum method outputs.
Performance Point SAP Output
Performance Point (V, D) (581.33, 0.064)
Performance Point (Sa, Sd) (0.284, 0.053)
Performance Point (Teff, βeff) (0.867, 0.229)
Figure 4. Capacity spectrum curve.
4.4. Plastic Hinge Results
Figure 5.Inter storey drifts.
Figure 6. Plastic hinge formations.
Table 3. Target roof displacement ratios at various performance levels.
Performance Level Operational IO LS CP
Lateral Drift Ratio (δ/h)% 0.37 0.7 2.5 5
δ = Lateral Roof Displacement; h = Total Height of Building.
going in collapse prevention range designed building is safe for design basis earthquake and life safety perfor-mance level is achieved. Plastic hinge results give the information about the weakest member and so the one which is to be strengthened to achieve required performance level. Accordingly the detailing of the member can be done in order to achieve the desired pattern of failure of members in case of severe earthquakes.
4.5. Performance Based Design
roof displacements are provided in terms of lateral drift ratio. For Immediate Occupancy,
Target roof displacement = 0.007 × 14 = 0.098 m = 98 mm. Similarly for Life Safety,
Target roof displacement = 0.025 × 14 = 0.350 = 350 mm. By analysis, roof displacement achieved = 149.298 mm.
Thus, by this design building lies in between immediate occupancy and life safety range. So, the required performance objective of design is achieved.
5. Conclusions
1) The need for performance based seismic engineering in contrast to force-based design approaches as stu-died and the four building performance levels namely operation, immediate occupancy, life safety and collapse prevention were studied. In performance based design, multi-level seismic hazards are considered with an em-phasis on the transparency of performance objectives, thus ensuring better performance and minimum life-cycle cost.
2) It has been recognized that the story drift performance of a multi-story building is an important measure of structural and non-structural damage of the building under various levels of earthquake motion. Storey drift re-quirement specified by FEMA 273 is satisfied for building under consideration. Thus the global performance of the building was considered as satisfactory for design objective.
3) Performance based seismic design provides reliable methodology for seismic up-gradation or for retrofit-ting of the exisretrofit-ting building to achieve required performance objectives.
4) Pushover analysis is a reliable method in determination of the sequence of yielding of the components of a building, possible mode of failure, and final state of the building after a predetermined level of lateral load sus-tained by the structure.
References
[1] Applied Technology Council (1996) Seismic Evaluation and Retrofitting of concrete Buildings, ATC-40. Volume 1 and 2, Seismic Safety Commission, Redwood City, 1-346.
[2] Federal Emergency Management Agency (1997) NEHRP Guidelines for the Seismic Rehabilitation of Buildings. Re-port FEMA-273, Federal Emergency Management Agency, Washington DC.
[3] ASCE (2000) Prestandard and Commentary for the Seismic Rehabilitation of Buildings. FEMA 356 Report, American Society of Civil Engineers for the Federal Emergency Management Agency, Washington DC.
[4] Priestley, M.J.N. (2003) Performance Based Seismic Design of Concrete Buildings. Bull. NZSEE. (In Press)
[5] Kunnath, S.K. (2006) Study on Seismic Design and Evaluation of Building Structures Using PBSD. CRC Press, Taylor & Francis Group, Boca Raton.
[6] Naeim, F. and Bhatia, H. (2008) The Seismic Design Handbook. 2nd Edition, Springer Publication, Berlin, 757-792.