A Bayesian Classification Approach for Mycobacterium
Tuberculosis in Uttarakhand
Nidhi Puri
Asst.Prof, Dept. of Computer Science & Engineering HNB Garhwal University
Srinagar (Garhwal)
Anubha Chauhan
Asst.Prof, Dept. of Computer Science & Engineering HNB Garhwal University
Srinagar(Garhwal)
Naresh Dobhal
Asst.Prof, Dept. of Computer Science & Engineering HNB Garhwal University
Srinagar (Garhwal)
ABSTRACT
Medical data mining tools have dramatically impacted the health care industry by improving the diagnosis of medical. Tuberculosis is disease caused by bacteria, called Mycobacterium tuberculosis, TB usually attacks the lungs, but also bacteria can attack any part of the body such as kidney or brain. This Paper describes a method Bayesian classification for automated mycobacterium tuberculosis detection in tissues. Bayesian Classification approach is used to classify in 2 classes:-Pulmonary and Extra Pulmonary, Bayesian classification approach able to produce better performance with some input feature compared to the association method [7].
Keywords
Mycobacterium, Tuberculosis, Bayesian classification.
1.
INTRODUCTION
Tuberculosis is one type of virus affected disease, caused by bacteria called Mycobacterium. Mycobacterium tuberculosis bacteria through microscopic analysis. There are 2 types of tuberculosis-
1) Pulmonary-When tuberculosis bacteria can settle in the lungs and begin to grow. TB in the lungs or throat can be infectious. They can move through the blood to other parts of the body.[8]
2) Extra Pulmonary-When TB bacteria can settle the other parts of the body such as bone, brain.
Tuberculosis bacteria are put into the air, when a person with active disease of the lungs or throat coughs and sneezs. People nearby May breathe in TB bacteria. Now in this paper we have applied bayes theorem and Bayesian classification theorem for tuberculosis detection.
2.
BAYES THEOREM
Bayes theorem is named after Thomas Bayes. Let X be data tuples belongs to specified class c. For classification problems, P (H|X), is the prior probability, of H conditioned on X. In contrast, P (X|H) is the posterior probability of X conditioned on H. P(H),P(X|H),and P(X) may be estimated from the given data. Bayes Theorem is useful in that it provides a way of calculating the posterior probability, P(H|X),from P(H),P(X|H),and P(X).Bayes Theorem is-[1]
(
|
) (
)
(
|
)
(
|
) (
)
(
|
) (
)
P X H P H
P H X
P X H P H
P X H P H
Where P(H|X) is called the posterior probability, while P(H) is the Prior probability associated with hypothesis h1.P(X) is the probability of the occurrence or data value Xi and P(X|H) is the conditional probability, that given a hypothesis.
3.
BAYESIAN CLASSIFICATION
1. We need to maximize P (X|
C
i) P (C
i), for i=1, 2…n P (i
C
), the prior probability of each class, can be computed based on the training tuples: To Compute P (X|C
i) for children.2. Suppose that there are m classes
c
1,c
2 .….c
m Given a tuple, X, the classifier will predict that belongs to the class having the highest posterior probability, conditioned on x, That is, Bayesian classifier predicts that tuple X belongs to the class ci, if and only if-[10]P(
C
i|X) > P(C
J|X) for 1< j < m,j
i
By bayes theorem-(
|
) (
)
(
|
)
( )
i i
i
P X C P C
P C X
P X
3. P(X) is constant for all classes, only P(X|
C
i)P(C
i) need be maximized. if the class prior probabilities are not known, that it is commonly assumed that the classes are equallylikely, that is, P(
c
1)=P(c
2)=……..P(Cm),and we would therefore maximize P(X|C
i)P(C
i).[3]4 .Given data sets with many attributes, it would be extremely
computationally expensive to compute P (X|
C
i).In order toreduce computation in evaluating P(X|
C
i), then conditionalindependence is made.[11]
5. Given data sets with many attributes, it would be
extremely computationally expensive to compute P (X|
C
i).Inorder to reduce computation in evaluating P(X|
C
i), then conditional independence is made.[11]P(patient) = X ray = Positive= 75/465=0.1612
j
i
P(patient) = X ray=Negative = 50/465=0.1075We need to maximize P (X|
C
i) P (C
i), for i=1, 2…n P (C
i42 To Compute P (X|
C
i) for children-If (P (age=child | category I = Negative)) = 15/1=15
Else If (P (age=child | category II =Negative)) = 15/2=7.5
Else (P (age=child | category III = Positive)) =15/3 =15
To Compute P (X|
C
i) for youth- If (P (age = youth | category I =Negative)) =50/1=50ElseIf (P(age= youth| categoryII = positive)) =50/2=25
Else (P(age=youth|categoryIII = Negative)) =50/3=16.6
To compute P (X|
C
i) for old category- If (P(age=old| category I=positive)) =75/1=75ElseIf (P(age=old| categoryII=negative)) =75/2=37.5
Else (P(age=old| categoryIII = 75/3=25)) Using the above probabilities, we obtain-
P(X|Diagonsis =Positive)=P(0.1612)(5*25*75) * P(0.107)(15*50*37.5) *P(0.107)(75*16.6*25) = (1511.25)*(3009.375)*(3330.375)
=1.51462
4.
GAIN RATIO
The information gain measure is biased toward tests with many outcomes. That is .it prefers to select attributes having a large number of values. Let node n represent or hold the tuples of partition D. The attribute minimize the information needed to classify the tuples in the resulting partitions and refers the least randomness.[4]
The expected information needed to classify a tuple in D is given by-
2 1
( )
log (
)
m
i i
i
Info D
p
p
Where Pi is the probability that an arbitrary tuple in D belongs
to class ci and is estimated by
|
C D
i,
| / |
D
|
.A log function to the base 2 is used, because the information is encoded in bits. Info (D) is just the average amount of information needed to identify the class label of a tuples in D.Now, suppose we were to partition the tuples in D on some
attribute A having v distinct values {
a
1,a
2….a
v}, as observed from the training data. If A is discrete-valued, these values correspond directly to the v outcomes of a test on A. Attribute A can be used to split D into v partitions orsubsets,{
D
1,D
2…….,D
v},whereD
j contain those tuples in D that have outcome aj of A. These partitions would correspond to the branches grown from node N. The amount is measured by- [12]1
|
|
( )
*
(
)
|
|
vi
A j
j
D
Info D
Info D
D
The term |Dj|/|D| acts as the weight of the Jth partition. Info (D) is the expected information required to classify a tuple from D based on the partitioning by A.[5]
Information gain is defined as the difference between the original information requirements (based on just the proportion of classes) and the new requirement (obtained after partitioning on A), That is,
Gain (A) = Info (D) –
Info D
A( )
Suppose partition the tuples in D on some attribute A having n
distinct values {
a
1,a
2…a
v} for children- Info (D) = -15/3log (15/3) – 2/3log (2/3)= -5log (5) – 0.66log (0.66)
= -5(0.6989) – 0.66(-0.1804)
= -3.4948 - + 0.119064
=3.3757
Ex-Table for Tuberculosis Patients, Divided into different Classes.
ID Age Category Diagnosis Class
1 1-15 3 H3
2 15-30 2 H2
3 30-45 2 H2
4 45-60 2 H2
5 60-75 3 H1
The expected information needed to classify a tuples are partitioned according to age-
Infoage (D) = 15/3*(-10/3log10/3 -5/3log5/3 +15/3*(-15/3log15/15-0/3log0/3) + 15/3 *(-5/3log5/3 - 10/3log10/3)
=3*(-(3.33)*(0.5224) – (1.666)*(0.220)
=3*(-1.739592 – 0.3652)
=3*(-2.1047)
= - 6.3141
Hence the gain information from such a partitioning would be-
Gain (age) = Info (D) – Infoage (D)
=15/3(1.66 log (1.66) – 3.33 log (3.33)
=15/3(1.66(0.220) – 3.33*(0.5224)
=15/3(0.3652 – 3.33*(0.5224)
= 3(0.3652 – 1.7395)
=3(-1.3745)
= -4.1235
Info (D) = - 6.3141 – 4.1235
5.
HEURISTIC METHOD FOR
CLASSIFICATION
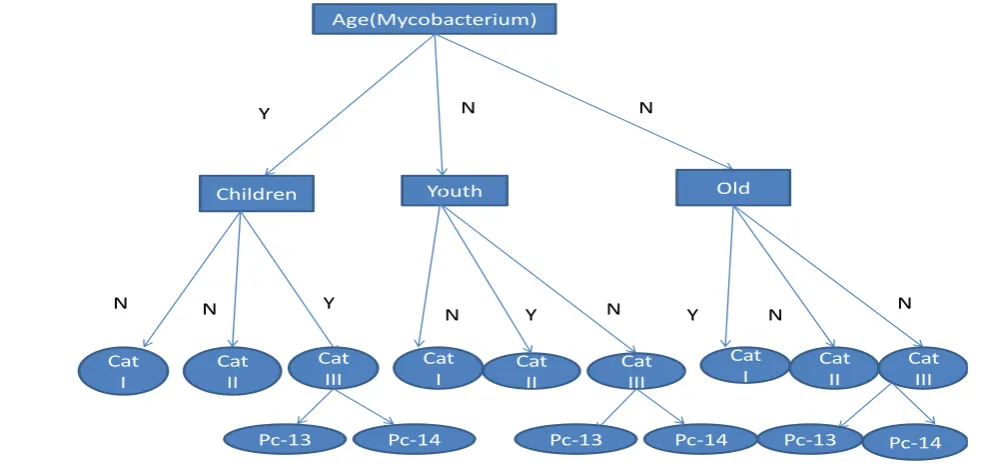
We have used greedy search algorithm for Heuristic method. For this method firstly we create Classification tree. In particular, we use an algorithm that begins by making the
assumption that a node has no parents, and then adds incrementally that parent whose addition most increases the probability of the resulting structure [9]. When the addition of no single parent can increase the probability, we stop adding parents to the node. Researchers have made extensive use of similar greedy-search methods in classification systems [6].
Age(Mycobacterium)
Children Youth Old
Cat I
Cat II
Cat III
Cat
I Cat II Cat III
Cat I
Cat II
Cat III
Y N N
N N Y
N Y N Y N N
[image:3.595.55.546.157.392.2]Pc-13 Pc-14 Pc-13 Pc-14 Pc-13 Pc-14
Fig 1: Classification Tree for Tuberculosis Patient
We shell use following fuction for Heuristic Method –
1 1
(
1)!
( ,
)
!
(
1)!
i i
q r
i
i ijk
j ij i k
r
g i
N
N
r
=(2-1)!5!5!/(10+2-1) * (2-1)!1!4!/(5+2-1)!
*(2-1)!4!1!/(5+2-1)!*(2-1)!0!5!/(5+2-1)*(2-1)!4!1!/(5+2-1)!
=(1!*5!*5!/11!) * (1!*4! 1!/6! )* (1! 4! 1!/6! )*(1! 0!5!/6!)*(1!*4!*1!/6!)
=1*120*24*24*24/3991680
=4.15 * 10-3
=(1!*5!*5!/11!) * (1!*4! 1!/6! ) * (1! 4! 1!/6! ) * (1! 0!5!/6!) * (1!*4!*1!/6!)
=1*120*24*24*24/3991680
==4.15 * 10-3
6.
RESULTS
After applying Bayes theorem on Tuberculosis data taken from “Government Combined Hospital Srinagar (Garhwal) from 2001 to 2012” and then find out the results as follows-
Results
Download information
Workbook information
Number of sheets 3
Selected sheet Sheet1
Sheet size
462 x 10
Dataset size 52 x 8
Data source processing
Computation time 15 ms
44
Dataset Description
Attribute Categor
y
Informati on
Year Discrete 4 values
Date
Continu
e -
Region Discrete 3 values
Age
Continu
e -
sex Discrete 2 values
X-Ray Discrete 1 values
Diagnosis Discrete 2 values
Category
Continu
e -
Values Count Percent Histogram
Tehri 76 8.2 %
Srinagar 234 74.19 %
Pauri 133 22.58 %
Values Count Percent Histogram
M 320 61.29 %
F 180 38.71 %
X-Ray0.1748
Values Count Percent Histogram
Positive 420 80.32%
Negative 80 19.68%
Diagnosis0.3122
Values Count Percent Histogram
Pulmonary 325 80.65 %
Extra Pulmonary 75 19.35 %
Category0.6139
Values Count Percent Histogram
II 210 49.13 %
II 75 12.39 %
Histogram Diagram for tuberculosis data
Data source processing
Computation time 15 MS
Allocated memory 45 KB
In this diagram red colour shows total tuberculosis patient in Uttarakhand State find out from “2001 to 2010” and blue colour shows those people are not affected by tuberculosis.
7.
CONCLUSION
Now In this Paper we have taken Tuberculosis data, and then apply Bayesian Classification technique by the help of heuristic algorithm and greedy search method. The system extracts hidden knowledge from a historical tuberculosis disease database from 2001 to 2010. This is the most effective method to predict patients with Tuberculosis disease. Continuous data can be used instead of just categorical data. By analysis of 10 years data we can find out that computation time 15ms and allocated memory 45KB.By applying Bayesian classification technique and heuristic algorithm, we find out that maximum tuberculosis patient find out in Srinagar(Garhwal).
8.
ACKNOWLEDGMENTS
The authors wish to thanks to Dr. A. K. Chaubey, Dr. S. Kotiyal, Dr. G. Pujari from ”Government Combined Hospital Srinagar(Garhwal)”, who has participated in this study and permission to carry out work.
9.
REFERENCES
[1] Cooper, G.F. & Herskovits, E.H. (1991). A Bayesian method for the induction of probabilistic networks from data (Report SMI-91-1). Pittsburgh PA: University of Pittsburgh, Section of Medical Informatics. (Also available as Report KSL-91-02, from the Section on Medical Informatics, Stanford University, Stanford, CA.)
[2] R. G. Cowell, A. P. Dawid, S.L. Lauritzen. Probabilistic Networks and Expert Systems.Springer Verlag. (1999)
[3] F.V. Jensen. Bayesian Networks and Decision Graphs. Springer Verlag. (2001)
[4] N. Freidman, D. Geiger, S. Goldszmidt, Bayesian Networks classifiers. Machine Learning,29 (pp 131-161), (1997)
[5] M. Martinez-Morales, an Algorithm for the Induction of Probabilistic Networks from Data. XII Reunion Nacional de Inteligencia Artificial, ITESM, Cuernavaca, Morelos, Mexico, Limusa. (1995).
[6] J. Han, and M. Kamber, Data Mining. Concepts and Techniques, Morgan Kaufmann,(2001).
[7] G. F. Cooper, An Overview of the Representation and Discovery of Causal Relationships using Bayesian Networks. Computation, Causation & Discovery. C. Glymour and G. F. Cooper, AAAI Press / MIT Press: 3-62. (1999).
[8] S. Sharma, and A. Mohan, „Extra pulmonary tuberculosis‟, Indian Journal of Medical Research, 120, pp. 316-353. 2004
[9] Lucas, P. J. F., van der Gaag, L. C., Abu-Hanna, A.: Bayesian networks in biomedicine and health-care. Artificial Intelligence in Medicine 30 (2004) 201–214
[10]Jiawei Han and Micheline kamber,Data Mining Concepts and Techniques.
[11]J. Kamerbeek and L. Schouls and M. Van Agterveld and D. Van Soolingen and A. Kolk and S. Kuijper and A. Bunschoten and R. Shaw and M. Goyal and J. Van Embden, Simultaneous detection and strain differentiationof mycobacterium tuberculosis for diagnosis and epidemiology, J. Clin. Microbiol.,1997.