Modelling building heating requirements.
BARNFIELD, Michael Philip.
Available from Sheffield Hallam University Research Archive (SHURA) at:
http://shura.shu.ac.uk/19319/
This document is the author deposited version. You are advised to consult the
publisher's version if you wish to cite from it.
Published version
BARNFIELD, Michael Philip. (1985). Modelling building heating requirements.
Masters, Sheffield Hallam University (United Kingdom)..
Copyright and re-use policy
See
http://shura.shu.ac.uk/information.html
JT I l L ; V i l k I-- ____________
POND STREET 1 , „
Rwmielo m iwb j
TELEPEN
795009801 5
111
IIIIII
11
i ll III II III I III III
Sheffield City Polytechnic Library
ProQuest Number: 10694200
All rights reserved
INFORMATION TO ALL USERS
The quality of this reproduction is dependent upon the quality of the copy submitted.
In the unlikely event that the author did not send a com plete manuscript and there are missing pages, these will be noted. Also, if material had to be removed,
a note will indicate the deletion.
uest
ProQuest 10694200
Published by ProQuest LLC(2017). Copyright of the Dissertation is held by the Author.
All rights reserved.
This work is protected against unauthorized copying under Title 17, United States C ode Microform Edition © ProQuest LLC.
ProQuest LLC.
789 East Eisenhower Parkway P.O. Box 1346
MODELLING BUILDING HEATING REQUIREMENTS
MICHAEL PHILIP BARNFIELD BSc.
A thesis submitted to the Council for National Academic Awards in partial fulfilment of the requirements for the
degree of Master of Philosophy •
Sponsoring Establishment Sheffield City Polytechnic Department of Mathematical Sciences
Collaborating Establishment : Programme and Energy Control Unit, Sheffield Metropolitan District Council
m mncMtic t/gf T k ~ 6 ^ 7 o o 2 ^
6f\ Q
ABSTRACT
Modelling Building Heating Requirements
Michael Philip Bamfield BSc.
This thesis describes the development of a mathematical model for the assessment of building heating requirements. The model has been incorporated into a FORTRAN computer program, ENMAN, which allows the rapid production of tabular and graphical comparisons between actual monthly fuel consumption and calculated requirements.
The program was developed for use in a local authority where there was a requirement to monitor the consumption of its building stock which ranges from residential homes to libraries and schools. The ENMAN computer program is used to spotlight any excessive fuel consumption or gradual deterioration in performance.
The principal objective has been to produce a model of building heat requirements which is more sensitive to the effects of
occupancy, thermal heat capacity and solar gain than simple thermal models without being unduly complex. This approach was adopted
because the large number and range of local authority buildings
indicated a requirement for a model which was sensitive to different types of construction and occupancy but which did not require large amounts of input data to describe each building.
The first and second chapters of this thesis form an introduction and also describe the implementation of two other computer programs, ENGY and ICON,which complement ENMAN by allowing an assessment of the thermal environment of buildings and the risk of interstitial
condensation.
The third and fourth chapters describe the development of the mathematical model of building heating requirements and its
implementation as the computer program ENMAN.
Examples of the use of ENMAN are illustrated and discussed in Chapter. 5 • The final chapter concludes by assessing the performance of the ENMAN system and looks at the possibility of future
ACKNOWLEDGEMENTS
I am grateful to my two supervisors, Dr. G.G. Rodgers and Dr. A.T. Howarth, for all their advice and encouragement during my period of study.
CONTENTS
1. INTRODUCTION ... •••-... 1 1.1 The History and Function of Energy Management • • • • 2 1.2 The Use of Computers in Energy Management... 9
2. BACKGROUND...13 2.1 Energy Management in Sheffield City Council • • • • • 14 2.2 Motivation for the Work Reported in this Thesis . . . 17
3. DEVELOPMENT OF THE MATHEMATICAL MODEL OF BUILDING . . . . 25
HEAT REQUIREMENT ...
3.1 Introduction • • • • • • • • • • ... • • • • ■ • 2 6
3.2 Degree-Days and Continuous Heating • • • • • • • • • 28 3.3 Thermal Capacity and Intermittent Heating • • • • . • 34 3*4- The Effects of Occupancy • • • • • • • • • • • • • • 4 3 3*5 The Calculation of Solar G a i n s ... . . 4 9 3.6 Summary of the Calculation Procedure • • • • • • • • 5 2 3.7 Justification for the Choice of the ENMAN • • • • • • 57
Energy Model
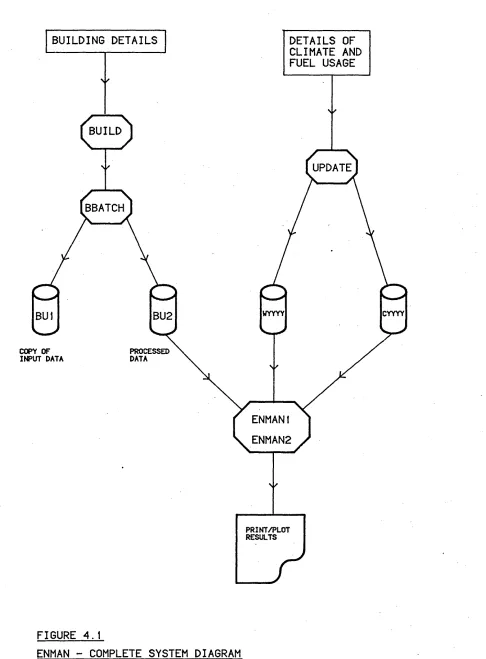
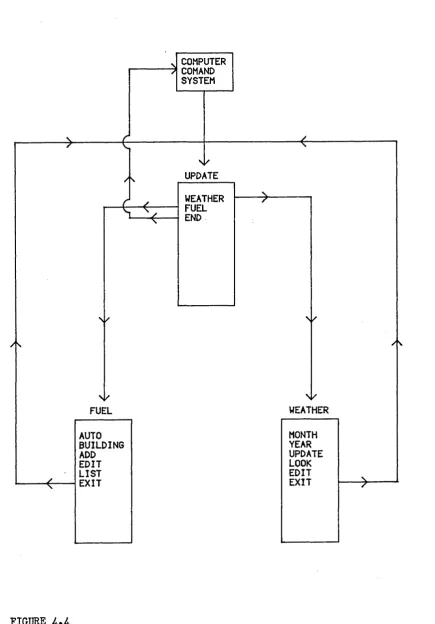
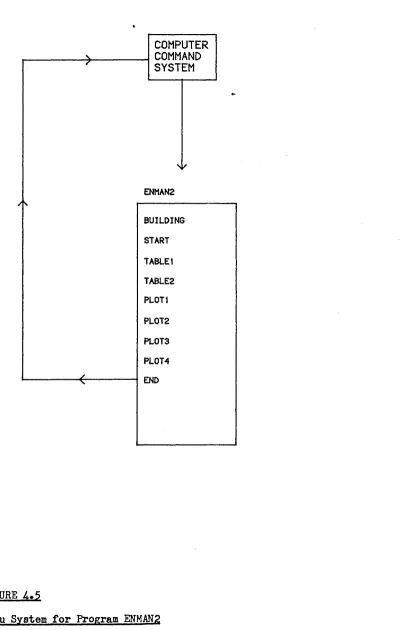
4. IMPLEMENTATION OF THE COMPUTER PROGRAM ENMAN...60 4*1 Introduction . . . ... • • • • • • • • • • • • 6 1 4.2 Menus and Command Structure • • • • • • • • • • • • • 6 4 4*3 Database Structure and Formation • • • • • • • • • • 7 4 4*4 Structure of the Energy Analysis Programs ... 82
4*5 Using the Programs - Sample Runs of ENMAN • • • • • • 85
5. DISCUSSION OF R E S U L T S ...110
5.2 Inititial Verification of the Model . . ... 114
5.3 First Case Study - Green Oak View • • • • • • • • • • 123 Old Peoples* Home 5.4 Second Case Study - Hillsborough First • • • • • • • 129 and Middle School 5.5 Summary of Results from the Hillsborough Survey • • • 142 6. CONCLUSIONS...*... 143
6.1 General Assessment of the ENMAN System • • • • • • • 144 6.2 Experience in the Use of the ENMAN System • • • • • • 145 6*3 Future Developments • • • • • • • • • • • 147
REFERENCES . . . ... . . . 149
APPENDIX I ... 155
APPENDIX I I ... 166
1.1 THE HISTORY AND FUNCTION OF ENERGY MANAGEMENT
In recent years the need to conserve energy has become a major issue in society. The traditional fuels are no longer seen as an infinite resource and, since the oil crisis of 1973, the escalating price of the primary fuels has caused the cost of energy to become
a significant proportion of the industrial, commercial and domestic budget.
In industry and commerce, where the inefficient use of energy can have a very detrimental effect on company profitability, energy management is taken very seriously. To quote the Department of Energy ( 1 ), 'In general, every £10,000 saved in industrial energy costs will yield an extra £10,000 in pre-tax profits. And for the average British firm to achieve a similar increase in profits from output alone would require a rise in sales of at least £120,000. ' • It is for this reason that 'Energy Managers' are often to be found at Director level in larger companies.
In Local Government, proper control of energy consumption in council buildings, schools, libraries, sports centres and residential care homes can provide an excellent means of saving money without having to make any cuts in services to the public.
In Great Britain, Central Government has produced many initiatives aimed at the reduction of the nation's energy consumption. Shortly after the 1973 energy crisis the 'Save It' campaign was launched by the Department of Energy, this promoted the efficient use of energy in both the domestic and business sectors. Grants became available for such measures as loft insulation in domestic dwellings. More recently the 'Energy Efficiency Office’ has been set up with regional offices cbordinating1grants throughout'the country. Publications such as the
Management ( 4- ): have given plentiful advice and data on the subject of energy management and have promoted nationwide debate of energy management issues. The current ’HEAT’ and ’Ehergy Efficiency Survey’ schemes have made government grants available towards the cost of energy audits which help to identify sources of possible energy savings. Both government and EEC grants are available for research into such topics as solar energy and combined heat and power (CHP).
Tight control over the energy consumption of new buildings has been made possible by the introduction of stringent Building
Regulations ( 5 ) governing the insulation of external fabric. The insulation values stipulated for walls and roofs are now about one
third bf the values prevalent in the early ’seventies. Architects and
Engineers are now very aware of the need to incorporate good
energy-saving features in their designs. Awards are given to energy energy-saving buildings, for example the Electricity Council’s ’Gold Medallion’ awards for domestic house designs.
All these measures have had an encouraging effect on the nation's energy consumption and fuel usage has fallen from 360 million tonnes of coal equivalent in 1972 to 313 million tonnes in 1983 ( 3 )•
However there is still enormous potential for more savings to be made and the role of energy management is increasing in importance.
’Energy Management’ is the broad title covering all aspects of the efficient use of energy in industrial manufacturing processes, the environmental control of buildings and transport. The process of
energy management can be broken down into two fundamental stages: (i) The IDENTIFICATION of areas of inefficient energy use by
means of energy audits and performance analyses.
(ii) The IMPLEMENTATION of measures to reduce consumption in these areas e.g. better heating controls and improved insulation.
It is often the first task which is the most difficult to undertake. Energy Audits and Performance Analysis
The cost of energy to an organisation must first be analysed and
broken down into its constituent parts space heating, lighting,
hot water and other processes. This can often be the first stumbling block because two or more parts may share one measurement device or meter. The breakdown of different energy usages can be illustrated by a ’Sankey1 diagram, an example is given in figure 1.1 • An assessment can then be made as to whether the levels of each energy use are acceptable.
Suppose, for example, that a particular organisation is faced with with its latest annual bill of £10,000 for the space heating of its office building. Is this acceptable or not ? Can it be reduced ? Firstly it may be decided to look at the fuel bills for previous years. If these were significantly less then the cause would need to be investigated. An increase in fuel cost could be due to a combination of many factors
(i) inflation of fuel prices (ii) a colder climate than average
(iii) different patterns of operation of the building e.g. longer hours of use
(iv) lost efficiency of the heating plant and distribution system ; perhaps maintenance is overdue.
(v) heating controls not operating efficiently or thermostats incorrectly set
All these possibilities need to be investigated. Fuel inflation
could easily be taken into account by measuring consumption in units of energy rather than units of money. It is the fourth and fifth factors which are generally under the control of the energy manager
consumption must be normalised with respect to the remaining two factors: climate and occupancy.
’Degree Days’ are often used as a step towards this normalisation with respect to outside temperatures. The theory of degree days is
described in Section 3*2 of this thesis. An allowance for weather
variation is made by comparing the monthly or yearly energy consumptions per degree day or by plotting a graph of energy consumption versus
degree days as shown in figure 1.2 • This comparison can be done on a monthly or yearly basis; ’rogue’ consumptions or an upward trend in consumption can be identified and steps taken to correct the operation of the building. Usually a fixed ’base temperature’ of 15*5°c is used because degree day figures for this base are regularly made available
( 4 ) for all areas of the country. This base temperature does not
strictly apply for all situations however and the variation of occupancy cannot be accomodated with a fixed base degree day method.
The analysis described above draws on the past performance of the building to identify changes in a building’s energy usage. Unfortunately it is very possible that energy has been used inefficiently throughout the period of historic comparison: the heating system may have been running inefficiently for many years; there may never have been proper thermostatic control of room temperatures; the fabric of the building may be poorly insulated.
A far deeper analysis can be performed by making a mathematical determination of energy requirement taking into account such factors as climate, occupancy, the fabric heat loss of the building, ventilation solar gains and intermittent heating. By using expected or target values for the efficiency of the heating system and internal air temperatures the mathematical calculation produces a target energy consumption for
comparison with actual consumption* In this way a much greater insight is given into the true performance of the building and its heating system*
This greater degree of analysis can be very time consuming if carried out manually but with the aid of computers very complex mathematical analyses may be performed • The next section describes how computers are gradually playing an increasing role in energy management*
BOILER PLANT DISTRIBUTION SPACE HEATING HOT WATER LOSSES LOSSES
O
aa
sv
Ho
an
d
a
9«
3N
3
iv
io
i
in
UJ
o
Q
l
a.
<
CD
OO
O
ID
Z
X
CD
CD
i—
i
L
l
_
7
Co
ns
um
pt
io
n
CL
it
re
s)
6000
5000
-4000
3000
2000
1000
-o
400
200
300100
Degree Days
FIGURE 1,2
A Plot of Actual Consumption Versus Degree-Days for a Typical
Building
1.2 THE USE OF COMPUTERS IN ENERGY MANAGEMENT
Although the principles of heat flow in buildings have been understood for some years, the mathematical analysis of energy
consumption has been limited by the amount of time needed to perform
manual calculations. With the aid of computers, complex and repetitive calculations can now be performed extremely rapidly and this has
i
stimulated the development of sophisticated mathematical techniques for determining energy requirement.
For example, the rapid calculation of solar heat gains is now
possible using computer programs such as SUN3 , AVDY and OVDY ( 6 )
developed at Sheffield University. A program called ENGY ( 7 ), also developed at Sheffield, incorporates the calculation of solar gains in a variable base degree-day method for predicting the energy consumption of buildings.
The RIBA ( 8 ) have developed a suite of programs for the TI59 programmable pocket calculator, these use degree-days to estimate fuel consumption and also make use of the Admittance Method ( 9 ) for
calculating peak summertime temperatures in buildings. The CIBS publish a series of algorithms (10 ) which allow the purchaser to construct his own computer programs using recommended theory.
The Degree-Day and other simple calculation methods assume that ’steady state1 conditions prevail within a building ; it is assumed that internal temperatures are constant and that heat flow out of the structure of the building is unidirectional. The solution of the
differential equations of non-steady state and two and three-dimensional heat flow has become possible using ’finite difference’ and ’finite element’ techniques. These techniques can only realistically be undertaken on a computer.
ESP (Environmental Systems Performance) ( 11 ) is a computer
program developed by the ABACUS unit at the University of Strathclyde, The program uses finite differences to analyse the energy demand of buildings along with heating and cooling plant performance, TAS° ( 12 ) developed at Cranfield Institute of Technology uses the 1 response factor’
method to predict plant load and heating requirement as well as
determining humidity levels and condensation risk. Another example of a non-steady state or ’dynamic’ analysis is the THERM program developed
by British Gas ( 23 )•
All of these latter three programs allow the user to feed in details of his buildings and local climate and produce a prediction of each building’s performance to compare with its actual performance. Alternatively the programs may be used to investigate new designs or retrofit upgrades to existing buildings. Because calculations are • carried out on an hourly basis all the programs are capable of
determinining daily internal temperature and plant load profiles, a task which cannot be reliably performed by a steady state analysis. In this way decisions about the implementation of energy saving measures
can be made with a greater degree of confidence, Jones ( 14- ) explains how the program TAS° was used to analyse different energy saving
proposals and shows how the dynamic model in TAS° could produce quite different conclusions to the Degree-Day method- in some cases.
Most of the programs available for energy analysis are termed ’interactive’. This means that the order of execution of the various sub-programs which make up the computer program is not fixed but can be dictated by the user during the programs execution. For example, a user may describe a building to the program and produce an energy analysis, he can then go back and change a particular aspect of the
building and produce another analysis without having to restart from
scratch.
Hardware
In general terms three basic items of equipment or 1 hardware1 are needed to run an interactive computer program
(i) A terminal comprising a keyboard for entering commands and information, and a monitor for displaying the information typed in and for displaying the results of calculations. If the
terminal has a graphics capability then it is possible to show the results graphically and to use sophisticated menu systems allowing easy movement between different parts of the program, (ii) A processor is linked to the terminal and carries out the
instructions and calculations contained in the computer program. In its basic form the processor is just a set of many thousands of electrical switches.
(iii) A storage device such as a magnetic disk or tape which is accessed by the magnetic head on a disk or tape drive. The
programs themselves and data such as climatic information are stored on these devices. It is also probable that, once a building has been described to the computer,its details will need to be retained for later reference or further analysis. To give an idea of the rapid progress of computer technology, a computer system used to run a typical dynamic thermal analysis program would have consisted, in the ’sixties or early ’seventies, of a
terminal or teletype device linked to a mainframe computer. The cost of such equipment could easily exceed £1 million. In the late
’seventies powerful minicomputers arrived from manufacturers such as DEC and PRIME costing from about £50,000. Currently desktop computers are available which incorporate terminal, processor and disk drive in one unit with sufficient computing power to run complex dynamic
programs for less than £20,000. For example, the TAS° program is now
available on the APP0LL0 range of desktop, networkable computers whose
prices start at £13,000. Less complex programs such as those
incorporating degree-day models can be run on small microcomputers costing from £100* ENGY is currently being written to run on a BBC microcomputer and disk drive costing about £800.
In this way a computer can be a very cost-effective tool for
energy analysis and performance monitoring, and of course,if a computer is purchased it does not have to be used for the sole purpose of energy anlysis, it could also handle the company payroll.
2.1 ENERGY MANAGEMENT IN SHEFFIELD CITY COUNCIL
Sheffield, with a population of some 540>000, is now the fourth largest city in England. Sheffield Metropolitan District Council is directly responsible for the energy management of some 270 schools, 5 Colleges of Further Education, the Polytechnic, 100 residential
care homes, 21 sports centres and swimming pools as well as libraries, park buildings, Works Department depots and of course the Town Hall buildings themselves.•The total fuel bill for these buildings in 1983/4
was just over £13 million or approximately 1% of the Council’s total
budget. There are also over 92,000 council homes for which the Authority is responsible in terms of maintenance and modernisation. Such work often involves the provision of new heating systems and additional insulation to combat problems of large fuel bills, condensation and mould growth.
There are, at present, eight full time staff employed in the Council’s ’Energy Control' section who are responsible for monitoring the energy usage of Local Authority controlled buildings. Their main responsibilities include :
(i) Keeping records of meter readings and fuel bills for each building.
(ii) Coordinating the maintenance of heating plant and control
systems.
(iii) The installation of improved heating controls such as zone controls and optimum start controllers.
(iv) The briefing of Architects and Engineers in the Department
of Design & Building Services when design work is
required for major heating and insulation schemes.
Examples of successful energy conservation projects initiated by
the Energy Control Section include the following :
(i) Westfield and Jordanthorpe Schools : these two schools were built in the 1960’s and their external fabric consists of very large areas of glass together with lightweight, poorly
insulated panels* Consequently heat losses were considered substantial in winter, but in summer the overheating through excessive solar gain would often become unbearable* On many occasions, rooms facing the sun were overheating while the heating system had to be used to keep rooms on the opposite facade warm. Without zonal control of the heating system it was not possible to heat one side of the building without heating the opposite side,therefore energy was being wasted.
Nearly 50% of the glazing area and all the existing panels, which were in a poor state of repair anyway, have been replaced by well insulated panels. The environment inside each building has been considerably stabilised; staff have expressed satisfaction with their improved environment; fuel
bills have dropped and the buildings have had a welcome facelift.
(ii). Acoustically operated lighting has been installed in a number of buildings where lighting use has been excessive. Lights are automatically switched off if no sound is detected for more than fifteen minutes. This has produced considerable savings because lights were often left on during periods of absence.
(iii) A scheme is currently in progress to convert boilers in the Stannington College / MyerT s Grove School complex from oil to gas in conjunction with insulation measures such as panel replacement and roof insulation. Savings are expected to be in the region of £50,000 p.a.
(iv) An experimental project is underway monitoring the effects of energy conservation measures on the fuel bills and environmental conditions of inteivwar housing. Four houses have been insulated to a very high standard and four of the latest gas and electric heating systems have been installed. These houses are being monitored alongside two other control houses which have had only standard modernisation work carried out. Initial results have been encouraging, showing that fuel bills have been reduced while internal temperatures have been improved . Condensation and mould growth problems appear to have been eliminated.
(v) Heat recovery ventilation systems have been installed in a number of swimming pools. Both latent and sensible heat has been recovered from the exhaust air : this heat would
previously have been completely lost. Because of the very high ventilation rates needed to eliminate condensation in swimming pools the savings have been substantial.
The two computer programs ENGY and ENMAN , which are described in this thesis, played a major part in the determination of optimum insulation measures and the assessment of energy savings for the Stannington College Campus and the Low Energy Housing project ( (iii) and (iv) above ). The Westfield / Jordanthorpe project was carried out before ENGY or ENMAN were available , only manual calculations could be used to assess the benefits of insulation.
2.2 MOTIVATION FOR THE WORK REPORTED IN THIS THESIS
Background
The Local Authority’s initial interest in the use of computers for energy calculations followed a seminar on Energy Conservation arranged by Mr. Bernard Johnson of the Council’s Energy Control Section. There had been increasing concern amongst Council members and officers about the problems of condensation and mould growth in council homes. They realised that it was often not sufficient to simply advise tenants to open windows more often and turn up their heating systems because of the effect this had on heating bills. As part of the seminar Dr. Glinn Rodgers of the Department of Building Science at Sheffield University showed how the computer program ENGY could be used to make a far deeper technical analysis of heating and condensation problems by balancing the effects of ventilation,
heating and insulation.
Following the seminar, an initial study of heating problems at Broomhall Flats, one of Sheffield’s system-built housing developments, was undertaken using ENGY on the University’s PRIME 750 minicomputer. Various options for insulating the flats were explored and the results were presented to the Council’s Housing Committee. At this stage it was realised that ENGY could be of great use to the Authority but, for practical reasons the program would need to be mounted on the
Authority’s ICL 2900 mainframe computer. Because of the differences between the operating systems of the ICL and PRIME machines and also the differences between ICL FORTRAN and the PRIME version of the FORTRAN programming language used for ENGY , it was obvious that the conversion could take several months and would require an experienced FORTRAN programmer. At the same time it was realised that the
calculation of energy consumption made by ENGY could be modified to
permit the comparison of actual fuel consumption of local authority controlled buildings with a computer based calculation. This would be of great use to the Authority1s Energy Control Section in
establishing a priority list of buildings such as schools and old peoples’ homes which may require energy conservation work such as
<»
boiler maintenance, improved heating controls and insulation.
It was thus decided to set up a Research Project funded by the Local Authority and under Dr. Rodger’s supervision. There were two basic aims
(i) To perform the conversion of ENGY to run on the Council’s mainframe computer.
(ii) To develop a modified mathematical model and implement a new computer program , ENMAN , for analysing the energy consumption on a month by month basis using monthly reports of local climatic data rather than the 30 year averages used by ENGY.
During the first stage of work another computer program, ICON , was written as an aid to the investigation of interstitial
condensation problems: this was largely carried out as a
familiarisation exercise with the use of computer graphics but the program has seen extensive use by council architects. The three programs ENGY, ICON and ENMAN are briefly introduced below:-ENGY
The first three months of the research project were spent in the conversion of ENGY. Although the program was written in the FORTRAN language the ICL 2900 uses a slightly different form of
the language to the PRIME version. Without going into great detail, most of the problems were concerned with the differences in the way character variables are handled. The VME/B operating system of the ICL machine is also very different to the PRIMOS system of the PRIME 750 and many sections of the program had to be re-written to accomodate these differences. In particular the handling of data
<*
files is very different.
Once the ICL version of ENGY was working at the Town Hall its calculations were checked by comparison with the University’s PRIME version, only then was the program considered to be fully
implemented.
The first exercise for which the new version of ENGY was used was an investigation into mould growth problems at Hawley Street Flats, a solid-walled inner city tenement building constructed at the turn of the century. The tenants were experiencing damp
conditions and very high heating bills which they could not afford. ENGY was used to investigate the effects of such measures as dry-lining with thermal insulation and double-glazing. Examples of the output from ENGY are shown in Appendix I which contains the actual report based on the ENGY study ; the recommendations of this report have now been implemented as part of a complete refurbishment of the flats.
ICON
The COND module of ENGY can be used to predict the liklihood of surface condensation on external walls and windows. Another problem however is that of ’interstitial condensation’ which can occur between the inside and outside surfaces of a structure. There have been many problems of interstitial condensation, particularly in flat roofs, which result from water vapour permeating to cold areas
within the structure of buildings. The FORTRAN program ICON was written to investigate these problems. The theory behind the program is derived from BS 5250 ( 15 ) and also involves the use of a
polynomial curve fitted to to the CIBS Psychrometric Chart which allows a dewpoint temperature to be determined given the moisture content of the air. The program uses a similar menu system to that of ENGY. Examples of output from the program are given in Figures 2.1 and 2.2 •
ENMAN
The development of ENMAN forms the major part of the project reported in this thesis.
As described in Section 2.1 , Sheffield City Council is directly
responsible for the energy management of some 400 buildings and, with
the Energy Control Section numbering just some seven staff, the
monitoring of fuel consumption has been very limited. The aim of the ENMAN project has been to development of a mathematical model which enables the calculation of ’guidelines’ based on each building’s
construction, its usage and the local climate. The model is
implemented as a computer program capable of handling calculations for all the Local Authority controlled buildings whose performance can be monitored by comparison of actual consumption with the calculated guidelines.
It was recognised that other local authorities had carried out broadly similar work. For instance : Essex County Council ( 16 ) have used the TAS° program to carry out extensive analysis of the consumption of school buildings and also for the assessment of new designs ; Bradford City Council in conjunction with Bradford
University ( 17 ) have developed a simpler system capable of handling
many hundreds of buildings* Although TAS° is an excellent tool for performing detailed analyses of individual buildings, the amount of detailed information required for each building effectively
precludes its use for a large number of buildings. For a
straightforward comparison of seasonal heat requirements, as opposed to daily plant load profiles , a simpler approach is more practical. The system used at Bradford aims to achieve a comparison between consumptions per degree day on a historical basis and to compare consumptions per unit floor area and per occupant between
different buildings. However, the system appears not to take account of the variation of building construction and occupancy. It is , therefore, essentially a computer implementation of year by year and month by month degree day comparisons described in Section 1.1 . The drawbacks of this type of analysis are described in Sections 1.1 and 3.2 .
The ENMAN system aims to fall between the work of these two Local Authorities. Important factors such as the fabric construction and occupancy of a building are taken into account but the amount of input information is kept at a level which reflects the number of buildings to be analysed. Although the absolute accuracy of ENMAN program is limited by the assumptions made by the the mathematical model it will be shown that improved accuracy which could, possibly, be achieved using a more complex model is insignificant compared to the inherent unreliability in the specification of important input parameters such as U-values and occupancy patterns.
The remainder of this thesis is concerned with the development, implementaion and use of the ENMAN system. The development of the mathematical model is described in Chapter 3 ; the implementation of this model into a FORTRAN computer program is described in
Chapter U* Examples of the output from the program axe illustrated
and discussed in Chapter 5» Chapter 6 concludes by reflecting on the
usefulness of the program and the possibility of future modifications.
DR Y L I N E D S O L I D W A L L I
43
ceCM OB ▼ •N a CM ■M (B a CM aa a HO U1 * £ in — -w*Q 0_ u z oU l U i
CM c \ t o Q If UJ 3 -I
<
>
I 3t~ a UI
Or-o.in > K
uiatio a m m om — H H
a s• • >-
t-a m
n o t-z flc>3 - a a a-1 - •
M O f a i a m
X X O L D — — aK>r»r> r» a. in CO t N N crcr I C O (VJCUNIONBB. . . . <»>ot
«- —* — | |
UI — Ui
z z a _>o
teie < z to <0(0
UlUi £ <trt- a i tntM- i - •
z x UI — uiin a i — a
*-«w a»-o3 Z * a aosotttt x» I-UIN
io»-i3 oaam-Ttnto8 8 S 8 8 S S »-ac
3 3 - Z Eo o - a a aaaaei _i« 3 . 8 S
UiUI c u > — i a a
Q Q i • i • •
a a X a a a
* CL CL E C 1UUI fcOC < < ■<< a ultal r i—
z x
f t t - O . U ucu3UIUI a»-«h — <A
<
u
ir** — — t i o s
( B O Q O IO B IIS f M — — —
— PwK>M-m
i.i iff«.»111 u i
u u u u o
< £ « < < < < & *—U. U. U. U. U- •—
<ftao:Ka<u m ui ui r - r - r - » - »- f - » -
2 2Z Z Z Z X
.cm
UlA —«UJxz r - i
ce
Sfjg< <
cz
m a s
o» J S i O I KlfM CM UI z < *x O H-
CE uf Ui UiX fie
f U 3 M
in
-<0L J —
- l< O Q C
Ol><lS - N » T
C A V I T Y W A L L a ID M
&. U
rS I 3 f* a N C4 a
s
3 toc u
UI UI »- a
CM C \ 3 M' N) II UJ z>
<
>
I ID MM as fiD aa oca i t air uiui h i— zx. —»UJ 8 8 a a aa r* UIUI am oa ui a~ui uUI u a 5 “ (A •-« O — KU* -1*1 u oa »-in'*u o UI p1 2
I
5 a aUIUI »- ►zx -» l i l
U o
MN'ttUSS
aavMvutt OB as CD CO (A Hi Ht 3 8 8 1 1 8 8 fiSfiOBBO
BQ'-WinKIS ouiuici^— a
<v—
UI UI U i U i U |
u u u u u
tc
— U. U. U. U .U . — <a:S££ce<« u i u i u iu i u i
z z z z z z x M M t - i i - i U i - a y
3 5 5
Or am« .
-> t n
>•
t
O t
-ain
<• >ac
UJ _ I U <z cx
atf-U J atf-U )
I * ic in Oil M||| xz a << E Z an
aa a. . i . a a i ator*- i r»
I A A O I M
a a — —
aaaa
aa a a a i r>i a aa a aaaa oiaioa — arva Kbl SOU UIX t~ alO. X S8 S H
_l_l —oc am«m -NWX ui 5 £ 5 E * a
CHAPTER 3
DEVELOPMENT OF THE MATHEMATICAL MODEL OF
BUILDING HEAT REQUIREMENT
3.1 INTRODUCTION
This chapter describes the development of the mathematical model which provides the basis of the ENMAN computer program.The model allows the monthly prediction of a building’s energy requirement for .
comparison with actual energy usage.
The aim throughout the ENMAN project has been to strike a compromise between the amount of information needed to describe a building for analysis by the model and the accuracy of the predictions which are produced.
As discussed in Chapter 2, the majority of mathematical models currently used as an aid to energy management tend to lie at one of the following two extremes :
(i) A simple degree day method using a fixed base temperature, usually 15.5°c. Predictions of space heating consumption are made by multiplying the degree day total by the total heat conductance of the building. The only information required by such a method are the areas and U-values of the external fabric and the enclosed volume of the building together with degree day totals which are published monthly by the Department of Energy ( U )
(ii) A full -dynamic thermal model where thermal capacity, intermittent heating, and zoning of the building are all taken into account. Such models require the description of the connectivity between different zones of the building and details of internal as well as external fabric. Occupancy patterns have to be described in detail for each zone. Hourly climatic
data is usually required.
The model described in this chapter aims to build on the Degree-Day method by taking some account of important factors such as
intermittent heating, thermal capacity, solar gains and occupancy patterns. However, the information necessary to describe a building is kept to a reasonable limit. With the ultimate aim of having several hundred buildings processed by ENMAN this approach was
<►
considered to be the most appropriate.
The theory of degree-days is described in Section 3*2 • Two major assumptions of a simple degree-day method are that temperatures within a building are constant with time and that the thermal capacity of the building can be ignored. Section 3«3 explains why an adapted degree-day method can still be valid for an intermittent heating regime with some account taken of thermal capacity.
Section 3*4 describes how the occupancy of a building can affect its energy requirement and shows how the major effects of different styles of occupancy can be accomodated without the necessity of providing vast quantities of information about occupancy patterns.
Section 3*5 describes how a solar gain prediction method developed by the Department of Building Science at Sheffield University ( 18 ) has been adapted for use by ENMAN.
The calculation procedure embodied in the chosen mathematical model is summarised in Section 3*6.
A comparison between different calculation methods is made in Section 3.7 • The significance of the discrepancies between the predictions made by these models is discussed.
3.2 DEGREE - DAYS AND CONTINUOUS HEATING
The use of 1degree-days* originated in the American Gas Industry;
their use was first introduced in Britain by Dufton ( 19 ) in 1934-•
Further work by McVicker ( 20 ) in 194-6 and Billington ( 21 ) in 1966
established the Degree-Day method as one of the standard procedures for determining the effect of climate on the energy consumption of
buildings. The use of the method has since been recommended by the Department of Energy ( 2 ) •
The main assumptions of the Degree-Day method are that steady-state conditions prevail within the building and that the thermal capacity of the structure can be ignored. Thus at any instant of time, the heat flow , Q (W), out of the structure will be proportional to the instantaneous difference between the inside and outside air temperatures t. and t (°c)l o '
Q = ( qf +
%
) (\
- t0 ) 3..2.1where, ( q^ + qy ) is the total heat conductance of the building (w/°c) consisting of the fabric conductance, , of the external
envelope of the building and the ventilation conductance, qv , which allows for heat lost by the ventilation of warm inside air to the outside. Both q^ and q^ are assumed to be constant.
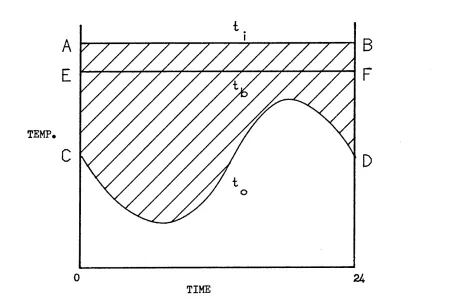
With 24- hour continuous heating we may assume, for a fully controlled heating plant, that t^ is approximately constant. Figure 3...1 shows the typical variation of t^ and t over a 24- hour period. The heat
can be assumed completely useful. They are represented by the area
ABEF in figure 3.1. The heat requirement from the plant will now be proportional to the area enclosed by EFCD. The line EF corresponds to a fictitious temperature , t^ (°c) known as the degree-day rbase' temperature1 • In reality t^ is not constant because more heat gains are likely to occur during the daytime; however this would only be important if •' the outside temperature exceeded the base temperature at some time during the day. In Britain1s climate this would normally only occur between May and September and should not affect the more important winter predictions. The problem of t exceeding t^ is, to some extent, dealt with by the use of the British Gas method of estimating degree-days which is described below; this discussion is also expanded in Section 3.3*
A
E
o 24
[image:36.612.44.512.371.679.2]TIME
FIGURE 3.1
Variation of Internal and External Air Temperature Over 24 Hours
Further analysis of equation 3*2*1 allows t^ and the seasonal heating plant-requirements to be determined
Using time intervals of one day, the seasonal heat balance may be expressed as,
24 V
H = 1000 ( qf + qv ^ k=l ^ " tok ^ ‘312,2
where, H is the total heat required (kWh) to maintain an average inside temperature of t^ (°c)
Ng is the number of days in the heating season.
In the case of continuous heating, t^ = t^ , the internal design temperature. If is the heat supplied by the heating plant and H the incidental heat gains (kWh) then,w
24 NS
H + H = , nnnp w 1000
k=l
( qf + % ) ^ ( td ~ tok ^ 3*2*3
which can be rewritten,
24 Ns
Hp = 1000 ^ qf + qv ) ^ ^ ^ “ "hok " t ^ 3#2*^ k=l
1000 Hw
where, t = --- ,the temperature reductiog caused by 24 Ng ( q^. + qy ) incidental heat gains ( c)
Ns,
_
The expression ( t^ - t ^ - t ) ( c day) is the number of k=i
degree days , U(t^) , below the base temperature t^ = t^ - t ; an alternative form of equation 3*2.4 is thus,
24
Hp = 1000 ^ qf + % ^ D^b^ 3.2.5
and,
1000 H
tu = t . - 1--- H--- 3.2.6
24 Ns ( qf + (^ )
The Department of Energy considers an internal air temperature of 18.3 °c to be comfortable for normal living purposes and observations have shown that, in maintaining this temperature, the heating require ment,, more closely relates to the extent by which the outside air
temperature falls below 15*5 °c • This implies that a value for t of 2.8 °c is used to take account of the effects of incidental heat gains. The DoE regularly publish ( 4.) degree-days to a base temperature of . 15*5 °c. For many buildings however this figure is unrealistic : the correct value for t, should take account of the actual level ofb incidental heat gains and the heat conductance of the building using equation 3*2.6 •
Models which take account of these factors are termed 'variable base' degree-day methods , an example of which is the model embodied in the computer program ENGY (
7
)•The value of ^Kt^) is found by summing the daily values of the area EFCD in figure 3*1* To calculate degree-days in practice, several methods are available. Because the weather data supplied by our
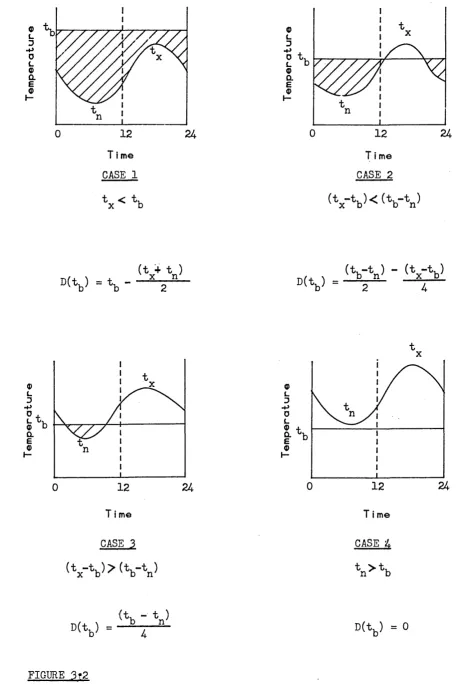
weather station in Sheffield contains only maximum and minimum daily air temperatures it was decided to adopt the British Gas method ( 22 )• An advantage of their method is that degree-days for heating and cooling are totalled separately so that,on a day where the base temperature lies
between the maximum and minimum outside temperatures,a correct figure for the night-time heat requirement is obtained ; the assumption being
that surplus heat gains during the day-time cannot be used to compensate
for night-time requirements.
Illustrated in figure 3.2 are the four different temperature profile cases together with the empirical formulae used for estimating degree-days.
Discussion
Nearly all the simple models for calculating heating plant
requirements are based on the fundamental equation 2.2*1* Uglow ( 23 ) describes one such model, Hitchin and Hyde ( 24 ) have compared several
models including the Degree-Day Method ; their conclusion was that the Degree-Day Method is probably the most complete of the simple models#
The main problem with the method lies in its use for intermittently heated buildings wher t^ is not constant# The following section shows how this problem may be overcome by calculating the average internal air temperature , t^, , and modifying the base temperature accordingly#
©
L D
-4->
0L ©
CL E ©
h-12
240
T i me CASE 1
t < t,
x b
© LD -*■>
0L
© CL E ©
t.
’b
12
0
T i me CASE 2
(V tb)<(V tn)
(t + t )
D< V = S - - V 1-
n,. » (V tn) - (V tb)
b = 2x
t.
’b
Q.12
0
T i me
CASE 3 (t -t, )> (t,-t )
' x
\>b n'
©
u D -POL ©
a
E ©
h-t.'b
24
12
0
T i me
CASE 4 t >t,
n b
(K
- t ) [image:40.613.47.515.28.718.2]D< V =--4
D(tb) = 0FIGURE 3t2
EMPIRICAL EQUATIONS FOR THE ESTIMATION OF DEGREE-DAYS
3.3 THERMAL CAPACITY AND INTERMITTENT HEATING
Heat Storage
Every building structure has a capacity to store heat. It is for this reason that buildings are observed to have a ’thermal inertia’ whereby internal temperatures do not instantly respond to changes in
heat input. ^
In a building of large thermal capacity e.g. a heavy masonry structure, the effects of thermal inertia can be substantial. After a long shutdown it can take several hours of preheating for the heating system to bring internal temperatures up to a comfortable level, conversely the building will cool down very slowly after
the heating is switched off. On hot sunny days the environment inside such buildings can remain comfortably cool because the structure has
a thermal averaging effect which damps out peaks of solar heat gain. •
Buildings of low thermal capacity built of lightweight materials, e.g. timber frame constructions, respond more quickly to heat inputs. Such buildings require little preheat time but are often subject to overheating during periods of high solar gain. Internal temperatures can fall very rapidly when the heating system is switched off and additional frost protection may be required in buildings that are intermittently heated during the winter.
A more correct heat balance than that of Section 3.2 includes consideration of heat storage
HEAT INPUT .= HEAT LOST + HEAT STORED TO OUTSIDE IN FABRIC
At any instant of time the quantity of heat absorbed by the fabric may be positive or negative depending on the difference between the
temperatures of the fabric and internal environment*
Over short time periods such as one day the change in heat stored can be significant compared to the total heat lost. However, as
discussed by Hitchin and Hyde ( 24 ) > over longer periods such as a month the change in the mean temperature of a building structure between the beginning and end of the period is likely to be a few degrees at most. The difference in energy stored in the structure is consequently two or three orders of magnitude lower than the total heat requirements. For these reasons the Degree Day method can be reliable for calculating energy requirements over periods of a month or more but the method should not be used for daily or weekly ' calculations.
Variation of Inside Air Temperature
With continuous heating it could reasonably be assumed that the air temperature within a building would be constant with time. In practice there would be small variations of temperature within the set limits of each thermostat but variations of short duration should not have a marked effect on predicted energy use.
When a building is intermittently heated, inside temperatures are allowed to drop when the heating is turned off. A building of
high thermal capacity will store sufficient heat during the heating period to keep inside temperatures well above outside if the ’ off1 period is not of long duration. Temperature variations of less than four or five degrees between the ’on1 and ’off’ periods are common
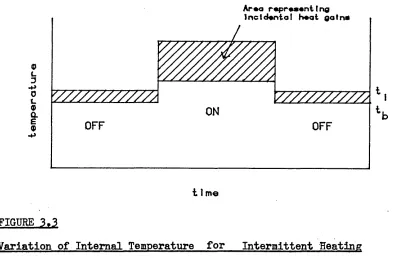
( 25 )• Peach ( 26 ) recognised that, in addition, most incidental heat gains are likely to occur during the heating period when occupants are present and solar energy is being received. As illustrated in Figure 3*3, the effect is that the fictitious base temperature used by the Degree Day method is even less variable
than the Inside air temperature. Therefore, the Degree Day method could still be expected to hold for buildings of heavyweight
construction and the degree day base temperature could be determined in a similar manner to that described in Section 3.2.
Araa r*pr*»«ntIng Incidental heat Qatn*
9
L.
3
•+>0 9
•p
[image:43.614.90.484.147.408.2]t ) me
FIGURE 3.3
Variation of Internal Temperature for Intermittent Heating
However, in order to determine a more representative base temperature , particularly for buildings of low and medium thermal capacity , it is necessary to more precisely establish the variation of internal temperatures.
The extent to which the internal temperature will fall during the ' offT period and its rate of decrease will be affected by three
factors
(i) the difference between inside and outside air temperatures
(ii) the length of time for which the heating is left off
(iii) the thermal capacity of the building related to its heat conductance
In order to take account of these factors the concept of 'Admittances’ has been incorporated into the degree day model.
The Admittance Procedure
The theory of Admittances1 was originally developed to investigate the overheating of buildings in summertime. The need for this analysis arose from changes in construction practice which had caused many schools and offices to be built with large areas of glazing and a thermally lightweight construction.
Loudon and Danter ( 27» 28 , 29) developed a method of determining
the thermal response of buildings to cyclic energy inputs such as solar heat gain. This work was further developed by Millbank and Harrington-Lynn ( 30,'31 ) and forms the basis of the admittance
procedure described in the CIBS Guide Section A5 : ’Thermal Response
of Buildings’ ( 9 )•
The fundamental theory of the admittance procedure is that any periodic change in heat input or temperature can be represented by an average condition and a series of sinusoidal changes at increasing frequency - a ’Fourier Analysis’. The admittance method ignores all frequencies other than the fundamental 2A hour cycle such that two equations of heat flow now apply
Q = ( qf + cjy ) ( t± - tQ ) AVERAGE 3.3.1
QB = ( <3y + % ) tie SWING 3.3.2
where, q = ^-AY the sum of the products of area and admittance for all internal and external surfaces in the building (W/°C) Y is the admittance factor calculated for each suface and is the amount of energy (W/m^ °C) entering the surface for
each degree of temperature swing.
t^ , t are the daily means of internal and external air temperature.
temperature about their respective mean values Q and t^ such that at any time 0 , t. = t. + t . and Q = Q + Q •J 7
I Q 1 10 9 B
Although accuracy is lost by ignoring frequencies other than the fundamental, Millbank and Harrington-Lynn ( 30 ) have shown that the
errors incurred are not significant. More complex models do exist which
take into account the higher frequencies in the Fourier series : these are the 1 Response Factor1 models mentioned in Section 1.2 •
At any time B , the heat balance for a building is now given by :
V + he = ( qf + ‘V )(
\
"
\
} + ( + h )(%© " h } 3,3,3
average swing
where, and are the heat inputs (V/) from the heating plant and from incidental heat sources.
For intermittently heated buildings the 24 hour cycle is split into the !0NT and ’OFF’ periods.
During the ON or control period t^ = t^ , the design internal air temperature, thus :
0y>Q + C) w6 = U» ( t . - t ) 1 o + Yf ( t , - t. ) d 1 ' 3.3.4
where, U T = ( qf + q^. ) and Y f = ( qy + q^ ) During the OFF period Qp0 = 0 hence,
h e = u’ < h - \ > + Y ’ ( h e " h } 3,3,5
The preheat period is undefined in the admittance procedure. Summing over 24 hours and noting that , by definition ,
24
< ( t. - t. ) = 0 we have : «< ie 1
0=1
24
v
k-h 8 + -5: Qpo = 2U U< ( t. - t ) 3.3.6
e=i w e=k 1 0
where, h is the plant ON time in hours. P
Summing over the control period,
h + k h + k
Qpe = V (
\ ~
*0
> + V ( *d "
\ ) ~
*W.
0 =k 8 -k
Eliminating between equations 3*3*6 and 3*3*7 yields
24 h + k _
^
^
V u,(ti -10) - V ’(td - 3-3*8
0 =i
e
=kIf all the incidental heat gains are assumed to occur during the 24 h + k
€ % e -0 =1 0 =k
24 h + k
heating period then ^ = P ^ Qwe and equation 3*3*8 may be written,
( 24 - hp ) U' ( t± - t0 ) = hp Y' ( td - t± ) 3.3.9
and some rearranging gives :
( 24 - h ) U* t + h Y’ t ,
t. = — E J o---E---- d_ 3>3ao U' ( 24 - hp ) + hp Y'
Y'
by putting f = ^7 * the total building ’response factor’ :
h f ( t , - t )
t. = t + ---— 3.3.11
hp fr + (24 - hp)
which is the equation given in the CIBS Energy Code ( 32 )
Substitution for t^ in equation 3*3*6 now gives, 24 ^ h f ( t , - t )
< 0 + W0 ^ j?0 = 24 U' -E— 2--- n « , /p» . \— 3.3.12
0 =1 ON hp r p '
or, 24
9
< Q^g = 24 U’ B ( t - t - ) 3.3.13
oiT
24 U* Bwhere. B
h f + (24 - h )p r p ' , the 1intermittency factor1•
If we consider a heating season of N days we now have an equations of similar form to equation 3.2.4 in Section 3*2 such that,
A similar derivation to that shown above is given by Moore and Holmes ( 33 )• Spooner ( 34 ) compared average temperatures calculated
carefully monitored house and suggested that there was good agreement*
Time Lags
Due to the capacity of a building*s fabric to store heat, there
will be a certain time lag between a change in external temperature and the corresponding fluctuation in internal surface temperature* Time lags have been ignored in the above derivation. However, as long as it can be assumed that external conditions one day are more or less like the next then the average outside temperature would be about the same and a summation of degree-days would still be expected to be representative of the heat requirement. On the whole, this is true of Britain* s climate and sharp changes of more than a few degrees between one day and the next are uncommon.
Utilisation of Solar Heat Gains
Not all the solar radiation entering through the windows of a
building may represent useful heat gain. The thermal averaging effect 3.3.14
where, H^ is the seasonal heat requirement (kWh) from the heating plant and t^ is now given by,
3.3.15
from equation 3.3.11 with actual internal temperatures from a
of the thermal capacity of a building will damp out peaks of solar
gain but at times it is still possible that heat gains will exceed the heat losses from the building. At these times there will be a surplus of heat and the building will overheat unless steps are taken to prevent overheating e.g. by air conditioning or incresed natural ventilation.
Owens ( 35 ) has proposed the use of utilisation factors whose value depends on the thermal capacity of a building and the ratio of heat gains to heat losses. Uglow ( 36 ) also suggests the use of utilisation factors and she gives a range of factors for light, medium and heavyweight buildings for different glazing orientations.
The British Gas method of calculating degree-days already takes some account of the incomplete utilisation of incidental heat gains. Figure 3*3 shows that, when the degree-day base temperature lies between the maximum and minimum outside temperatures, only the shaded proportion of incidental gains are considered useful. In other cases, when the base temperature exceeds the maximum outside temperature,
UJ
3
\-<
O'Id a.
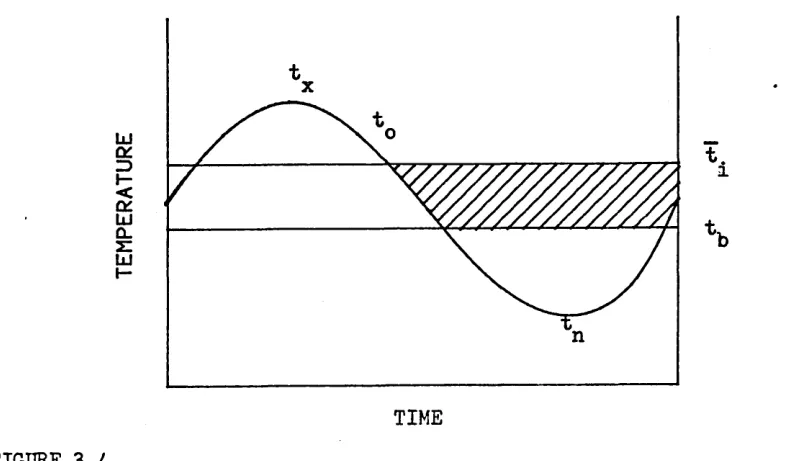
[image:48.615.87.487.464.695.2]TIME FIGURE 3.A
The variation of temperature over 24- hours for the case t < t ^ < t x
all the incidental gains are considered useful but at these times there is unlikely to be surplus heat. Although it is difficult to shov that this method makes correct allowance for surplus heat gains it would be wrong to apply the utilisation factors of Uglow or Owens because they have been developed for use in different methods of calculation of heat requirement.