Hydrodynamic lubrication and coating of wire using a
polymer melt during drawing process.
CRAMPTON, Richard.
Available from Sheffield Hallam University Research Archive (SHURA) at:
http://shura.shu.ac.uk/19508/
This document is the author deposited version. You are advised to consult the publisher's version if you wish to cite from it.
Published version
CRAMPTON, Richard. (1980). Hydrodynamic lubrication and coating of wire using a polymer melt during drawing process. Doctoral, Sheffield Hallam University (United Kingdom)..
Copyright and re-use policy
See http://shura.shu.ac.uk/information.html
FULYi ,,;1 1L LIUKAKX
i' J N D ai'SEfcii’
S H riF M iiLD S I 1WB b730
799M-5 001X
Sheffield City Polytechnic Eric M ensforth Library
REFERENCE ONLY
This book must not be taken from the Library
PL/26
Cy<> LCl - o
n
H ■ S c
%
\?<\\
nU
•
"1 ^ ° \ p ^
n ^
ProQuest Number: 10694389
All rights reserved
INFORMATION TO ALL USERS
The quality of this reproduction is d e p en d en t upon the quality of the copy submitted.
In the unlikely eve n t that the author did not send a c o m p lete manuscript
and there are missing pages, these will be noted. Also, if m aterial had to be rem oved, a note will indicate the deletion.
uest
ProQuest 10694389
Published by ProQuest LLC(2017). Copyright of the Dissertation is held by the Author.
All rights reserved.
This work is protected against unauthorized copying under Title 17, United States C o d e Microform Edition © ProQuest LLC.
ProQuest LLC.
789 East Eisenhower Parkway P.O. Box 1346
COUNCIL FOR NATIONAL ACADEMIC AWARDS
HYDRODYNAMIC LUBRICATION AND COATING OF WIRE USING A POLYMER
MELT DURING DRAWING PROCESS
A thesis submitted for the partial, fulfilment
of the degree of
DOCTOR OF PHILOSOPHY
by
Richard Crampt on BSc«
S ep t ernb er 1 SI SO
Department of Mechanical and Production Engineering, Sheffield City Polytechnic, (Sponsoring Estahlishrnent)
f P v T f
CONTENTS page
ACICNOWLEDGEMENTS viii
DECLARATION ix
SUMMARY
NOTATION X I
1. INTRODUCTION . 1
1.1 The,Wire Drawing Process - 1
1.2 Historical Background of the Christopherson Tube 2
1.3 Polymer Melt as a Lubricant 5
1 .If Scope of the Present Work . 8
2. RHEOLOGY OP POLYMER MELTS 10
2 jSC Introduction 10
2^2N The Effects of Temperature on Viscosity 10
2^3 The Effects of Shear Stress and Strain on
Viscosity 11
2.3*1 Critical Shear Stress 12
2.3*2 Sharkskin 1U
2^jX The Effects of Pressure on Viscosity 15
2.5 The Effects of the Polymer Flow Characteristics 16
3. DESIGN, DEVELOPMENT AND CONSTRUCTION OF THE .
TEST EQUIPMENT ■ 23
3*1 Description ofthe Existing Equipment 23
3.2 Modification to the Experimental Rig 26
3.3 Hydrostatic Rig 32
4. 4.1 4.1.1
4
.
1.24.1.3 4.1.4 4.2 4.3 4.3.1 4.3.2 4.3.3 3.-3.1 3.2 6
.
6.1 6.2 6.3 • 6.4 7. 7.1 7.2 7.3 7.3.1TEST PROCEDURE AND RESULTS PROM THE TESTS Test Procedure
Test procedure Adopted for the Hydrodynamic Rig Problems Encountered with the Hydrodynamic Rig Test Procedure Adopted for Pressure Assisted Apparatus
Problems Encountered with the Pressure Assisted Rig
Determination of the Yield Characteristics of the 'Wire
Results from the Tests
Results of Coat Thickness versus Drawing Speed Results of Pressure and Load
Miscellaneous Results
ANALYSIS OP THE PROCESS
Critical Review of Previous Analyses Analysis
RESULTS PROM THE ANALYSIS Introduction
Theoretical Coat Thickness
Theoretical Pressure Distributions
Theoretical Stress Distributions in the Wire
ALTERNATIVE THEORY Introduction
Analysis
Results from the Analysis
Theoretical Christopherson Tube Length
7.3*2 Results for Coating Thickness
7.3.3 Results for Pressure Distributions
7 .3 .2-1. Results of Stress Distributions
129 135 135
8. DISCUSSION 1U0
/
8.1 - Error Analysis 1^+0
8.2 Experimental Procedure and Results 12-&
8.3 Results from the Analyses 152
8.3.1 Basic Analysis 155
8.3.2 Alternative Theory 159
8.U Comparison between Analyses and Experiment 162
8.5 Recommendations for Future Work 164
,8.5.1 Experimentally' ' *!&;
8.5.2 Theoretically 165
9. CONCLUSIONS 169
10. REFERENCES 170
APPENDIX I # Development and listing of Computer programs
17U-APPENDIX II. Newtonian Solution 196
APPENDIX III. Catalogue of Results 200
LIST OF COURSES, VISITS AND PAPERS PUBLISHED 215
LIST OF FIGURES page
1. Typical Inlet and Die 6
2. B.I.S.R.A, Nozzle-Die Unit 6
3. High Pressure Die Unit 7
4. Double Die 7
5. Effect .of Temperature on Viscosity of Polymer 18
6. Effect of Temperature on Viscosity of Alkathene 23 18
7. Flow Curves for Alkathene V/VG 23 19
8. Viscosity versus Shear'Stress for Alkathene WVG 23 20
9. A Possible Mechanism of Sharkskin 21
10. Pressure versus Viscosity for Polyethylene 22
11. Flow Curves for 0.92 Polyethylene 22
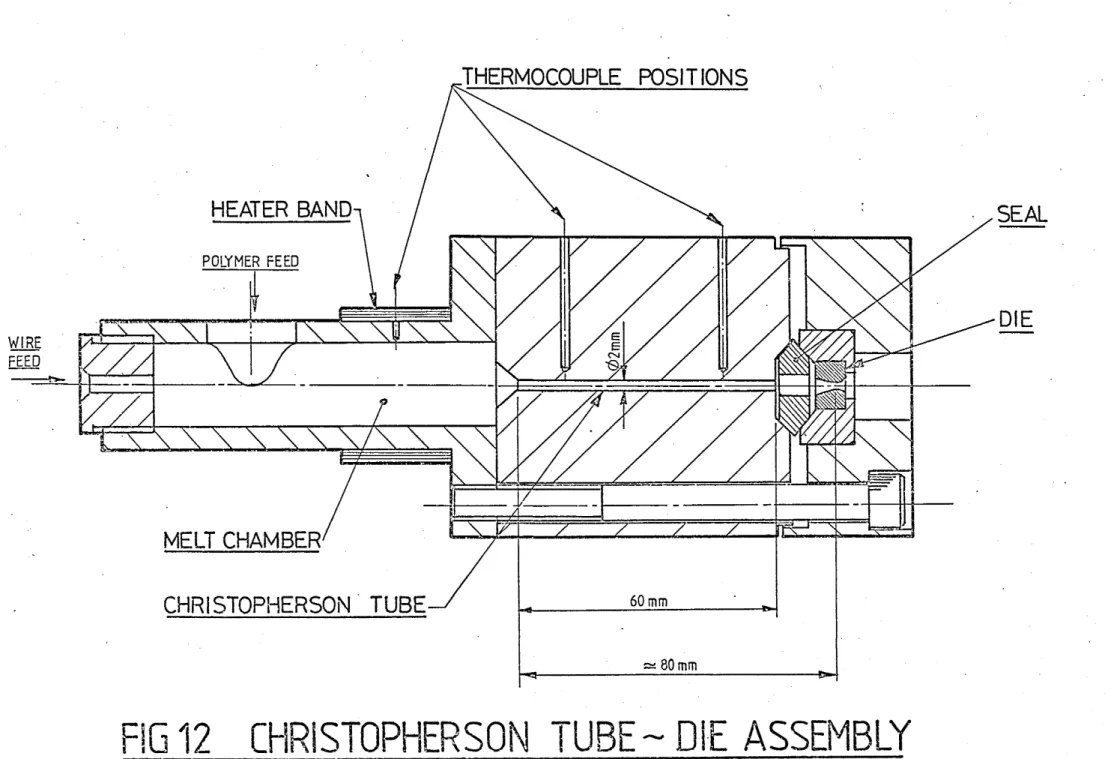
12. Christopherson Tube-Die Assembly 25
13. Wire Feed Mechanism 28
14. Proposed Method of Measuring Pressure 29
15. Christopherson Tube with Pressure Transducers 30
16. Modified Bull Block 31
17. Hydrostatic-hydrodynamic Christopher son Tube '$6
18. General Arrangement of Hydrostatic Rig 37
19. Typical Trace of Pressure 42
20. Yield Characteristics of Copper Wire • 48
21. Yield Characteristics of 18/8 Stainless Steel 49
22. Yield Characteristics of 60/65 Steel wire 50
23. Coating Thickness on Copper with WVG 23 (30/
reduction) 58
24. Coating Thickness on 60/65 Carbon Steel Wire
with WVG 23 (30/ reduction) 59
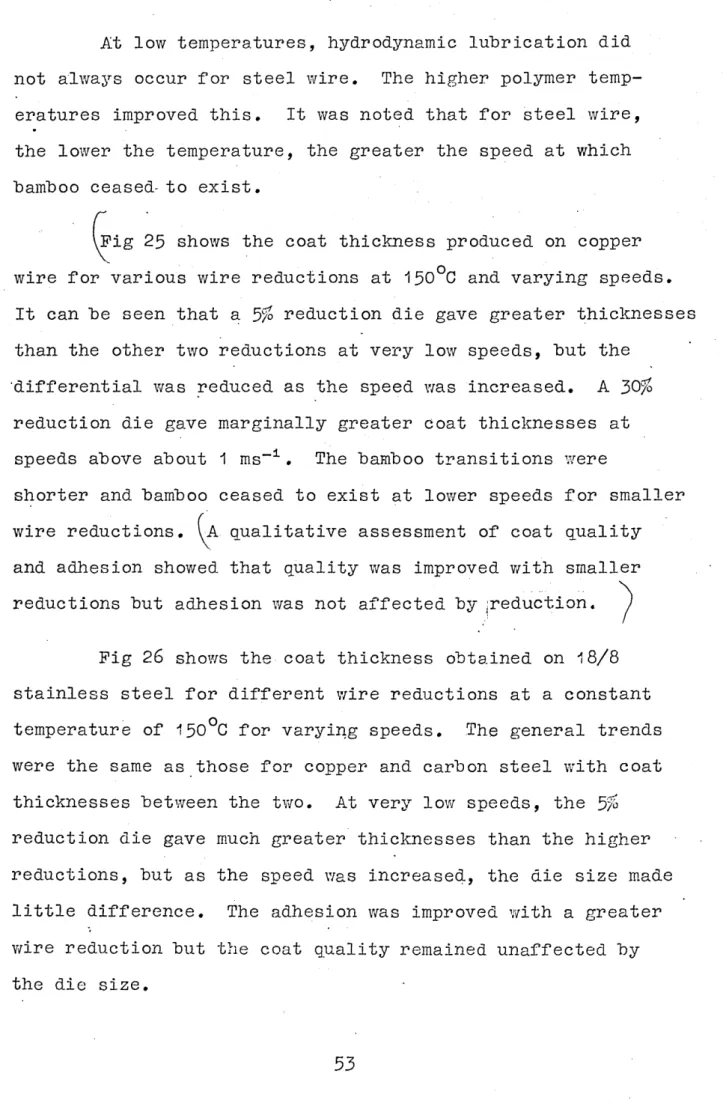
25* Coating Thickness on Copjjer with WVG 23 (150°C) 60
26. Coating Thickness on 18/8 Stainless Steel Wire
with WVG 23 (150°C) 61
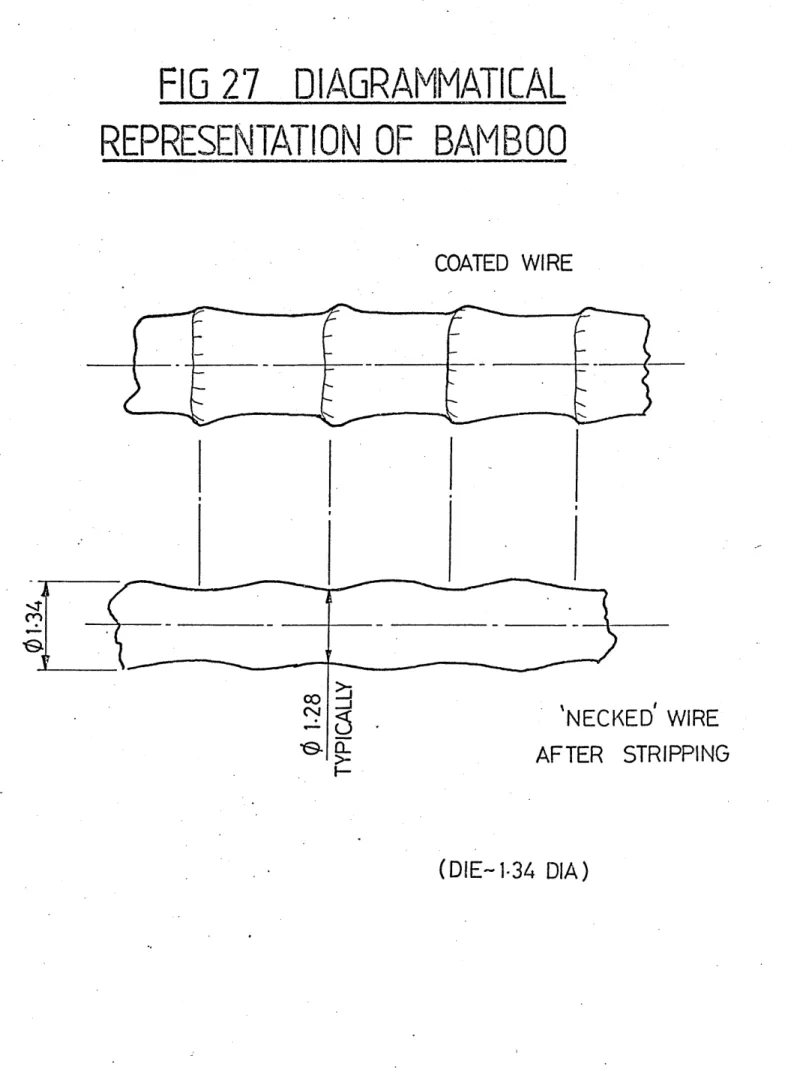
27. Diagrammatical Representation of Bamboo 62
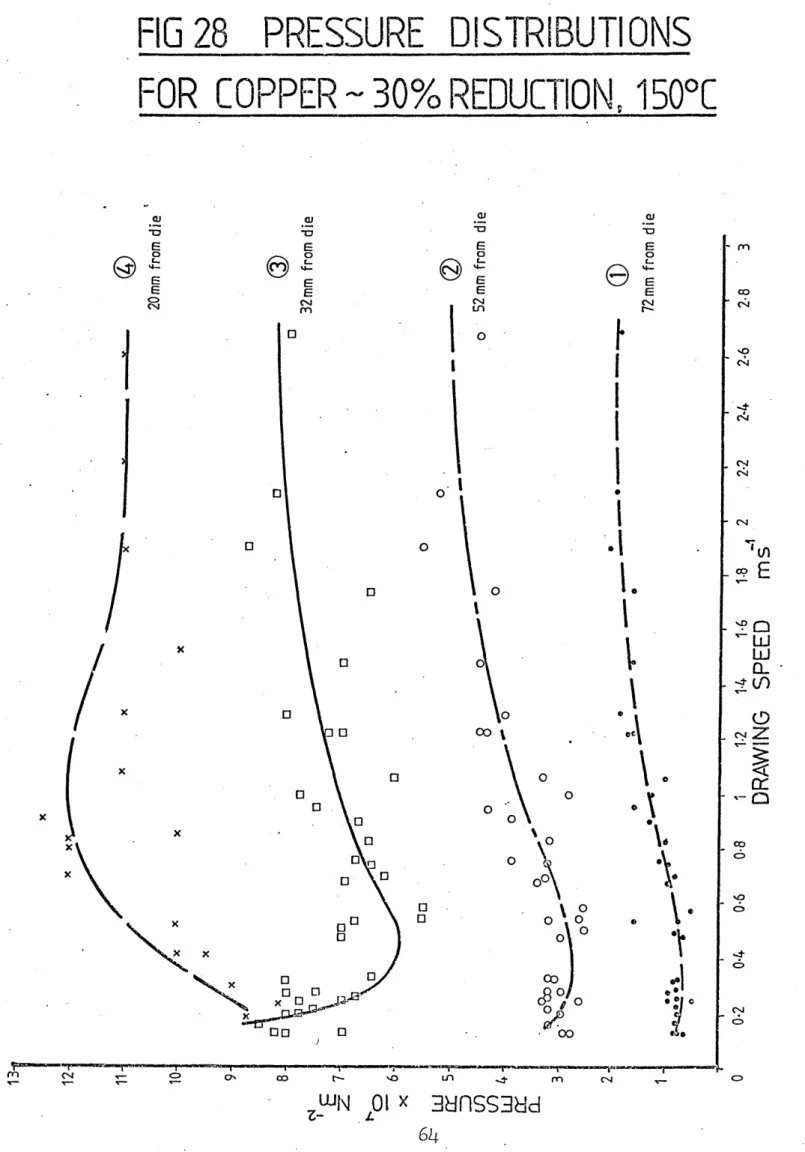
28. Pressure Distributions for Copper - 30/S, 150°C 64
29. Pressure Distributions for Copper - 5$*.150°C 65
30. Pressure Distributions for 18/8 - 30/, 150°C 66
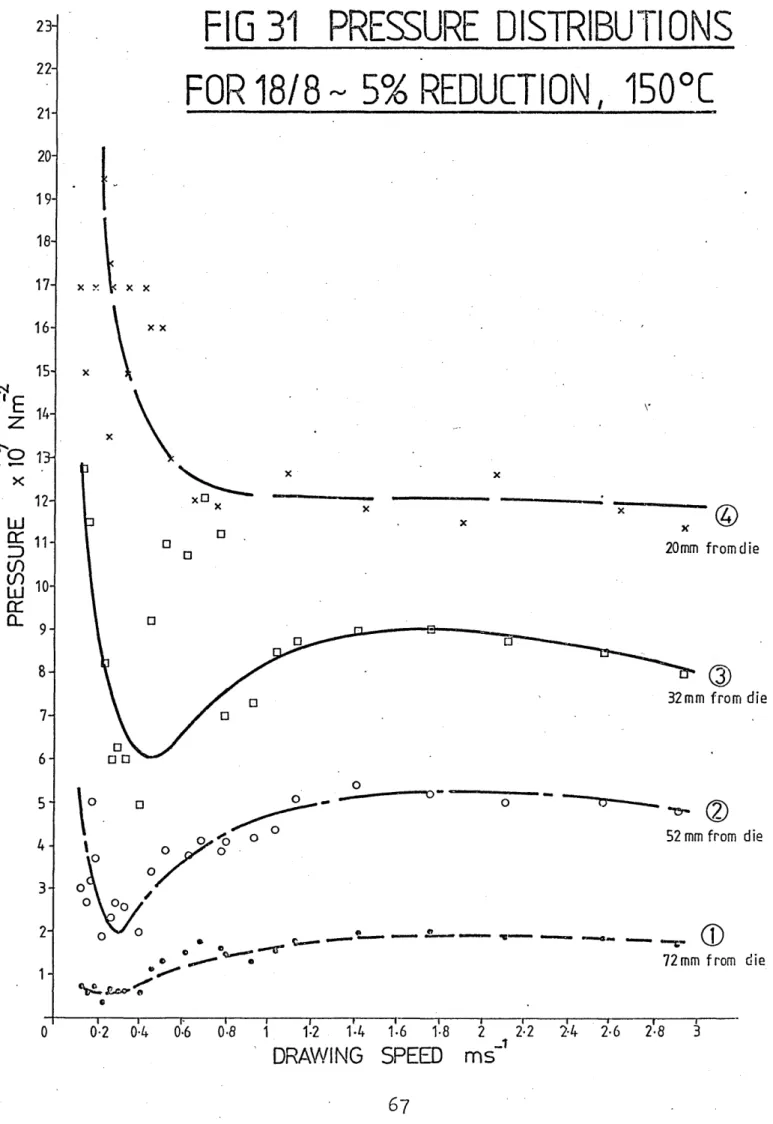
31. Pressure Distributions for 18/8 - 5/, 150°C 67
32. Drawing Loads 68
33. Experimental and Predicted Wire Profiles 69
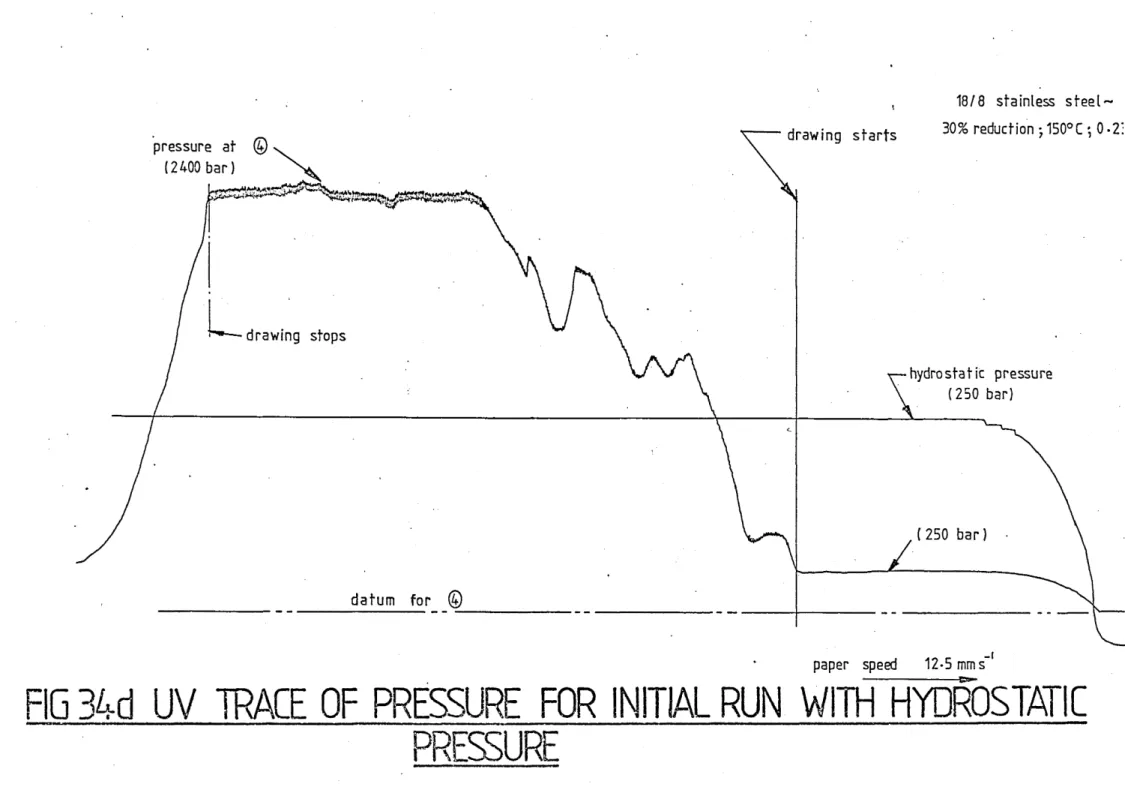
34. UV Traces of Pressure 70
35. UV Traces of Pressure 73
36. Geometry used in the Analysis 78
37. Theoretical Variation in Coat Thickness due to
changing yield stress of wire 99
38. Theoretical Variation in Coat Thickness due to
changing Gap 100
39. Theoretical Variation in Coat Thickness due to
changing Christopherson Tube Length 102
4-0. Theoretical Variation in Coat Thickness due to
Critical Shear Stress 104
41. Theoretical Variation in Coat Thickness due to
changing Wire Radius 10-5
42. . Theoretical Variation in Coat Thcikness due to
changing Initial Viscosity 106
43a. Theoretical Variation in Coat Thickness due to
changing Pressure Coefficient of Viscosity 107
43b. Theoretical Variation in Coat Thickness due to
changing Shear Coefficient of Viscosity 105
44. Theoretical Variation in Coat Thickness due to
changing Die Size * 109
45. Theoretical Variation in Coat Thickness due to
omitting Strain Rate Sensitivity 11C
4.6a. Theoretical Variation in Coat Thickness due to
changing Deformation Length 111
4.6b. Theoretical Variation in Max Thickness and
Critical Speed due to changing C^, 112
47. Theoretical Pressure Distributions - 30% reduction 11 to
4-8. _ Theoretical Pressure Distributions - 5% reduction 117
4-9* Theoretical Stress Distribution - 30% reduction 118.
50. Theoretical Stress Distribution - 5% reduction 119
51. Theoretical Velocity Gradients in the Gap 121
52. Theoretical Christopherson Tube Length 128
53. Theoretical Variation in Coat Thickness due to
changing Initial Yield Stress of Wire 131
54-. Theoretical Variation in Coat Thickness due to
changing Gap 132
55• Theoretical Variation in Coat Thickness due to
changing Initial Viscosity 133
56. Theoretical Variation in Coat Thickness due to
changing Die Size 134
57® Theoretical Pressure Distributions - 30% reduction 136
58. Theoretical Pressure Distributions - 5% reduction 137
59* Theoretical Stress Distributions - 30% reduction 138
60. Theoretical Stress Distributions - 5% reduction 139
61. Comparison of Coat Thicknesses as Predicted by
the Various Analyses and Experiment 166
62. Comparison between Theory and Experiment for
Pressure Distributions - 30% reduction 167
63# Comparison between Theory and Experiment for
Pressure Distributions - 5% reduction 168
A1 . Flowchart for Program 1 *179
A2. Listing of Program 1 181
A3. Flowchart for Program 2 1 8A
Ai+. Listing of Program 2 186
A5. Typical Printout from Program 2 19°
A6. . Flowchart for Program 3 191
A7. Listing of Program 3 - 193
A8. Typical Printout from Program 3 195
LIST OF PLATES Facing page no
Plate 1
.
General view of equipment showing feed mechanism 27Plate 2. View showing hydrostatic feed cylinder 27
Plate 3. Christopherson tube-die unit 27
Plate h. Modified hull hlock 32
Plate 5. Modified hull hlock 32
Plate 6
.
Hydrostatic feed cylinder and operating valve 32Plate 7. General view of the equipment 38
Plate 8. View of instrumentation 38
Plate 9. View of instrumentation 38
Plate 10. Copper wire showing hamhoo - 30/o reduction 63
Plate 11. Copper wire showing hamhoo - 3% reduction 63
Acknowledgement s
The author1 gratefully acknowledges the valuable suggestions and friendly advice given by Dr. G.R.Symmons under whose supervision this work was carried out. Thanks are expressed to Mr. P.J.Thompson, whose suggestions were received with gratitude.
Dr. M.S.J.Hashmi is thanked for giving advice when it was needed the most.
The technical assistance offered by Mr. R.Teasdale and his staff was much appreciated and particular thanks go to Mr. D. McKay, Mr J.Walton, Mr. R.Wallis and Mr. R.Wilkinson for their assistance in manufacturing and setting up the experimental equipment.
The author also wishes to thank the Collaborating Establishment, Arthur Lee and Sons Ltd., Sheffield, for
Declaration,
No part of this work has been submitted in support of an application for another degree or qualification to
this or any other establishment. The author further declares that he has not been a registered candidate for any other awards of the CNAA or of a University during the duration of the research programme.
R. Crampton.
•SUMMARY
A device "based on an adaptation of the Christopherson tube is investigated for the lubrication and other effects of employing a polymer melt as the lubricant during the wire drawing process * The device is heated to convert the polymer feed into a viscous melt and the pressure required is generated by a hydrodynamic action produced by the motion of the wire.
On the basis of experimental evidence, it is apparent that deformation commences before the wire reaches the die, in the Christopherson tube itself, with the die effectively acting only as a seal. Under these conditions, the die
geometry becomes of. secondary importance and the deformation actually takes place as if an effective die; of continuously changing die angle is being used. To take this aspect of the process into account, a mathematically described effective die shape is used in the present analysis. The plastic strain hardening properties and the strain rate sensitivity of the wire material are also incorporated into the analysis.
The study utilises an empirical expression relating shear stress and rate of shear together with an experimentally derived pressure coefficient of viscosity, in determining the coat thickness possible on the wire. The theory contains the effect of a limiting value to the shear stress, which exhibits itself as slip in the polymer. An alternative theory is also presented which assumes that shear stress is zero at the
polymer/tube interface. This much simplified analysis allows the length of the deformation zone to be determined.
An extensive series of experimental studies have shown that the coat thickness reduces both as speed increases and as the wire material strength increases. Predictions of coat thickness from the analysis tend to be lower than those
obtained experimentally. At low drawing speeds a coat defect was observed which gave the coated wire a ’'bamboo" shape.
It is probable that this defect is caused by the slip-stick nature of the polymer melt in the Christopherson tube. The assumed die shape and predicted pressure distributions are verified by experiment.
NOTATION a,t>,c,A,B-,Ci-C7 CF D h
ha
k K L LCT n N P Qs
T Uua
us ConstantsFraction of Christopherson tuhe at which aeformation commeiices measurea from the aie
Wire aiameter at any point auring aeformation
Raaial gap between wire ana Christopherson tube
Polymer coat thickness
Polymer constant of shear
Strain harbening constant
Length of Christopherson tube ana aie unit
Length of Christopherson tube in which v/ire remains unaeformea
Strain harhening inaex
Material constant
Pressure
Volumetric flow rate of polymer melt per unit length of
circumference of wire
Dynamic/static stress ratio
Material constant
Wire speea aheah of aie
Wire speea after arawing
v ... Fluid velocity
x,y,z o.»« Rectangular coordinates
Y ... Yield stress of wire
Yo . * * * Initial yield stress of wire
a ••••••*.•. Die semi angle
Y .... •.... Shear rate
e... ... Natural strain
Tf)6 • Viscosity of polymer melt at
zero shear
.11 a... ... Viscosity of polymer melt at ambient pressure
0 *«»»•••••• Stress in wire
T •«•••••••• Shear stress in polymer melt
Ic... ... Shear stress at wire-polymer interface
Critical shear stress
Subscripts:-' >
1... ...* Before deformation
2 ••••••.... After deformation
r •*•••••«•• Denotes radial direction
x Denotes x direction
Note: Wire reduction is given by; Dj - p|
CHAPTER 1. INTRODUCTION,
1.1 The Wire Drawing Process.
The wire drawing process involves pulling a length of metal wire (usually circular in cross section) through a tapered die, in order to obtain a. reduced wire diameter of a specific size whilst improving surface quality, obtaining the desired metallurgical properties and maintaining a high reproducibility of the product. These are generally achieved with the wire unheated (cold drawn) and hence deformation loads are high, making efficient lubrication essential. Traditionally, there are two basic methods of lubrication in wire drawing; wet and dry, which differ as regards
preparation of wire, lubrication and design of machine. Wet v/ire drawing is generally conducted on wires of diameter less than O.U6mm (26 s.w.g.). The dies are totally submerged in a solution of soap in water-. B'oundary lubrication is the operating regime, producing a highly polished drawn wire.
Dry drawing is used on wires and rods of diameter above O.U^mm. Here the lubricant is usually a powdered calcium or sodium
stearate soap. The dry soap compound is placed in a box, through which the wire passes immediately before entry to the die. To assist pick-up of soap from these boxes, the wire is often coat with either lime or borax in a treatment prior to drawing. The lubrication regime in this case has been termed "quasi-hydrodynamic"1 , since the soap film
* Numbers as superscripts refer to references which may be
found in Chapter 10. * ■
thickness produced on the drawn wire is greater than that which would he expected from boundary lubrication, but less than those for hydrodynamic lubrication.
These methods have been used almost exclusively for many years, but evidence is growing that they may be reaching the limit of their development, and consequently, other ways of lubricating the wire are being investigated.
1.2 Historical Background of the Christopherson Tube.
The wire drawing process, although basically a simple forming operation, needs to achieve many objectives if it is: to be used efficiently in production. These may be summarised as follows
a) High drawing speeds whilst maintaining wire quality
b) High reductions in area per pass
c) Improved dissipation of heat; from the wire and .hence low v/ire temperature
d) An improved surface finish and clean wire
e) Reduction in cost by; i) Reduced drawing times
ii) Elimination of pre-drawing treatments
iii) Reduction of the number of interpass heat treatments iv) Reduction of down time due to changing dies because
of excessive wear.
In the past, the wire drawing process had been
regarded as an art where die angles and reductions and the lubricant specification were arrived.at mainly through trial and error. More recently, however, attempts have been made to introduce a more theoretical background to the process. This deeper understanding makes it possible to introduce new techniques which, hopefully, allow the aims of increased production to be met. Wistreich2 had established that an increase in wire drawing speed should be possible if the die friction could be reduced. One way of achieving this would be to increase the die angle, but this would cause an increase
in redundant deformation, increasing the rise in temperature of the drawn wire. The surface temperature of the wire is required to be kept to a minimum in order to prevent a deterioration in the surface quality and metallurgical properties of the wire.
In 1955, Christopherson and Naylor3 presented a paper which showed a method of reducing friction in wire drawing by hydrodynamic lubrication. It had been assumed that friction in conventional wire drawing was of a boundary
nature and that a change of mode to hydrodynamic lubrication should greatly reduce friction. The device used by
Christopherson and Naylor was based upon an idea suggested
in 19U-3 "by Maclellan and Cameron4 . This device, now called
the Christopherson tube, consisted of a long tube filled with lubricant, through which the wire passed before entry to the die, and sealed to the approach side of the die.
Early efforts were aimed at producing hydrodynamic' lubrication using oil, since the rheology of oil was well known, but it
was quickly realised that many problems were inherent in its use* These were the necessity to have long inlet tubes
(up to 0 e8m) and very small wire clearances (0.04 - 0.05fiim
on radius). It was also necessary to provide a ''leader"
to the full size wire to encourage flow to start (see Pig 1). Even then a finite length of wire would remain unlubricated at start up, before sufficient pressure was generated to promote hydrodynamic lubrication. Since oil is a poor boundary lubricant, die wear and seizure were inherent
problems at start up. These problems were largely overcome by returning to the traditional dry soap lubrication. This
enabled the Christopherson tube to be shortened and since soap is a very good boundary lubricant, start up was no longer a problem. These ideas led to the design of the BISRA dry soap nozzles5 (Pig 2). The main limitation of
these designs seemed to be the deterioration of the lubricating properties of soap when its moisture content is high. Other ideas have stemmed from the desire to have a thick film
lubricated die. The most notable of these are the hydrostatic die unit and the double die system. In the hydrostatic die, the lubricant (usually oil) is externally pressurised and fed to the wire in a chamber between an "ironing" die v/hich acts as a seal and the die proper6 (Fig 3)• Subsequently it was found that the ironing die produced more problems of die wear than the simple single die system. This was because the ironing die reduced the wire by a small amount
(around 5%) under poorly lubricated conditions. This
system also required the use of a pump capable of producing very high pressures. The double die system seemed to offer a better solution. Here two dies with a sealed chamber
■between them are used7 • The approach die has a diameter the
same as the nominal size of the undrawn wire (Pig Soap
compounds are used as the lubricant. This system has received much favour in the USSR where it is claimed that one of
these units increased die life by 500% and mill output by up
to 53%f while electric power consumption was reduced by i|8%8 .
1.3 Polymer Melt as a Lubricant.
The use of solid polymers as a lubricant is not a new concept; it has been used successfully in cold deep drawing for many years. However, the use of polymer melts as a lubricant has not been'exploited to the same extent.
There are many important differences in the rheology of molten polymers when compared to conventional lubricants such as oil. The most obvious of these is the very high viscosity of polymer melts at temperatures which would preclude the use of oil as a lubricant. It is also well known that the viscosity of polymer melts is reduced when the melt is- subjected to shear stress (ie. it is shear
thinning). Above a certain level of shear stress a discon tinuity in flow has been observed for certain polymers9 . An increase in hydrostatic pressure increases the viscosity of the polymer melt10 „ These rheological effects and their consequences are discussed in detail in Chapter 2.
PRESSURE TUBE
FULL SIZED WIRE
HIGH PRESSURE SEAL
/ /
OIL RESERVOIR
DIE
LEADER WIRE
FIG 1 TYPICAL INLET TUBE AND DIE
TUNGSTEN CARBIDE INSERT PRESSURE NOZZLE
DIE
SEALING WASHER
LUBRICANT
INLET-WIRE
DIRECTION
IRONING DIE- REDUCTION DIE
FIG 3 HIGH PRESSURE DIE UNIT
SEALING WASHER PRESSURE DIE DRAWING DIE •
WZ, WIRE DIRECTION
•1 ,lj. Scope of the Present Work.
The application of the Christopherson tube in the present work was originally conceived in order to overcome the difficulties associated with using soap or oil as the lubricant and to provide an alternative lubricating system which would have very different characteristics to those currently in use. It was thought that since the viscosity of polymer melts appeared to be considerably-greater than that of oil, and that they did not suffer from moisture
absorption as did soap, they would provide an ideal and novel solution to the problem. In addition, if the polymer could be made to bond successfully to the wire, it could be used
to protect the wire against corrosion in storage and to lubricate subsequent forming operations such as bending or
cold heading. Initial research11 > 3°>31 showed that certain
limitations were present
a) At very low drawing speeds the coated surface of the wire exhibited a "bamboo" effect causing the wire itself to be of varying diameter,
b) The coating adhesion was not as good as v/as hoped but this was improved by increasing the wire temperature relative to the polymer temperature. This unfortunately led to a decrease in coat thickness and increased the bulk temperature of the wire.
c) As drawing speed was increased, the coat thickness was reduced.
d) The dimensional and operating restrictions on the
Christopherson tube were not reduced as much as was thought possible.
e) The wire was ineffectively lubricated at start up causing wire fracture in realistic operating'conditions.
Stevens11 produced a computer aided solution for the design of a Christopherson tube-die unit for specified
operating conditions. He used a simplified theory based on the assumption that the polymer melt viscosity remained
constant with respect to pressure and shear stress-, employing the concept of apparent viscosity.
The principal objectives of the present study
are:-a) To improve the analytical solutions presented earlier by including both pressure and shear components of viscosity.
b) To consider in detail the deformation process and to
include into the analysis the effects of strain hardening and strain rate sensitivity of the wire material.
c) To verify, or otherwise, any theory with extensive practical tests.
d) To investigate the performance of a hydrostatic/hydro dynamic system of lubrication and other means of improving the process in order to make it more acceptable to industry.
CHAPTER 2, THE RHSOLOGY OF POLYMER MELTS.
2.1 Introduction.
Polymers are unlike most materials in that they are composed of very long molecular chains. Bonding between the chains is either by cross-linking, as in thermosetting
polymers, or by molecular attraction (Van der Waals forces) between the chains, as in thermoplastic polymers. Normally, the chains are randomly orientated, but if stress is applied, the chains would firstly straighten out and then, as further stress is applied, the bonds between the chains would be broken. The straightening out of the chains is partially recoverable, causing the polymer to act elastically. The breaking of the bonds enable flow to occur. The flow
characteristics of polymer melts are very different to those of conventional lubricants such as oil. In this chapter, discussions are made of these characteristics and their effects in relation to the present application.
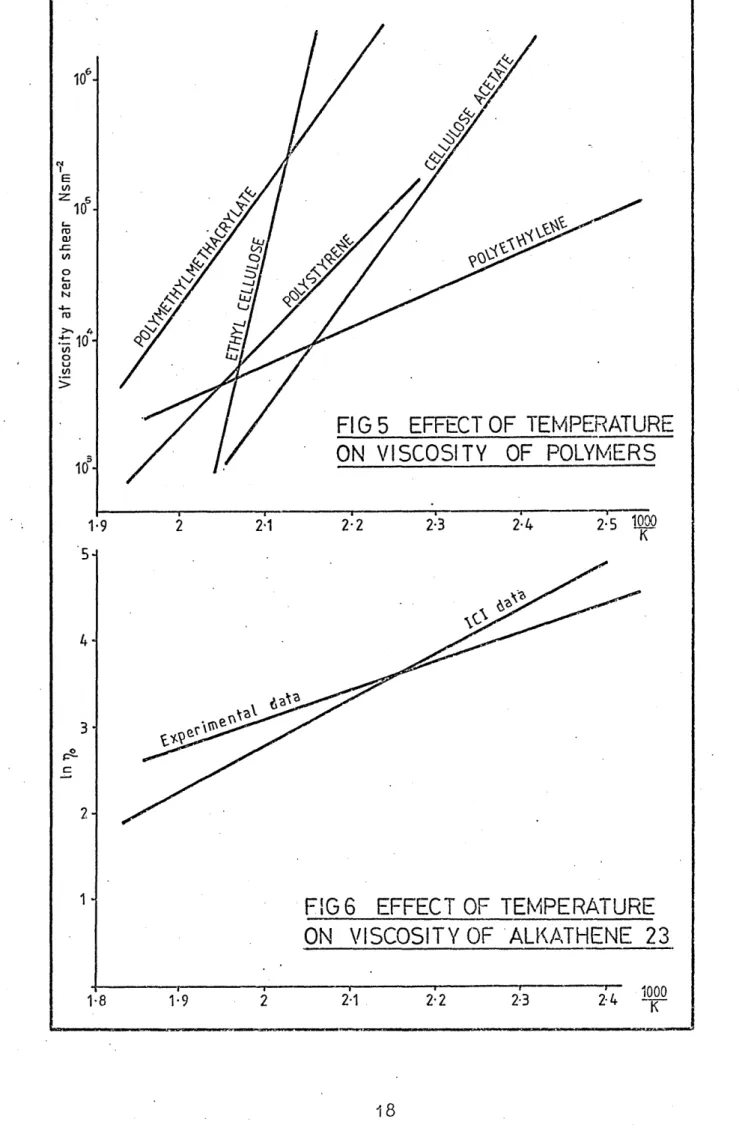
2.2 The Effect of Temperature on Viscosity.
An increase in the temperature of a molten polymer decreases viscosity by varying extents, dependant upon the type of polymer, as shown in Pig 5, The slope of the curve is equivalent to the activation energy for viscous flow. Increases of temperature have a more drastic effect on polymers having a higher activation energy than those with
lower activation energies* Polyethylene, which is the most non-polar of the material’s shown, has a very low activation energy because the forces between the chains are very small* If the curves of viscosity versus the reciprocal of the absolute temperature are plotted over a wider range of absolute
temperature than shown, there.would be a pronounced curvature to the straight line relationship* Dienes12 believed that this is caused by a decrease in the order of the molecules as the temperature is raised (ie. the molecular structure becomes more random). Viscous flow involves configurational
change of the molecules, so that the more random they are, the easier it is to change this configuration. Hence, the energy required for a viscosity change will be less at high temperatures than at low temperatures.
The polymer used for most of the experimental test in the present study was Alkathene WVG- 23 - a low density
polyethylene of 0*913 specific density. Results of
temperature versus viscosity from an extrusion rheometer for this polymer are shown in Pig 6* This curve by itself is not a complete picture since the viscosity measurements refer to zero shear stress. It is necessary with polymer melts to include the effects of shear stress on viscosity together with the effects of changes in temperature.
2.3 The Effects of Shear Stress and Strain on Viscosity.
It is widely accepted that polymer melts exhibit very non-Newtonian flow characteristics. As increasing shear
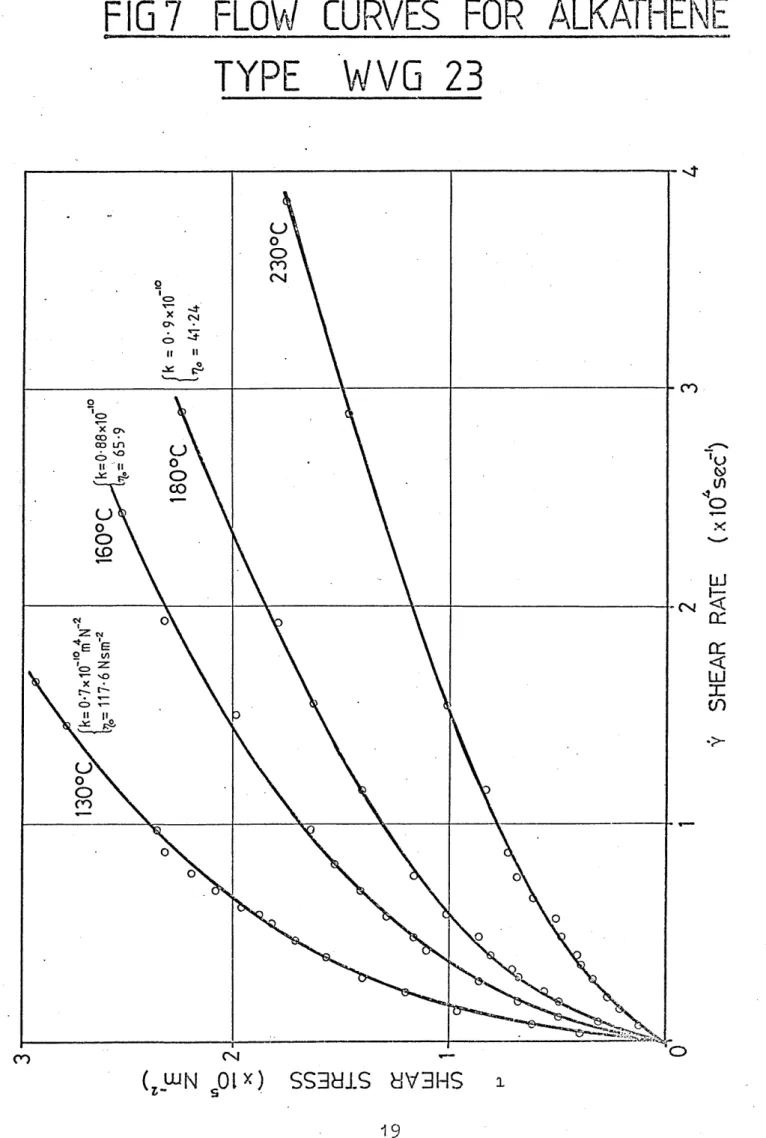
This is "best illustrated in graphical form as shown in Fig 7. This graph shows the results obtained for Alkathene WVG 23 from a capillary rheometer. A non-linear relationship is
seen to exist between shear stress and shear rate (a Newtonian fluid would be a straight line passing through zero). The viscosity of the melt can be obtained from the tangent to the ‘curve at any point. Fig 8 shows the same data drawn in
another form, where viscosity may be read off directly from known temperature and shear stress or shear rate values. (For a Newtonian fluid this curve would be a horizontal straight line).
Certain polymer melts are known to have flow
discontinuities at high shear rates and shear stress values. A critical shear stress value for a polymer may be defined as the one after which flow tends to be irregular.
2.3.1 Critical Shear Stress.
In polymer extrusion:, melt flow instability exhibits itself in many forms such as; a regular helix of wavelength comparable with the diameter, a zig-zag in one plane or irregular convolutions and may finally become fragmented. The terms melt fracture, elastic turbulence and distortion have been used to describe this effect, however, the mechanism
is not similar either to fracture in a solid or to Neyiiolds turbulence.
This phenomenon has been investigated by a number of workers10 18 and there is general agreement on the following
points
a) The instability sets in at a critical value of shear stress ( Ta ) calculated at the die wall; this value is independant of the. die length, radius etc,
b) Ta- bas a value in the region of 105~106 Nm”2for most commercial polymers,
c) Ta does not vary widely with temperature,
d) Many workers13? 15> 1G? 18 found a discontinuity in the
slope of the viscosity-shear stress curve at the critical shear stress, though this has been disputed,
e) The flow defect is often associated with the die inlet although some workers16 have witnessed the occurrence of the same defect, during extrusion from a long cylindrical tube - that is without a die entry.
Several theories have been proposed to account for this defect. First in the field was Nason19 followed by Westover and Maxwell20, all of whom ascribed the effects to conventional turbulence, Hov/ever, Tordella15 demonstrated
that the Reynolds number at the inception of the irregularities were many orders of magnitude lower than the value of 2000
which has been found generally applicable even to non-Newtonian systems. Spencer and Dillon14 pointed out that the melt,
highly orientated in the die capillary, must relax to a distorted state at the die exit and suggested that this caused the buckling of the extrudate. However, cine films of the die entry by Tordella15, Clegg13 and Bagley and Birks21 have shown that extrudate distortion is closely associated
with a disturbance in the flow pattern at the die entry. Later studies by Benbow and Lamb16 showed that the locus of origin of disturbance was at the die wall, where the shear stresses are the highest. They concluded that the melt fracture was caused by the slip-stick action of the melt against the metal die. To date, no conclusive evidence has been submitted to fully identify the mechanism involved and very little theoretical work has been published on the phenomenon.
2.3.2 Sharkskin.
Another defect, often mistakenly called melt fracture, is the surface irregularity called "Sharkskin" or "Mattness" * This is characterised by a series of ridges perpendicular to the flow direction and has been distinguished from melt
fracture for the following reasons
a) Sharkskin has a perpendicular distortion whereas melt - fracture is often helical or irregular.
b) Sharkskin can occur at lower extrusion rates.
c) Sharkskin appears unaffected by die entry and L/D ratio of the die or material of the die. Clegg13 has reported that there was a slight improvement with shorter die land
Sharkskin appears to be a surface effect, one explanation being offered by reference to Fig-9 (after
bution changes in nature so that acceleration of the outer layers occur. For a viscous material, this is not difficult, but where a substantial elastic component is present, tensile forces are built up at or near the surface. Eventually,
these forces exceed the tensile strength of the melt and the surface tears to release the stresses.
2.k The Effect of Pressure on Viscosity.
«
The effect of hydrostatic pressure on the apparent viscosity and other flow properties of polymer melts is not ■as well understood as the effects of temperature and shear
rate. Maxwell and Jung23 demonstrated that the effects of hydrostatic pressure on the apparent viscosity of branched polyethylene and polystyrene at constant shear stress and temperature are appreciable and should not be neglected. Westover10 was able to measure the apparent viscosity of
several polymeric materials between atmospheric pressure and that of 172 MNnr*2 at fixed temperature and shear stress. He showed, for example, that the apparent viscosity of a
polyethylene increased by a factor of five when the hydrostatic pressure was changed from.13 MNm"2 to 172 MNm-2. His
apparatus was .specially designed and was rather complicated and expensive, but Choi24 attempted to measure the effects of pressure on viscosity with much simplified apparatus. His results were comparable with those obtained by other
in pressure of 1000 bar had the same effect on viscosity as that; due to a drop in temperature of 53°C within the melt range.
It had been noted that at very high pressures (above 1 i+O MNrrT2 ) the melt tended to recrystallise^ and in consequence, the melt acted like a solid plug23. For this reason, pressure-viscosity measurements are often conducted at relatively high temperatures.
Since the work carried out by Westover appears to be the most comprehensive, his results are used in the present work to determine the pressure coefficient of viscosity. Fig 10 shows the effects of pressure alone on viscosity. Fig 11 shows how pressure affects viscosity together with
changing shear stress and shear rate.
2.5 The Effects of the Polymer Flow Characteristics,
In the present application the polymer is subjected to very high shear stresses and pressures which are much greater than those capable of being investigated in any existing rheometer. It is believed that the critical shear stress is reached at very low drawing speeds giving a
reduction in coat thickness as speed is increased. The melt flow instability and sharkskin are believed to be possible causes for the bamboo effect present at low drawing speeds. The high pressures generated are believed to have the effect
of increasing the melt viscosity in the Christopherson tube. Temperature was maintained at a steady value when the tests
were conducted, minimising the effects inherent with changing temperature. Tests at different temperatures were conducted to show the effects of such changes. All of the above
effects are discussed in detail in Chapter‘8,
FI G 5 EFFECT OF TEMPERATURE
ON VISCOSITY OF POLYMERS
•9 2-1 2-2 2*3 2-4 2-5 1000'K
FIG 6 EFFECT OF TEMPERATURE
ON VISCOSITY OF ALKATHENE 23
1-9 2-1~r 2-2 2-3 2-4~r 1000"K
FIG 7 FLOW CURVES FOR ALKATHENE
TYPE WVG 23
o
co <N1
o
CO
X os
CO LT>
o 'O u
o
CO
o
CD
sO £ £ C> S—
CJ
o
co
O
CvJ
*-( uun
c s01
x ) SS3HJ.8 UV3HS
CO
1
19
SH
EA
R
RA
TE
(x
IC
fs
ec
FIG 8 ViSCOSiTY VERSUS SHEAR STRESS
FOR ALKATHENE WVG 23
o
o *
Li_l
O
O U
O
00 LO00
~o
(*-WS|s|) AliSODSIA L
o
00
FIG 9 A POSSIBLE MECHANISM OF
SHARKSKIN
AFTER BRYDSON229
20
-o
ri5-i/)
o
t_l/lI
►—4
>
10
-FIG10 PRESSURE VERSUS
. VISCOSITY (0-92 polyethylene-250^0
PRESSURE (x 1 0 Nm
10-1
APPARENT SHEAR RATE ( s " ' )•
CHAPTER 3, DESIGN9 DEVELOPMENT AND CONSTRUCTION OF THE
TEST EQUIPMENT *
The apparatus used in the initial tests was the same one as used by Stevens11. In the light of increasing
experience on this apparatus, various modifications were undertaken to improve both the ease at which readings could be taken and the safety aspect of the draw bench. Further modifications were planned and executed at a later stage in order to investigate the different parameters in more detail. Final modifications to the rig were designed to improve the process itself.
3.1 Description of the Existing Equipment.
The apparatus used for the initial tests was the one designed by Stevens11 for a previous investigation. A full description of this equipment is given below.
The drawing bench, of the bull block type, was powered by a Shraga 3-phase electric motor (type BTH' 18/U.5hp VSC.)
capable of running at speeds infinitely variable between 550 and 2200 revolutions per minute. The power was passed from the motor to the bull block via a flexible tyre coupling
(Fenner F80), a 10:1 reduction worm gear (Croft type if-1/551/05) and a coupling clutch (Broadbent type DP25) which enabled
the bull block to be engaged when the motor was running at the required speed and so enabled a quick build up to full speed. Two interchangable bull blocks, of sizes 305nim
diameter and 100mm diameter, were used, giving a speed range infinitely variable between 0.25 ms"1 to 3.5 ms"1 .
The drawing speed was measured using a tachogenerator (servo products type SA 7^0A/7) connected to a digital
voltmeter. The drawing load was measured hy attaching strain gauges on to the die retaining plate which was designed to flex during drawing. This system was calibrated in situ using static loads to give a direct readout on a Sangmo direct reading transducer meter (type 052). The polymer was heated hy an electric hand heater and the temperature controlled thermostatically to within *3°C of the set
temperature and measured using a thermocouple connected to a digital meter.
The Christopherson tuhe/die unit was designed to allow it to he heated or cooled as experimeirts dictated. The
heater and the controller used were the same as for the
polymer. When cooling was required, a water jacket could he fitted and water circulated from a large tank'using a standard washing machine pump. This enabled the Christopherson tube to he kept as low as 10°C above ambient temperature when separated from the polymer reservoir hy a 6mm asbestos disc.
The components described above were mounted on a suitably stiffened bench of welded steel construction, and all moving parts were adequately guarded.
The Christopherson tube/die unit consisted of a polymer melt reservoir, Christopherson tube and die, held together with three socket headed cap screws as shown in Fig 12. A copper seal was incorporated between the die and the Christopherson tube to prevent leakage. This assembly
THERMOCOUPLE POSITIONS
I
25
was located in a vee on the drawing bench, being retained in the direction of drawing by means of the load plate described previously.
This rig allowed readings of drawing speed, load and temperature to be taken. It was quickly realised that
certain modifications were necessary to improve experimental procedure,
3.2 Modifications to the Experimental rig.
It was impractical with the existing rig to conduct tests on wire longer than four metres since no feed
mechanism was present (the wire was simply laid out on the laboratory floor). The laboratory door had to be kept locked during drawing to stop people inadvertently stepping onto the fast moving wire. Visits to local wire manufacturers and reference to wire journals assisted the design of the feed mechanism.
The objectives of the design
were:-a) To be simple in operation. b) To be inexpensive.
c) To operate at wire speeds of up to 3*5 ms”1 . d) To take up little floor space.
Various types of mechanism were considered. The resulting design appeared to meet all of the objectives at the minimum cost. The wire coil would be placed at the side of the drawring bench, thus using little floor space. A
weighted ring placed over the coil would straighten out and restrain the wire enough-to prevent it 'becoming entangled, .
Guides and a pulley wheel would turn the wire through a right angle so that a horizontal feed to the Christopherson tube could he achieved. Fig 13 and Plates 1 and 2 show the final form of the feed mechanism which worked faultlessly for the majority of the tests.
The addition of an ultra-violet recorder (UV) to the load cell allowed detailed investigations of the variations in drawing load to he undertaken. An extensive series of tests were conducted with the rig in this modified form.
Further modifications became necessary as the tests proceeded. It was decided that the pressure inside the Christopherson tuhe must he measured. This was originally attempted hy using a spring loaded plunger which would he raised hy the melt pressure as shown in Fig 14. This unit was manufactured, hut the fit between the piston and its bore could not he made accurately enough to ensure a perfect
seal without having frictional losses. This method was abandoned in preference to others. The most promising of these appeared to he in the use of commercially available piezo-electric pressure transducers. The maximum pressure that these transducers could measure (5000 bar) precluded the drawing of high strength wires, hut since most of the tests had been conducted on copper, it was decided to
incorporate this method. A. Christopherson tuhe was designed and manufactured to incorporate three pressure transducers
(Kistler type 6203) as shown in Fig 15 and.Plate 3. This method was successful, although the measured pressures were
MODIFIED POLYMER INJECTOR
PNEUMATIC CYLINDERS
WIRE FEED
MECHANISM
■■R0TD3LHI R3MYJOT Q3HIQOM
8R3GMJYD DITAMU3HS
-• 0333 3P1W
M2IMAH33M
moiiMr
iapuftHEATER BAND
/ CHRISTOPHERSON
COOLING JACKET v
\
TUBE/DIE UNIT
o
Q
O
2
—j X c LU X
o
OJ X) LU X _0 Q O— - — I
lu ry
CD XI C l X ~ C J
CH
RI
ST
OP
HE
RS
ON
TU
BE
LU
Q *
m
<
__ i
CL
B5
CQ
O
UJ
bfV
iE
3
>
LlI
C\J
UJ Q
LU d
0Oj XI
LlJ
X X fu XX CJ1 X
3
m K
>
xo
LlI
CHRISTOPHERSON TUBE ASSEMBLY— ^ LARGE BULL BLOCK 300 mm
co
c
i/)
UJ
Od
a
u
_
o
UJ
uo
o
o
o
UJ
2
1
uo
<
r
z
c
L.JUJ
UJUJ
u
„
C
£
o
n
L
D
Li
PL
UN
G
ER
L U
o
:z
OI
— CL in CLin CL
• <
LU
{/)
LU
Ll_ I— CL
UJ
Ol
O
ID
U J
o r
ID
C L
ZD
00
U J
y ~
LL_
OCD
IjU
L
lJ
0 0
o
Q
L D
LL,
SLOT TO ACCEPT WIRES FROM STRAIN GAUGES
to
LUCL
O
to
CC
I—
to
C
C
o
u_
UJ
Q
LULJ
Q
LU
C
C
>
CC
CC
o
LJ
CC
&
o
not as high as was assumed. At this stage of development it was decided to run tests at very slow speeds to investigate further the "bamboo" effect which occurred at the lower
drawing speeds. The small hull block was reduced in size to . 50mm diameter and using an adaptor 100mm diameter, the original
size was retained (see Fig 16 and Plates 4 and 5).
3.3 Hydrostatic Rig.
When tests had been performed under industrial conditions, the wire was unluhricated at start up causing die wear and fracture. It had been assumed that these were a result of the lack of lubrication before the hydrodynamic pressure had been generated. To overcome this, it was decided to-attempt to pressurise the polymer outside the Christopherson tube and feed it into the tube at a pressure sufficient to
cause immediate yielding of the wire at the die. This was to be achieved whilst retaining the hydrodynamic capabilities
of the Christopherson tube. Measurements of pressure had shown the pressure gradient in the tube and estimates of the equipment required could be made. Various considerations v/ere
.examined:-a) Would a seal be necessary on the inlet side? b) How would the polymer be pressurised?
c) What would prevent the polymer from being forced into the compressor once the hydrodynamic pressure had been developed?
d) How would the drawing load be measured?
cz
UJ
UJ
<
oE
E
o
o
o
3
0Q
<
___I>
a m
XI uj y — i ™*
-0 W
> <L
Q >
> Q
X U 2 o
u
(T
U
J
bf
Vi
E
00
UJ
o
§
X
>
— —I
ru
X: U
e
CDL_ L_
c
m o
LU
O
c
QUJ
20
X tz
y uj
y O 5= -< nj c
>
CJa
in
cc
UJ
u
E
in
z
<
CC
UJ
CC
3 in
B
5
CC
e
Ul
£
£
UJ
Q
>-O
u
<c
£
o
(5
Ll.
cd
PL
AT
E
VN
bH
bl
EB
Q y
J d
Oj 3D LjJ
u
c
Q
ru
x
>
X)
LU
X3
c
ru
ru
UJ
3D
I
A-simple calculation showed that a pressure of around 1000 har could he maintained before significant leakage
could occur through the inlet side of the Christopherson tube and so a seal would not be required.
There are two basic methods of pressurising polymer in use in injectors; screw injectors and straightforward compression injectors, A screwr injector would require a motorised drive to caus.e a rotation of the screw and also
some form of direct force to cause it to be driven into the cylinder, A simple injector would only require a direct force, A few enquiries revealed that a simple injector was available in the department for no cost and so it was decided to incorporate this unit into the design. Some method of forcing the piston into the injector cylinder was required. The best way appeared to be either pneumatic or hydraulic, and since compressed air was available, pneumatic power v/as chosen. A choice of air cylinder was now required. This necessitated a knowledge of the pressure required to be
developed by the polymer, It was considered that a pressure of 500 bar injected at a suitable entry point in the Christ-opherson tube should be sufficient for the purposes. Since only5 .5bar (80 psi) was available 011 line, a fairly large pneumatic cylinder was required if 500 bar was to generated directly. (The injector was 25.Anim diameter and would
therefore require a direct force of approximately 2 .5^1- x 104 N or a cylinder of 25^mm diameter (10") for this to be achieved) There were also problems of where to put such a large cylinder since the space 011 the drawing bench was very restricted.
the cylinders had a 150mm (6") stroke and in consequence, were too long to he mounted next to the Christopherson tube. The logical place for these appeared to be below the bench. A simple crank arrangement allowed the injector to be mounted horizontally. Since the two 100mm diameter cylinders were not equivalent to a single 25^mm diameter one, a mechanical advantage of three was required on the crank. This allowed a movement of'50mm at the piston. A few simple calculations were performed to find the required thickness of the crank and the diameter of the pivot pins.
It was realised that the pressure developed hydro-statically would be less than that developed hydrodynamically and that some form of non-return valve would be required to prevent leakage of pressure from the Christopherson tube to the injector, once drawing had commenced. A simple ball valve was designed to be fitted into the Christopherson tube at the injection point.
It v/as not feasible with this new equipment to measure the drawing load by means of the load plate as before since it Y/as necessary to clamp the Christopherson tube. Therefore, a strain gauge bridge was constructed on a specially reduced part of the bull block shaft. This necessitated the use of mercury cell transmitters from the gauges on the rotating
shaft to the recording instruments. The transmitter used was a Yibro-meter Sa type Ij-MTA/T. This unit allowed the speed of rotation of the bull block to be measured by the use of a magnetic sensor fitted into the body of the transmitter. The
output from the gauges was fed, via the transmitter, to the UV recorder and the output from the magnetic sensor passed through an amplifier and then to. a digital counter v/hich,
when calibrated, gave a visual indication of the drawing speed.,
A detail drawing of each component was produced and the equipment was manufactured. No special manufacturing techniques were necessary. A general arrangement drawing of the equipment is shown in Pig 18. Pig 16 shows the modified bull block and Pig 17 shows the new Christopherson tube unit
with non-return valve. Plates 2, k, 6 and 7 show the final
form of the equipment.
/
/
36
II
|K - PRESSURE TRANSDUCER
1 i
rsj AlP CVtJNDEE ^ < L * ; 2 _
s o M u r - M /o _ _ _ _ S ,_ _ _
2 8 DeAW BENCH _ _ _ _ _:
2Q> Ro/ T - M/Ox S5LDN6 &
-2 7 S aa NO. CAP &U?BV X 25u:p .Mf? . 4
-2 o DOW El_3 0 w . /
_ _
2 5 BRACELET M S / 12
24 CHRISTOPHERSON TUBEAS SE/VJELV --- : / II
2 5 SlCT HD CAPSO.SW ' _ 3 r
2 2 'T/C SOD yVi: 5. 2 22
2 / PS ES SURE PLATE MSv / /a
2 0 NU J - MIO — —
/S HEATER BAND — — - / . _ _ _ /B In je c to r Ciu n d e b _ _ _ _ _ _ _ /
_
• /7 COOLING JACKS T BRASS /ICh Sarr.Uo. cap^ Sreav * mTo 2 5 4 .
-/5 P/STON E N 24 / J4
/4 .BRACKET M.S. / 21
. /5
M B
SetT UO.C/\P£c£QtJ X2J5LCr ' - - - _4__ —
/2 BRACKET M 3. / ' 2 0
' / / SOCKET UD. M SC A P xSCfZEAA/^q l* /
_
/O CTLEViS ATS. / IS
8 WASHES (zo. 1id
)
M.S 2 IS8 S E V E R £ N 8 1
n
7 P IN E N 8 2 IQ
6> CYUNDES CQVNECTOR M. S 1 2 2 5 N U T - /" ESS 4
-4
SPLIT PIN _ <54 - _3
.3 WASHER M .S
1
13WASHES ("2SJ id
)
MS. 2 13/
P/M
E N Q / ' IBN ° DESCRIPTION
MAUL
N°OFF D/?S#EYlSfnUOr
OUSVNGr
EXISTING
EVI STING
FIGURE 18 (continued)
MO
TO
R
& ^
UJ ^
El uj
p e
uj
cr c
o
x 3
o •—
PL
AT
E
bfV
lE
A
*
±
y
cu u Q
LlJ
6
K LlJ3D QDO o
y
u
2
CD c: CD
~ 8
c 3
UJ 3 9 9
LlJ 0^ CD :o
C XQ
■H
01
ME
TE
R
FO
R
ST
RA
IN
GA
UG
ES
cr
LU Qcr
8
in
cr
>3
oo
___I
CL
LU
cr
3tQto
UJ
£
cr
e
£
LU
CJ
to
o
cr
C O
LU
>!
L_
- Q LjjX
Q X
8
LU X < c a' L_o
X8
Coo
K X L lI X — !$
LU X cru
CO x X X X3
a>x
yj jj L_ X>
UJ uc:
| y
> >
x x
-H (_jcr
U
J
K
U
J
X
o
X
.<
cr
w
z
3
O
u
o
O
N