Journal of Chemical and Pharmaceutical Research, 2014, 6(3):829-834
Research Article
CODEN(USA) : JCPRC5
ISSN : 0975-7384
Damage analysis on bridge structures of typical rail transit
LI Hai-qing
College of Transportation of Inner Mongolia University, Huhehot, Inner Mongolia Autonomous Region, China
_____________________________________________________________________________________________
ABSTRACT
Seismic damage was the main reason for damage and collapse of structure. One of the development directions of performance-based astigmatic design was to quantize seismic damage and evaluated seismic resistance by damage analysis. This paper expounds the Park-Ang criterion, which is widely used for damage analysis, and its insufficient is pointed out. The modified Park-Ang two-parameter damage evaluation model is used in this paper, two kind of methods are adopted to define damage index. By analysis the damage conditions of typical rail transit bridges under various strength level in Beijing area, it is proved the result of two analysis methods have a good consistency. This paper offers a good reference for aseismatic performance evaluation and design of rail transit bridges.
Key words: Rail transit bridges; ground motion intensity; damage index; aseismatic performance
_____________________________________________________________________________________________
INTRODUCTION
Seismic damage is the main reason for damage and collapse of structure. One of the development directions of performance-based aseismatic design is to quantize seismic damage and evaluate seismic resistance by damage analysis. To be able to identify whether the control member parts has been damaged according to the result of nonlinear dynamic response analysis under seismic ground motion input, over the years, researchers make every efforts to build a criteria, which can distinguish whether a member has been damaged under random inelastic displacement loop, according to the results of tests on different reinforced concrete members in which the members are repeated loaded until being damaged.
several to dozens of times, and much of the loop will make corresponding control component parts entering yield deformation state. Tests show that the damage conditions of reinforced concrete members under this loading are different from the process under static load. It depends on the material cumulative damage degree under loading, including the damage accumulation of concrete and steel bar itself, and the damage accumulation of the effect of bonding and crack interface effect. It is generally believed that the damage cumulative of material itself and the effects of bonding and crack interface effect, including the damage accumulation after entering the state of inelastic, is achieved by two ways: One is when the stress or strain (including sliding) exceeds a certain threshold, the damage will be increased with the force enlarged. if the stress or strain continues to increase, eventually, damage will happen when the damage cumulative surpasses the corresponding degree. Another is in the process of cyclic loading, the stress or strain caused by the damage accumulation is still not enough to cause failure, but damage accumulation will increases with the increase of cycling times, sustained growth of cycles can also lead to the extent of the damage. Therefore, structure damage accumulation in random inelastic deformation cycle caused by earthquake can be regarded as the integrated embodiment of two damage accumulation process.
Structure seismic performance generally includes elastic and inelastic performance (damage performance of structure). The aim of structural seismic design is to prevent structure from damage, especially structure damage under the action of earthquake. Therefore, commonly the seismic performance refers to the damage performance of structure. However, the current seismic design method neglected the low cycle fatigue cumulative damage of structure under intensive earthquake.The single largest deformation checking calculation is difficult to control the damage performance under seismic action. The modified Park-Ang two-parameter damage evaluation model is adopted in this paper. Two kinds of methods are adopted to define damage index. By analysis the damage conditions of typical rail transit bridges under various strength level in Beijing area, this paper offers a good reference for aseismatic performance evaluation and design of rail transit bridges.
DAMAGE INDEX
Park-Ang damage performance evaluation model
Currently, the model used for the bridge structure seismic damage assessment is the cast reinforced concrete structure seismic damage model. It mainly divided into two categories: strength-based damage model and reaction-based damage model. These models require single or multiple damage parameters, such as seismic maximum reaction, plasticity and ductility and cumulative energy consumption, and these parameters are mainly determined by the nonlinear dynamic analysis .Of many damage criterions, the two-parameter damage criterion proposed by Y.J.Park and A,H.S.Ang [8] in 1985 and expressed by the member maximum deformation and cumulative hysteretic energy linear combination is the most widely used. Its form:
m hs cu y cu
x E
DI
x F x
(1) or
m hs
cu y y cu
E DI
F x
(2)
100 0
( 0.447 0.073 0.24 0.314 )0.7 w
t
n
(3)
where: Fy、xy respectively, are yield shear and yield displacement of components ; xcu,μcu respectively ,are ultimate displacement and the ultimate displacement ductility factor of components ; xm、μm respectively, are the maximum reaction displacement and maximum response displacement ductility factor of components ; Ehs, β are cumulative hysteretic energy and energy dissipation factor of members ; t is reinforcement ratio of entire longitudinal steel ;
w
is reinforcement ratio by volume ; is the shear span ratio ; n0 is axis.
The reason why Park-Ang criterion is widely used and thereafter some improved forms are based on it, appears to be due to the following two advantages of the criterion:
(1) The guidelines could have used that time to collect all kinds of component test results do calibration: initially took 261 test results in the subsequent empirical coefficient as important for major revision number of the reference test to 402;
accumulation second way ) caused by the combined effect of the basic rules match.
The modified Park-Ang damage evaluation model
Although the Park-Ang model is widely used, while, Park-Ang model also has obvious theoretical insufficient: (1)in the stage of elastic deformation, when EH=0,DIPA should be 0, while, according to formula (1), DIPA>0;
(2) under the condition of single-direction loading, when the peak deformation was reached, DIPA should be 1, it indicates that the structure is in ultimate state of collapse, while by formula (1), DIPA>1.
In consideration of these insufficient of Park-Ang model, based on responsibility and practicability of engineering, this paper adopts the two-parameter Park-Ang damage evaluation model modified by Jiang hui, Zhu xi et.al[9], the following modified model, which can resolve these questions effectively, is defined:
( )
y H
u y y u y
E DI
F
(4)
( 1) /( u 1) H/ y y( u 1)
DI E F
(5)
Formula (5) are the pattern that shows formula (4) by deformation ductility, in formula (5)the definition of 、δ、δu、
EH、Fy are the same as formula (4),δy is yield deformation,μ、μu are practical deformation ductility and uthe ultimate deformation capacity under monotonic loading. For the confirmation of ultimate deformation capacity under monotonic loading μu,the new Zealand specification requires that [10], the structure should be afford to bear four cycles with horizontal displacement of μuuy,in the same time, the decrease of bearing capacity can not exceeds 20%. In this paper, to make comparison easier, in all calculation, the ultimate deformation ductility under monotonic loading are supposed to be constant.
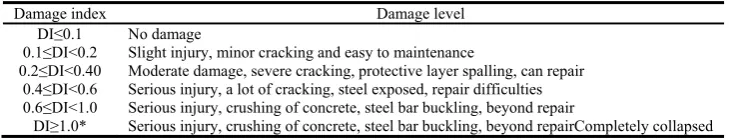
[image:3.595.124.489.457.527.2]To define performance index specifically, firstly, the relationship between damage index and damage scale showed in the following table, which is provided by Hindi and Sexsmith (2001), is used to define specific measurement value of structure under different expected damage performance. It is given according to the RC structure performance distribution under cycling seismic loading.
Table 1 The relationship between damage index and damage provided by Hindi and Sexsmith
Damage index Damage level
DI≤0.1 No damage
0.1≤DI<0.2 Slight injury, minor cracking and easy to maintenance
0.2≤DI<0.40 Moderate damage, severe cracking, protective layer spalling, can repair 0.4≤DI<0.6 Serious injury, a lot of cracking, steel exposed, repair difficulties 0.6≤DI<1.0 Serious injury, crushing of concrete, steel bar buckling, beyond repair
DI≥1.0* Serious injury, crushing of concrete, steel bar buckling, beyond repairCompletely collapsed
In addition, FEMA 273 divided the performance into “Operational (OP)”、“Immediate Occupancy (IO)”、“Life Safety (LS)” and “Collapse Prevention (CP)”four levels. According to decrease value of structure stiffness under each performance level absorbed from engineering experiences and Hybrid structure shaking table test,and by distinguishing the slope variation of IDA curve with this standard, Bu yi, Lv xilin et,al proposed the range of each interval, it is showed in table 2.
Table2 The corresponding performance level of each performance points and slope drop of IDA curve
Performance level Operational Immediate Occupancy Life Safety Collapse Prevention
Performance point OP IO LS CP
slope drop of IDA curve(10%) 10 20 50 80
ENGINEERING CASE outline of bridge
Fig. 1 Size of the section for main box beam
[image:4.595.215.424.585.742.2]Reinforcement of piers are showed in Table 3.
Table 3 Reinforcement of pier cross section
No. Longitudinal ratio of reinforcement(%) The volume ratio of stirrup reinforcement(%)
4# and 7# 1.27 0.28
5# and 6# 1.16 0.36
The choice for the record of surface movement
In this paper, the record used to calculate DI is a wave of California Landers earthquake in 1992. The earthquake is Mw 7.3 earthquake happened in southern California Landers (Landers), the epicenter is located in the southeast of the mojave desert, about 180 km east of Los Angeles, destructive earthquake is very big, the surface rupture length of more than 70 square kilometers.
Time [sec]
60 58 56 54 52 50 48 46 44 42 40 38 36 34 32 30 28 26 24 22 20 18 16 14 12 10 8 6 4 2 0
A
cce
le
ra
tio
n
[
g
]
0.1 0.08 0.06 0.04 0.02 0 -0.02 -0.04 -0.06
Figure 2 the original record of Landers earthquake
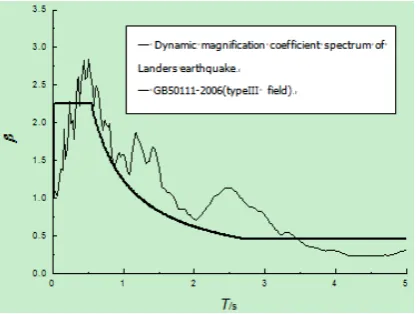
Near the epicenter, Surface dislocation is about 3 m, and in the north of the fault, the dislocation is 6.7 m , after the Flanders earthquake,as many as tens of thousands of aftershocks happened during the following months. The selected seismic record belongs to the typical earthquake records, the moment magnitude 7.3, epicentral distance is 55.7 km, the site predominant period is 0.5 s, PGA is 0.5. as input of seismic records, it is adjusted by spectral acceleration Sa (T1).
From figure 3, the selected dynamic magnification coefficient of seismic record spectrum has better accordance with the specification line. Over the long-periodic, intensity is larger than standard spectral line, explains the selected seismic records belongs to strong earthquake records in soft field.
THE BRIDGE DI CURVE OF URBAN RAIL TRANSIT The results of single pier
Analyze the Yudai river street continuous beam bridge on the Beijing subway Batong line.since the middle piers 5# and 6# suffered greater binding effect,the damage was also more serious under the seismic effect.as shown in Diagram 4a) and b):
a) the DI curve of 5# pier b) the DI curve of 6# pier
Diagram 4 The DI curve of single pier
The calculated results of full-bridge
By weighting the each pier DI value of main bridge of the Yudai River street continuous beam bridge according to DI. We get the continuous bridge DI curve of the whole typical urban rail transit.as shown in Diagram 5.
0.0 0.2 0.4 0.6 0.8 1.0 0.0
0.5 1.0 1.5 2.0 2.5
Sa(T
1)
DI
Diagram 5 The DI curve of full-bridge
From the DI curve shown in Dragram 5 it can be seen , for the DI ≤ 0.1 stage without damage , the corresponding Sa (T1) of the bridge is from 0.0g to 0.4g and the corresponding PGA is from 0.0g to 0.197g; for the 0.1 ≤ DI < 0.2 slight damage stage, the corresponding Sa (T1) of the bridge is from 0.4g to 0.6g and the corresponding PGA is from 0.197g to 0.295g; for the 0.2 ≤ DI <0.40 moderate damage stage , the corresponding Sa (T1) of the bridge is fiom 0.6g to 1.15g and the corresponding PGA is from 0.295g to 0.566g; for the 0.4 ≤ DI <0.6 serious damage stage, the corresponding Sa (T1) of the bridge is from 1.15g to 1.58g together with the the corresponding PGA from 0.566g to 0.778g;The bridge reached the collapsed limit at 1.96g with the corresponding PGA of 0.965g.
The DI value of different property point can be given according to the decline of the slope of the IDA curve shown in Table 2.as shown in Table 4.
0.0 0.2 0.4 0.6 0.8 1.0 1.2 1.4 1.6 1.8 2.0 2.2 2.4 0.0
0.2 0.4 0.6 0.8 1.0
DI
Sa(T1)/g
DI
0.0 0.2 0.4 0.6 0.8 1.0 1.2 1.4 1.6 1.8 2.0 2.2 2.4 0.0
0.2 0.4 0.6 0.8 1.0
DI
Sa(T1)
Table 4 The DI value of each property point
property point OP IO LS CP DI 0.087 0.13 0.47 0.92
Through Table 1 and Table 3 it can be seen , the DI value of the performance point OP is 0.087 , means the structure is in stage without damage ; the DI value of the performance point IO is 0.13 , then the structure is in stage with slight damage ; the DI value of the performance point LS is 0.47 , then the structure is in stage with serious damage difficult to repair; the DI value of the performance point CP is 0.92 , then the structure is in stage with severely damaging beyond repair, and it’s not much differ from the DI value ( 1.0 ) of the collapse limits.
CONCLUSION
The article first elaborated the Park-Ang guideline which was widely used for damage assessment and pointd out its deficiencies. On this basis it used the modified Park-Ang two-parameter damage assessment model as the damage performance evaluation model.The model can solve the shortcoming DIPA>1 in the elastic reaction stage reached the maximum deformation when EH=0, DIPA>0 and the one-way loading condition. The continuous beam bridge model of the typical urban rail transit was established and select a wave of the 1992 Landers earthquake in California for damage assessment, then given the damage curves of the single pier and full-bridge, then selected the damage index and destruction hierarchical relationship given by Hindi and Sexsmith (2001) in Table which were used to define the structure specific metrics under different expected damage performance,then given the DI value of different performance points according to the decline of the curve slope.Through analysis and comparison it can be found that: the structural states analyzed by two methods were in high consistency, one more the urban rail transit continuous bridge with good ductility and under strong earthquake effect with a good seismic performance.
REFERENCES
[1] LUBLINER J, OLIVER J, OLLER S, etal. International Journalof Solids and Structures, v.26, n.3, pp.299-326, 1989.
[2] LEE J, FENVES G L. Journal of Engineering Mechanics, v.124, n.8, pp.892-900, 1998.
[3] BARBAT A H, OLLER S, ONATE E, et a1. International Journal of Solids and Structures, v.34, n.30,
pp.3953-3976, 1997.
[4] HANGANU A D, ONATE E, BARBAT A H. Cornputers and Structures, v.80, n.12, pp.1667-1687, 2002.
[5] TIKH0MIROVD, STEIN E. Computers and Structures, v.79, n.6, pp.2249-2260, 2001.
[6] MARANTE M E, FLOREZ-LOPEZ J. Engineering Structures,v.24, n.5, pp.1141-1152, 2002.
[7] MARANTE M E, FLOREZ-LOPEZ J. International Journal of Solids and Structures, v.40, n.19, pp.5109-5123, 2003.
[8] Y.J. Park, A.H-S. Journal of Structural Engineering, v.111, n.4, pp.722-739, 1985.
[9] Jiang hui. Beijing jiaotong university, 2007.
[10] Standards Association of New Zealand. Wellington, 1992.
[11] Hidi,R.A.,and Sexsmith,R.G.. Earthquake Spectra, v.17, n.2, pp. 261-289, 2001.
[12] FEMA. Washington,1997.