Available online
www.jocpr.com
Journal of Chemical and Pharmaceutical Research, 2014, 6(4):825-833
Research Article
ISSN : 0975-7384
CODEN(USA) : JCPRC5
Process optimization studies of
malachite green
dye adsorption onto
areca husk carbon using response factorial design
A. Basker
1*, P. S. Syed Shabudeen
2, S. Daniel
2and
D. Kalaiselvi
31
Department of Chemistry, Kalaignar Karunanidhi Institute of Technology, Coimbatore, Tamil Nadu (India)
2Department of Chemistry, Kumaraguru College of Technology, Coimbatore, Tamil Nadu (India)
3Department of Chemistry, Sri Shakthi Institute of Engineering and Technology, Coimbatore, Tamil Nadu (India)
____________________________________________________________________________________________
ABSTRACT
In this study, a factorial experimental design technique was used to investigate the adsorption of malachite green (MG) from waste water onto Areca Husk Carbon (AHC). There is a growing interest in using low-cost and commercially available materials for the adsorption of dyes. The main and interaction effects of three different experimentally controlled environmental factors like pH, Particle Size and temperature are investigated through the model equations designed by a factorial design. The experimental factors and their respective levels that were selected include a pH of 4-9, particle size of 100-250 BSS mesh, and a temperature of 300-320 K. The results were analyzed statistically using the t-test, ANOVA, F-test and lack of fit to define most important process variables affecting the percentage MG removal.
Keywords: AHC, Crystal violet, Factorial design, ANOVA.
____________________________________________________________________________________________
INTRODUCTION
Based on the quality of water with reference to the pollution, industries have been classified into three different categories namely orange, red and green. There are seventeen types of industries that have been classified as highly polluting, among which industries of dyes and chemicals are considered one. Since dyes are used in the textile manufacturing, it is imperative that the effluent generated from the textile industry needs to be treated and discharged if not recycled within the industry. The industries have been compelled to install reverse osmosis system, which have become mandatory recently. In view of this, it is quite essential that existing water bodies need to be protected from the effect of pollution. Though the concept of reuse, recycle and reduce have been very well conceived by the industries, efforts in that direction need to be accelerated.
______________________________________________________________________________
methods used for textile effluent treatment of dye containing wastewater. S chemical oxidation [2], photo degradation
investigated to develop a low cost effective metho
Preparation of activated carbon adsorbent
activated by treating with two parts by weight of concentrated sulphuric acid with constant stirring and was kept for 24 hours in a hot air oven at 75oC, the carbonized material was washed well with plenty of water several times to remove excess acid, surface adhered particles, water soluble materials dried at 200
Then it was taken in an iron vessel in muffle furnace an
ground well by using ball mill and then sieved into particle size of 100,150 and 250 BSS Mesh size s tight containers for further use.
Analysis of Malachite green
The concentration of MG in the supernatant solution beam UV spectrophotometer (Shimadzu
[image:2.595.217.375.333.436.2]the activated carbon did not exhibit any absorbance at this wavelength and also that the calibration curve was very reproducible and linear over the concentration range used in
fig. 1.
Batch equilibrium studies
Batch experiments were carried out by shaking glass stopper conical flask at a temperature at 30
Then the dye concentration in the supernatant solution was analyzed using a spectrophotometer by monitoring the absorbance changes at a wavelength of maximum absorbance
pH of 4-9.Each experiment was carried out and average results are presented. Calibration curves standard MG solution using distilled water as a blank.
initial and final concentration of MG
Where C0 and Ce (mg L-1) are the liquid
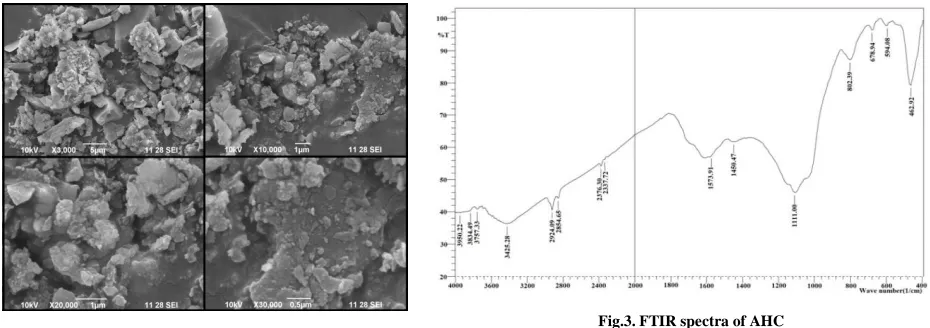
SEM morphology
It is widely used to study the morphological features and surface characteristics of the adsorbent materials. Typical SEM photographs are shown in Fig. 2. It reveals that the AHC has a rough surface with more
structure and it is supported with FTIR spectra as shown in Fig.3.
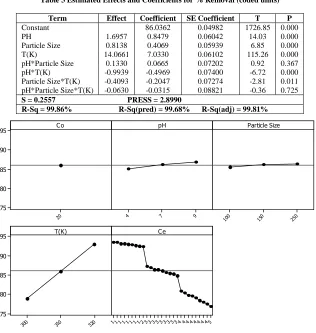
Determination of functional group
The FT-IR spectrum of AHC was detected in the range of 4000 to 400 cm observed at 3425.58cm-1 was assigned to a
______________________________________________________________________________
methods used for textile effluent treatment of dye containing wastewater. Some of them involve reverse osmosis photo degradation [3], electrocoagulation[4] and adsorption
cost effective method of treatment of textile dye.
EXPERIMENTAL SECTION
reparation of activated carbon adsorbent : One part by weight of each powdered raw material was chemically
activated by treating with two parts by weight of concentrated sulphuric acid with constant stirring and was kept for C, the carbonized material was washed well with plenty of water several times to remove excess acid, surface adhered particles, water soluble materials dried at 200oC in hot air oven for 24 hours. Then it was taken in an iron vessel in muffle furnace and the temperature was gradually raised to
ground well by using ball mill and then sieved into particle size of 100,150 and 250 BSS Mesh size s
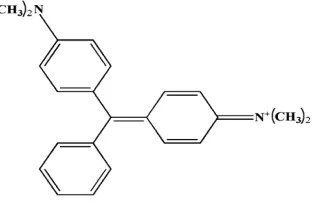
in the supernatant solution before and after adsorption was determined using a double UV spectrophotometer (Shimadzu Japan) at a wavelength of 618 nm. It was found that the supernatant from the activated carbon did not exhibit any absorbance at this wavelength and also that the calibration curve was very reproducible and linear over the concentration range used in this work. The chemical structure o
Fig.1. Chemical structure of Malachite Green
Batch experiments were carried out by shaking 100 ml of dye solution (20 mg L-1) with 150
temperature at 30oC at the rate of 120 rpm. After agitation the solution centrifuged. Then the dye concentration in the supernatant solution was analyzed using a spectrophotometer by monitoring the
ength of maximum absorbance (618nm) in these sorption experiments, the soluti Each experiment was carried out and average results are presented. Calibration curves
solution using distilled water as a blank. Percent removal is calculated from MG.
) are the liquid-phase concentrations of dye at initial and equilibrium respectively.
RESULTS AND DISCUSSION
It is widely used to study the morphological features and surface characteristics of the adsorbent materials. Typical SEM photographs are shown in Fig. 2. It reveals that the AHC has a rough surface with more
rted with FTIR spectra as shown in Fig.3.
Determination of functional group
IR spectrum of AHC was detected in the range of 4000 to 400 cm-1 was presented in Fig.3. The band was assigned to a ν(O-H) stretching vibration. The absorption band at 2854.65 and
______________________________________________________________________________
ome of them involve reverse osmosis [1], and adsorption[5].The present study is
One part by weight of each powdered raw material was chemically activated by treating with two parts by weight of concentrated sulphuric acid with constant stirring and was kept for C, the carbonized material was washed well with plenty of water several times to C in hot air oven for 24 hours. d the temperature was gradually raised to 550oC for an hour, ground well by using ball mill and then sieved into particle size of 100,150 and 250 BSS Mesh size sand kept in air
adsorption was determined using a double nm. It was found that the supernatant from the activated carbon did not exhibit any absorbance at this wavelength and also that the calibration curve was very structure of MG was shown in
with 150 mg of adsorbent in a C at the rate of 120 rpm. After agitation the solution centrifuged. Then the dye concentration in the supernatant solution was analyzed using a spectrophotometer by monitoring the in these sorption experiments, the solution Each experiment was carried out and average results are presented. Calibration curves were obtained with is calculated from the difference between the
l and equilibrium respectively.
It is widely used to study the morphological features and surface characteristics of the adsorbent materials. Typical SEM photographs are shown in Fig. 2. It reveals that the AHC has a rough surface with more porous and caves like
A. Basker et al
______________________________________________________________________________
2924.09cm-1 can be attributed to the stretching vibrations of is bonded with hydrogen bonds. Adsorption bands at 2337.72 The band at 1573.91cm-1 shows the asymmetric
the aromatic ν(C=C) stretching vibration. At 1111.00cm
ν(C-O) stretching vibration of the bonds in ester, ether or phenol groups. The band corresponding to 802.39cm
the fingerprint area indicates a mono substituted aromatic structure. The weak absorption band at 678.94cm corresponds to the ν(O-H) vibration in the benzene ring. The band at 462.92 and 594.08cm
with the in-plane and out-of-plane aromatic ring deformation vibrations common that is quite common for activated carbon.
Fig.2. SEM image of Areca Husk Carbon
The factorial design
The high and low levels defined for the 2
factors were selected according to some preliminary experiments
was measured in each factorial experiment is shown in Table1, with the low (
Table 1. Percentage removal was determined as average of three parallel experiments. The order
experiments were made was randomized to avoid systematic errors. The main effects and interactions between factors were determined [7]. Fig. 4
high levels of, pH, Particle Size and temperature. The results were analyzed and along with the main effects the interactions of different factors were determined. The coded mathematical model for
given as
Where % R is the percentage removal of
and A, B, C stands for pH, Particle Size and temperature
Table 1
Factor Coded
Particle Size
Analysis of variance (ANOVA)
After estimating the main effects, the interacting fac
performing the analysis of variance (ANOVA). Sum of squares (SS) of each factor quantifies its importance in the process and as the value of the SS increases the significance of the corresponding factor in the undergoing process also increases (Table 2). The main and interaction effects of each factor having P values <0.05 are consid potentially significant[8].
J. Chem. Pharm. Res., 2014, 6(4):
______________________________________________________________________________
can be attributed to the stretching vibrations of ν(C-H) bonds in alkane and alkyl groups where carbon
is bonded with hydrogen bonds. Adsorption bands at 2337.72 and 2376.30cm-1 corresponds to shows the asymmetric ν(-COO-) stretching. The band at 1450.47cm
(C=C) stretching vibration. At 1111.00cm-1, the band is highly intense ν(C
O) stretching vibration of the bonds in ester, ether or phenol groups. The band corresponding to 802.39cm the fingerprint area indicates a mono substituted aromatic structure. The weak absorption band at 678.94cm
H) vibration in the benzene ring. The band at 462.92 and 594.08cm
plane aromatic ring deformation vibrations common that is quite common for activated
[image:3.595.62.527.217.381.2]k Carbon
Fig.3. FTIR spectra of AHC
The high and low levels defined for the 23 factorial designs were listed in Table 1. The low and high levels for the factors were selected according to some preliminary experiments [6]. The factorial design matrix and % removal was measured in each factorial experiment is shown in Table1, with the low (−1) and high (+1) levels as specified in
removal was determined as average of three parallel experiments. The order
experiments were made was randomized to avoid systematic errors. The main effects and interactions between . Fig. 4 and 5 illustrates the mean of the experimental results for the respective low and , Particle Size and temperature. The results were analyzed and along with the main effects the interactions of different factors were determined. The coded mathematical model for 2
Where % R is the percentage removal of MG, X0 is the global mean, Xi represents the other regression coefficients
, Particle Size and temperature respectively.
Table 1 Factors and levels used in the factorial design
Factor Coded Symbol Low Level (-1) High Level (+1)
pH A 4 9
Particle Size B 100 250
T(K) C 300 320
After estimating the main effects, the interacting factors affecting the removal of MG
performing the analysis of variance (ANOVA). Sum of squares (SS) of each factor quantifies its importance in the process and as the value of the SS increases the significance of the corresponding factor in the undergoing process
creases (Table 2). The main and interaction effects of each factor having P values <0.05 are consid
J. Chem. Pharm. Res., 2014, 6(4):825-833
______________________________________________________________________________
H) bonds in alkane and alkyl groups where carbon corresponds to ν(N-H) stretching.
) stretching. The band at 1450.47cm-1 may be attributed to , the band is highly intense ν(C-O) and is related to the
O) stretching vibration of the bonds in ester, ether or phenol groups. The band corresponding to 802.39cm-1 in the fingerprint area indicates a mono substituted aromatic structure. The weak absorption band at 678.94cm-1
H) vibration in the benzene ring. The band at 462.92 and 594.08cm-1 which were associated plane aromatic ring deformation vibrations common that is quite common for activated
spectra of AHC
factorial designs were listed in Table 1. The low and high levels for the . The factorial design matrix and % removal −1) and high (+1) levels as specified in removal was determined as average of three parallel experiments. The order in which the experiments were made was randomized to avoid systematic errors. The main effects and interactions between illustrates the mean of the experimental results for the respective low and , Particle Size and temperature. The results were analyzed and along with the main effects the 23 factorial designs can be
represents the other regression coefficients
______________________________________________________________________________
Table 2 Design matrix and the results of the 23 factorial design
Trial No. Coded values of independent variables % Removal
pH Particle Size T(K) Observed Predicted Residual
1 1 1 1 76.85 77.14 0.29
2 1 1 1 78.57 78.64 0.07
3 1 -1 -1 79.21 79.63 0.42
4 -1 -1 1 85.31 85.07 -0.24
5 1 -1 -1 86.42 86.06 -0.36
6 -1 1 -1 86.97 86.72 -0.25
7 -1 -1 1 92.80 92.88 0.08
8 -1 1 -1 93.61 93.65 0.04
Main and interaction effects
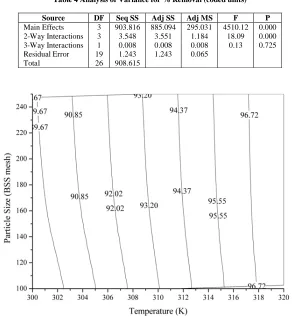
[image:4.595.138.454.374.707.2]The effect of each factor was statistically significant at P < 0.05for AHC [9], the main effects A, B and C and interactions AC and BC are of higher statistical significance. Based on F-ratio and P-value statistically insignificant factors were discarded. Fig. 4 and 5 shows the main effects of the process parameters for the AHC onto MG. The sign of the main effect indicates the directions of the effect. It can be seen from Fig.4 the effect of AC, BC and ABC was characterized by a greater degree of departure and also had a negative effect on the response, whereas the effect of A, B, C and AB the concentration positive effect on the response with greater departure. The significant interactions of MG onto AHC were shown in Fig.5. The interaction plots for MG onto AHC showed that interaction of temperature played major role and also temperature factors interacted strongly with other factors indicating predominant influence in removal. After discarding insignificant terms, the resultant models can be represented as:
Table 3 Estimated Effects and Coefficients for % Removal (coded units)
Term Effect Coefficient SE Coefficient T P
Constant 86.0362 0.04982 1726.85 0.000
PH 1.6957 0.8479 0.06042 14.03 0.000
Particle Size 0.8138 0.4069 0.05939 6.85 0.000
T(K) 14.0661 7.0330 0.06102 115.26 0.000
pH*Particle Size 0.1330 0.0665 0.07202 0.92 0.367
pH*T(K) -0.9939 -0.4969 0.07400 -6.72 0.000
Particle Size*T(K) -0.4093 -0.2047 0.07274 -2.81 0.011 pH*Particle Size*T(K) -0.0630 -0.0315 0.08821 -0.36 0.725 S = 0.2557 PRESS = 2.8990
R-Sq = 99.86% R-Sq(pred) = 99.68% R-Sq(adj) = 99.81%
20
95
90
85
80 75
9 7
4
250 150
100
320 310
300
95
90 85
80
75
5 4 4 4 4 4 4 4 4 3 3 3 3 3 3 3 3 3 2 1 1 1 1 1 1 1 1
C o pH Particle Size
T(K) C e
A. Basker et al
______________________________________________________________________________
9 7 4
C o
pH
Residual plot
In fig. 6a shows the assumption of normality of error terms. In this case we see that most of the points are clustered around blue line indication that the error terms are approximately normal. Thus our assumption of normality is valid. In fig. 6b the error terms against the fitted values. There are approximately half of them are above and half are below the zero line indicating that our assumption of error terms having mean zero is valid. On the same graph we see the clear cyclic pattern among the error terms indicating t
Error terms are not independent. The fig.6d 26
J. Chem. Pharm. Res., 2014, 6(4):
______________________________________________________________________________
9 100 150 250 300 310 320 111111112333333333444444445
P ar ticle Size
T ( K)
C e
Fig.5. Interaction effects plot for % removal
the assumption of normality of error terms. In this case we see that most of the points are clustered around blue line indication that the error terms are approximately normal. Thus our assumption of normality is valid.
the fitted values. There are approximately half of them are above and half are below the zero line indicating that our assumption of error terms having mean zero is valid. On the same graph we see the clear cyclic pattern among the error terms indicating that they are violating the assumption of independence of error.
The fig.6d again re-emphasizes the normality assumption.
Fig.6. Residual plot for % removal
J. Chem. Pharm. Res., 2014, 6(4):825-833
______________________________________________________________________________
5
90
85
80
90
85
80
90
85
80
90
85
80
20 Co
Co Co4
7 9 pH
pH pH 100 150 250 Size Particle
Size Particle 300 310 320 T(K)
the assumption of normality of error terms. In this case we see that most of the points are clustered around blue line indication that the error terms are approximately normal. Thus our assumption of normality is valid. the fitted values. There are approximately half of them are above and half are below the zero line indicating that our assumption of error terms having mean zero is valid. On the same graph we see the hat they are violating the assumption of independence of error. emphasizes the normality assumption. The sample size is just
______________________________________________________________________________
The Pareto chart
The relative importance of the main effects and their interactions was also observed on the Pareto chart (Fig. 7). The t-test was performed to determine whether the calculated effects were significantly different from zero, these values for each effect was shown in the Pareto chart by horizontal columns [10]. For the 95% confidence level and sixteen degrees of freedom, the t-value is 2.1. As shown in Fig. 7, some values are positioned around a reference line, but these values are not significant factors. The values that exceed a reference line, i.e., those corresponding to the 95% confidence interval, are significant values [11]. According to Fig. 7, the main factors (A, B, and C) and their interactions (AC, and BC) that extend beyond the reference line were significant at the level of 0.05.
ABC AB BC AC B A C
120 100
80 60
40 20
0
T
e
rm
Standardized Effect 2.1
A pH B P article S ize C T(K) F actor N ame
Fig.7. Pareto chart of the standardized effects
The temperature represented the most significant effect on % removal. The pH (A), temperature (C) and interaction (BC & AC) had greater effects on % removal. While, except for the interaction effect between AB and ABC have smaller effects and were statistically significant at 95% confidence.
Normal probability plots
It is not clear whether these results are real or chance. To identify the real effects, a normal probability plot is used. One point on the plot is assigned to each effect. According to the normal probability plots, the points which are close to a line fitted to the middle group of points represent those estimated factors that do not demonstrate any significant affect on the response variables. Points far away from the line likely represent the “real” factor effects [12]. The normal probability plot was given in Fig. 8. The main factors (A, B, and C) and their interactions (AC, and BC) are away from the straight line and are therefore considered to be “real”. Because AC and BC lie to the left of the line, their contribution had a negative effect, A, B and C on the right had a positive effect. The temperature (C) had largest effect because its point lies farthest from the line. These results confirm the previous Pareto chart analysis and the values of Table 3.The second important factor is pH (BC), which was more significant than B (particle size).The effects decreased as C>A>B>AC>BC>AB>ABC.
A. Basker et al
______________________________________________________________________________
20 0
99
95
90
80
70 60 50 40 30
20
10
5
1
P
e
rc
e
n
t
BC
A C B
[image:7.595.81.520.76.358.2]A
[image:7.595.148.441.386.705.2]Fig.8. Normal probability plot of standardized effects
Table 4
Source Main Effects 2-Way Interactions 3-Way Interactions Residual Error Total
Fig.9. Response contour plot of MG removal (%) showing interactive effect of Temperature and Particle Size
J. Chem. Pharm. Res., 2014, 6(4):
______________________________________________________________________________
120 100
80 60
40 0
Standardized Effect
C
Fig.8. Normal probability plot of standardized effects
Table 4 Analysis of Variance for % Removal (coded units)
Source DF Seq SS Adj SS Adj MS F P
Main Effects 3 903.816 885.094 295.031 4510.12 0.000 Way Interactions 3 3.548 3.551 1.184 18.09 0.000 Way Interactions 1 0.008 0.008 0.008 0.13 0.725
Error 19 1.243 1.243 0.065
26 908.615
Fig.9. Response contour plot of MG removal (%) showing interactive effect of Temperature and Particle Size
J. Chem. Pharm. Res., 2014, 6(4):825-833
______________________________________________________________________________
A pH B P article S ize C T(K) F actor N ame
Not Significant Significant Effect Type
0.000 0.000 0.725
______________________________________________________________________________
Fig.10. Response contour plot of MG removal (%) showing interactive effect of pH and Temperature
Fig.11. Response contour plot of MG removal (%) showing interactive effect of pH and Particle Size
Contour Plot
A. Basker et al
J. Chem. Pharm. Res., 2014, 6(4):825-833
______________________________________________________________________________
was 4, 7 and 9 (coded value -1 to +1).The results obtained by adapting factorial design in the study of absorption of various dyes on AHC proves; Process temperature has an adverse effect on the response for AHC. Other parameters like particle size and pH affected the process of adsorption significantly. The experimental values and the predicted values of Factorial design model are in close agreement with quadratic regression >99%.
CONCLUSION
The statistical design of the experiments combined with was applied in optimizing the conditions of maximum adsorption of the dye onto AHC. The optimized conditions of pH, Particle size and Temperature with fixed initial concentration of 20 mg L-1 for MG dye adsorption were found as 9, 250 BSS mesh and 320 K, respectively which correspond to 93.6% adsorption. Temperature was the greatest influence on the amounts of dye removal. The factorial design demonstrated significant interaction between pH and temperature. This interaction had more influence on dye removal than did the other interactions (Temperature-Particle size, pH-Particle size).pH, Particle size and temperature had a negative influence on dye removal, is the validity of this study was limited to pH between 4 -9, particle size 100-250 BSS mesh and temperatures between 300 - 320 K.
Acknowledgements
The authors are grateful to Kumaraguru college of Technology for doing the research by providing some of the equipments for the research
REFERENCES
[1]GS Gupta; G Prasad; VN Singh, Water Res., 1990, 24(1), 45-50.
[2]M Neamtu; A Yediler; I Siminiceanu; M Macoveanu; A Kellrup, Dyes and Pigm., 2004, 60(1), 61-68.
[3]RK Wahi; WW Yu; YP Liu; ML Meija; JC Falkner;W Nolte; VL Colvin, J. Molecular Catal. A: Chem., 2005, 242(1-2), 48-56.
[4]Mounir Bennajaha; Yassine Darmaneb; Mohammed Ebn Touhamic; Mostapha Maalmia; Int.J. Engg. Sci. Tech,
2010, 2(12), 42-52.
[5]G McKay; HS Blair; JR Gardner, J. Appl. Polym. Sci., 1982, 27(8), 3043-3057. [6]B Ucar; A Guvenc; U Mehmetoglu, Hydrol Current Res., 2011, 2(2), 1-8. [7]D Kavak, J. Hazard. Mater., 2009, 163(1), 308–314.
[8]K Adinarayana; P Ellaiah; B Srinivasulu; R Bhavani Devi; G Adinarayana, Process Biochemistry, 38(11), 2003, 1565-1572.
[9]NT Abdel Ghani; AK Hegazy; GA El Chaghaby; EC Lima, Desalination, 249(1), 2009, 343–347. [10]V Ponnusami; V Krithika; R Madhuram; SN Srivastava, J. Hazard. Mater. 142(1-2), 2007, 397-403. [11]T Mathialagan; T Viraraghavan, Environ. Technol. 26(5), 2005, 571-579.