International Journal of Emerging Technology and Advanced Engineering
Website: www.ijetae.com (ISSN 2250-2459, ISO 9001:2008 Certified Journal, Volume 3, Issue 8, August 2013)
425
Enhancing Overall Equipment Effectiveness for a
Manufacturing Firm through Total Productive Maintenance
Binoy Boban
1, Jenson Joseph E
2 1PG Student in Production & Industrial Engineering at SCMS School of Engineering and Technology, Kerala, India.
2Assistant Professor, Department of Mechanical Engineering, SCMS School of Engineering and Technology, Kerala, India.
Abstract- Frequent machine breakdowns, low plant availability, increased rejection are a great threat to increase operating cost and lower productivity. The objective of the work is to enhance the overall equipment effectiveness (OEE) at a manufacturing company through the implementation of total productive maintenance (TPM). The company has to suffer due to lower availability of machines as a result of breakdowns. Comparison of OEE between before and after implementation of TPM can provide the much needed force to improve the maintenance policy.
Keywords –TPM, 5S, kaizen, OEE.
I. INTRODUCTION
Effectiveness of equipment plays a major role I modern manufacturing firm to achieve the goal. Total productive maintenance (TPM) is a methodology to increase the availability of the existing equipment hence it reduces the further capital investment. The TPM results in maximum effectiveness of equipment, tidier, and neat and clean work
place. Maintenance [4] has been largely considered as a
support function which is none productive since it does not generate cash directly. However for industry to produce goods of the right quality and quantity for the customers and be able to deliver them at the right time its plant or equipment must operate efficiently and accurately. For every manufacturing company the objective is to produce goods at a profit and this is only achieved by using an effective maintenance system that helps maximize
availability by minimizing machine downtime [6] due to
unwarranted stoppages [2]. Without an effective and
economically viable maintenance system, equipment reliability suffers, and the plant pays the price with poor availability and increased downtime. All these mentioned poor key performance indicators could be a result of poor machine condition and sometimes low employee morale
[7]. Low plant availability and overtime costs will
negatively affect an industry’s operational efficiency. Plant Engineers must therefore design an effective maintenance system for the plant and its equipment.
The aim of this paper is to measure the Overall Equipment Effectiveness (OEE) of the existing plant and there by develop a maintenance policy to enhance the OEE.
II. METHODS AND MATERIALS
The method used for the work is analyzing the present OEE and compare it with world class OEE in manufacturing and thereby develop a maintenance plan to improve the OEE. These are done by collecting the production data’s from company and calculating the OEE in terms of Availability, Performance of machines, and also the quality of the product. In company there are three shifts with each shift of 8hrs. The data collected for the study from January 2013.this study is done in the manufacturing sector at Kerala, India. The values chosen are meant for justifying the research initiatives only The “Table”1 contains the shift data, to be used for a complete OEE calculation.
TABLE I
PRODUCTION DATA BEFORE TPM [6]
Item Data
Shift Length 8 hours * 3shifts = 24 hrs = 1440min 43200min (30days)
Short Breaks Nil
Meal Break Nil
Down Time 172hrs, 10320min( 30days)
Capacity 2.5ton/hrs, 0.042ton/min
Batch size 761.7 ton ( 30days)
Rejected 44 ton (30days)
A.OEE Calculation
Availability (A): Operating time / Planned production time Where,
Planned production time = Shift length – Break time 24 hrs - 0 = 24 hrs (for 1 day)
International Journal of Emerging Technology and Advanced Engineering
Website: www.ijetae.com (ISSN 2250-2459, ISO 9001:2008 Certified Journal, Volume 3, Issue 8, August 2013)
426
Operating time = planned production time – down time 43200 -10320 = 32880min
Availability = 32880 / 43200 = 0.7611
Quality (Q): (Processed amount – Defected amount) Processed amount
= (761.7 -44) / 761.7 = 0.9422
Performance (P) : ( Processed amount / Operating time) Capacity
= [(761.7 / 32800) / 0.042] = 0.552
[image:2.612.69.273.292.412.2]OEE =0.7611 * 0.9422 * 0.552 = 0.3958 = 39.55% ≈ 40%
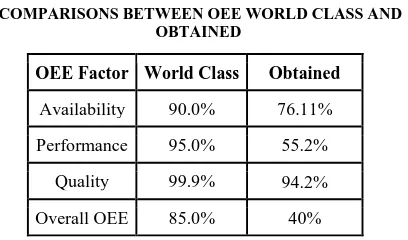
TABLE II
COMPARISONS BETWEEN OEE WORLD CLASS AND OBTAINED
“Table” 2 shows comparison between the actual obtained and world class OEE. If OEE is less than 85% (world class manufacturing performance for continuous
manufacturing industry [5]) it indicates the improvements
are required urgently.
B. TPM Implementation Proposed Plan
The full TPM implementation is done only after the implementation of various pillars of TPM i.e. 5S, Jishu Hozen, Kaizen, Planned Maintenance and OEE have been implemented. A maintenance plan has also been prepared [1] [3]. Here the researcher only discusses the 5S and kaizen among the various pillars.
(i) Selection of Machine
The first step of this work is selection of machines [4]
on which the study is carried out. To start with TPM, a few machines have been selected for implementation of TPM, which is known as TPM model machine. In company, there are three plants. Here from Plant I Cylindrical Grinder (Pulper) selected for TPM implementation. These machines are used for making the raw material to pulp. “Table” 3 shows some of the machines in company.
TABLE III MACHINE SELECTED [6]
Sl No Name of machine
1 Pulper
2 Belt drivers for paper machine
3 Boiler
4 Effluent Treatment Plant
(ii) Implementation of 5S on these Machines
The industrial training during the third semester of researcher course, the researcher had proposed the implementation steps, benefits of implementing the 5S practices in the company. According to that proposal the Company had tried to implement the 5S in the plant I. Here giving the brief introduction.5S are defined as Sort, Set in Order, Shine, Standardize and Sustain. Because each of the five pillars begins with S, this method was appropriately named 5S. These 5S are implemented on TPM model section [5].
5S – Sort: The first pillar of 5S helps to clearly distinguish the items needed in a work area from those no longer needed. In company, various items have been sorted out on the basis of priority of use. Low priority denotes the less frequency of use while high priority shows the items used daily/frequently.
5S - Set In Order: The second pillar of 5S helps to keep the needed items in the correct place to allow for easy and immediate retrieval. The correct place, position, or holder for every tool, item, or material must be chosen carefully in relation to how the work will be performed and who will use them easy identification.
5S – Shine: The third pillar of 5S helps to keep work areas, all work surfaces and equipment clean and free from dirt, debris, oil, etc. in company, all the persons from managers to operators were engaged for cleaning their table, chair and cabin.
5S – Standardize: The fourth pillar of 5S defines the standard activities, procedures, schedules and the persons responsible for keeping the workplace in a clean and
organized manner. In company color-coding and
standardized coloration of surroundings were used for easier visual identification of anomalies in the surroundings
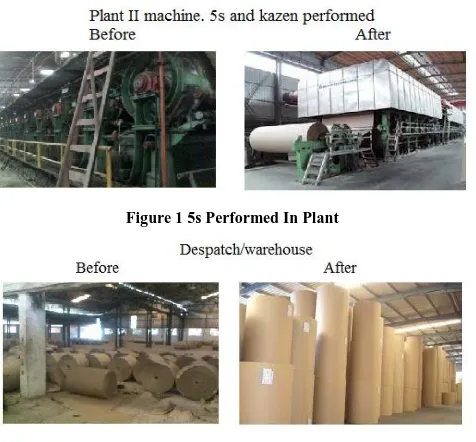
5S – Sustain: Sustain is the last pillar of 5S and drives the organization to be disciplined in maintaining these new standards and procedures and in continuously improving the 5S state of the workplace. The 5S performed on the plant I, II, and dispatch section are shown in “Fig” 2 and 3.
OEE Factor World Class Obtained
Availability 90.0% 76.11%
Performance 95.0% 55.2%
Quality 99.9% 94.2%
International Journal of Emerging Technology and Advanced Engineering
Website: www.ijetae.com (ISSN 2250-2459, ISO 9001:2008 Certified Journal, Volume 3, Issue 8, August 2013)
[image:3.612.52.290.136.357.2]427 Figure 1 5s Performed In Plant
Figure 2 5s Performed At Dispatch Section
(iii) Implementation of Jishu Hozen
Jishu Hozen also called autonomous maintenance [2] is
a team-based approach to maintenance activities. The goal of autonomous maintenance is to prepare operators to do some equipment care independently of the maintenance
staff. Jishu Hozen implementation lays the foundation for
other maintenance activities by establishing the basic conditions for a machine's operation. Various tentative standards for cleaning, inspection and lubrication are set for all machines. These standards are shown in “Table” 4 and 5 respectively. Similarly tentative standards of cleaning, inspection and lubrication are set for different machines.
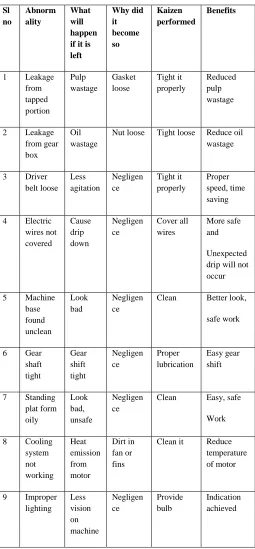
iv) Classification of Abnormalities
After setting up of standards for all machines,
abnormalities [7] are found in all machines, which is noted
during the initial cleanup. “Table” 6 below shows the various abnormalities found in Pulper Machine-I.
Similarly abnormalities for other machines are found.
(v) Implementation of Kaizen
A proper kaizen sheet is filled for each kaizen, which contains all information like before and after photographs, ideas and benefits. So, if any further other modification is suggested then this sheet is very helpful for that. Some of
the Kaizen performed [2] on machines are shown in
“Table” 6. Similarly Kaizen sheets are prepared for other machines.
TABLE IV
STANDARDS FOR INSPECTING PULPER MACHINE [2]
Locatio n
Method of inspecti
on
Standard Time Frequen cy
Action taken if not OK
Cooling fan, cooling
fins
Visual Kept free from dirt
30-40
sec Daily
Remove the dirt
Diver
belt Visual
Tension, wear, seating of
belt
20-30
sec Daily
Correcte d
Electric al insulati
on
Visual Full insulated
20-30sec Weekly
Give proper insulatio
n
Gear
box Noise
Free engageme
nt
20sec Daily
Inform mainten ance
Bearing Noise No noise 20sec Daily
[image:3.612.317.571.157.510.2]Inform mainten ance
TABLE V
STANDARDS FOR LUBRICATING PULPER MACHINE[2]
Sl no
Location Methods of lubrication
Type of lubricant
Quantity Frequency
1 Bearings Manual Grease As required
Monthly
2 Gearbox Manual Oil As required
Quarterly
3 Gear shaft
Manual Grease As required
Weekly
4 Driver pulley
Manual Oil As
required
International Journal of Emerging Technology and Advanced Engineering
Website: www.ijetae.com (ISSN 2250-2459, ISO 9001:2008 Certified Journal, Volume 3, Issue 8, August 2013)
[image:4.612.42.297.155.704.2]428 TABLE VI
ABNORMALITIES FOUND AND KAIZEN PERFORMED [2] [6]
Sl no Abnorm ality What will happen if it is left Why did it become so Kaizen performed Benefits
1 Leakage
from tapped portion Pulp wastage Gasket loose Tight it properly Reduced pulp wastage
2 Leakage
from gear box
Oil wastage
Nut loose Tight loose Reduce oil wastage
3 Driver
belt loose Less agitation Negligen ce Tight it properly Proper speed, time saving
4 Electric
wires not covered Cause drip down Negligen ce Cover all wires More safe and Unexpected drip will not occur
5 Machine
base found unclean Look bad Negligen ce
Clean Better look,
safe work
6 Gear
shaft tight Gear shift tight Negligen ce Proper lubrication Easy gear shift
7 Standing
plat form oily Look bad, unsafe Negligen ce
Clean Easy, safe
Work
8 Cooling
system not working Heat emission from motor Dirt in fan or fins
Clean it Reduce
temperature of motor
9 Improper
lighting Less vision on machine Negligen ce Provide bulb Indication achieved
C . OEE Improvements
This section shows the OEE improvements after the TPM activities. The data after TPM shown in “Table”7
TABLE VII
PRODUCTION DATA AFTER TPM [6]
Item Data
Shift Length 8 hours * 3shifts = 24 hrs = 1440min 43200min (30days)
Short Breaks Nil
Meal Break Nil
Down Time 155hrs, 9300min( 30days)
Capacity 2.5ton/hrs, 0.042ton/min
Batch size 810 ton ( 30days)
Rejected 30 ton (30days)
Availability (A): Operating time / Planned production time
Where,
Planned production time = Shift length – Break time 24 hrs - 0 = 24 hrs (for 1 day)
24 * 30days = 720hrs = 43200min
Operating time = planned production time – down time 43200 -9300 = 33900min
Availability = 33900 / 43200 = 0.7847
Quality (Q): (Processed amount – Defected amount) Processed amount
= (810 -30) / 810 = 0.9629
Performance (P) : ( Processed amount / Operating time) Capacity
= [(810 / 32800) / 0.042] = 0.5879
International Journal of Emerging Technology and Advanced Engineering
Website: www.ijetae.com (ISSN 2250-2459, ISO 9001:2008 Certified Journal, Volume 3, Issue 8, August 2013)
429
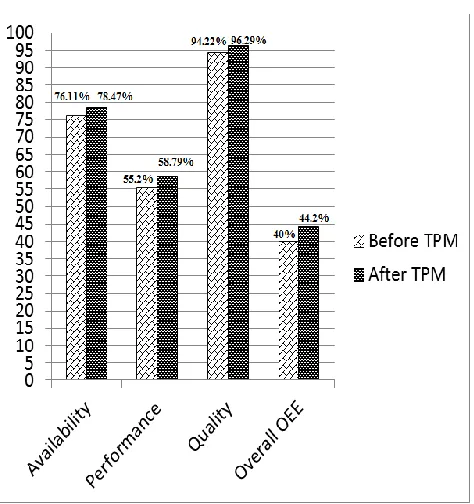
III. RESULT AND DISCUSSIONS
After a small implementation of TPM in company, it is found that the Overall equipment effectiveness is increased by 4%. It should be noted that the change in maintenance policy in the company changed their performance and quality. “Table” 4.1 shows the difference in availability, performance, quality and OEE.
[image:5.612.53.290.299.551.2]A manufacturing facility has been studied and analyzed the Overall Equipment Effectiveness (OEE) before and after TPM implementation. It can be seen that OEE on the plant has shown a progressive growth, which is an indication of increase in equipment availability, decrease in scrap/rejects, and increase in rate of performance.
Figure 3 Oee Before And After Tpm
IV. CONCLUSIONS
So we can concluded that the implementation of TPM in rest of all machines of the company will leads to more equipment effectiveness in the company thereby the can achieve more quality and profit. The results shown above can be much more improved and may reach a world class OEE value (85%) by continuing with TPM.
V. SCOPE FOR FUTURE WORK
Today, with competition in industry at an all time high, TPM may be the only thing that stands between success and total failure for some companies TPM can be adapted to work not only in industrial plants, but also in construction, building maintenance, transportation, and in variety of other situations. Employees must be educated and convinced that TPM is not just another “program of the month” and that management is totally committed to the program and the extended time frame is necessary for full implementation. If everyone involved in a TPM program does his or her part, a usually high rate of return compared to resources invested may be expected. TPM success requires strong and active support from management, clear
organizational goals and objectives for TPM
implementation.
Acknowledgement
The authors would like to thank all of his colleagues for their support in completing the work.
REFERENCES
[1] Aadityachoubey, Study The Initiation Steps Of Total Productivity Maintenance In An Organization And Its Effect In Improvement Of Overall Equipment Efficiency, International journals of engineering research and applications Vol.2, Issue4, July –August 2012, pp.1709- 1713
[2] Amit kumar Gupta, Dr RK Garg OEE improvement by TPM implementation, case study, International journals Of IT, Engineering and applied science research. Vol 1, Issue 1, October 2012
[3] Hemant Singh Rajput, Pratesh Jaswal, A total productive maintenance approach to improve overall equipment efficiency, international journals of modern engineering research, Vol 2 Issue 6 pp 4383-4386
[4] Manu Dogra, Vshial S Sharama, Anish Sachadva, Dureja,TPM-Akey strategy for productivity improvement in process industry, Journals of engineering science and technology, Vol 6, Issue1 January 2011, pp 1-16.
[5] Melesseworkneh, Ajit Pal Singh, Total Productive Maintenance: case study, Global journals of research in engineering. Vol 12, Issue1, February 2012.
[6] OsamaTaisir R.Almeanazel,Total Productive Maintenance Review and Overall Equipment Effectiveness Measurement ,Jordan Journal of Mechanical an Industrial Engineering Volume4 Number 4, September 2010 Pages 517 - 522