International Journal of Emerging Technology and Advanced Engineering
Website: www.ijetae.com (ISSN 2250-2459, Volume 2, Issue 5, May 2012)73
Comparison the various clustering algorithms of weka
tools
Narendra Sharma
1, Aman Bajpai
2, Mr. Ratnesh Litoriya
3 1,2,3 Department of computer science, Jaypee University of Engg. & Technology1
narendra_sharma88@yahoo.com 2 amanbajpai97@gmail.com 3 ratneshlitoriya@yahoo.com
Abstract— Generally, data mining (sometimes called data
or knowledge discovery) is the process of analyzing data from different perspectives and summarizing it into useful information. Data mining software is one of a number of analytical tools for analyzing data. It allows users to analyze data from many different dimensions or angles, categorize it, and summarize the relationships identified. Weka is a data mining tools. It is contain the many machine leaning algorithms. It is provide the facility to classify our data through various algorithms. In this paper we are studying the various clustering algorithms.Cluster analysis or clustering is the task of assigning a set of objects into groups (called clusters) so that the objects in the same cluster are more similar (in some sense or another) to each other than to those in other clusters. Our main aim to show the comparison of the different- different clustering algorithms of weka and find out which algorithm will be most suitable for the users.
Keywords—Data mining algorithms, Weka tools, K-means
algorithms, Clustering methods etc.
I. INTRODUCTION
Data mining is the use of automated data analysis techniques to uncover previously undetected relationships among data items. Data mining often involves the analysis of data stored in a data warehouse. Three of the major data mining techniques are regression, classification and clustering. In this research paper we are working only with the clustering because it is most important process, if we have a very large database. I am using weka tools for clustering.
Clustering is the task of assigning a set of objects into groups (called clusters) so that the objects in the same cluster are more similar (in some sense or another) to each other than to those in other clusters.
Clustering is a main task of explorative data mining, and a common technique for statistical data analysis used in many fields, including machine learning, pattern recognition, image analysis, information retrieval, and bioinformatics. I am using Weka data mining tools for this purpose. It provides a batter interface to the user than compare the other data mining tools.
The main thing, why I am chooses WEKA, because we can work in weka easily without having the deep knowledge of data mining techniques.
II. WHAT IS CLUSTER ANALYSIS?
Cluster analysis[1] groups objects (observations, events) based on the information found in the data describing the objects or their relationships. The goal is that the objects in a group will be similar (or related) to one other and different from (or unrelated to) the objects in other groups. The greater the likeness (or homogeneity) within a group, and the greater the disparity between groups, the ―better‖ or more distinct the clustering.
The definition of what constitutes a cluster is not well defined, and, in many applications clusters are not well separated from one another. Nonetheless, most cluster analysis seeks as a result, a crisp classification of the data into non-overlapping groups.
[image:1.612.358.541.624.698.2]To better understand the difficulty of deciding what constitutes a cluster, consider figures 1a through 1b, which show fifteen points and three different ways that they can be divided into clusters. If we allow clusters to be nested, then the most reasonable interpretation of the structure of these points is that there are two clusters, each of which has three sub clusters. However, the apparent division of the two larger clusters into three sub clusters may simply be an artifact of the human visual system. Finally, it may not be unreasonable to say that the points from four clusters. Thus, we stress once again that the definition of what constitutes a cluster is imprecise, and the best definition depends on the type of data and the desired results.
International Journal of Emerging Technology and Advanced Engineering
Website: www.ijetae.com (ISSN 2250-2459, Volume 2, Issue 5, May 2012) [image:2.612.84.263.136.355.2]74
Figure 1b:two cluster
Figure 1c: final cluster
III. WEKA
Data mining [16] isn't solely the domain of big companies and expensive software. In fact, there's a piece of software that does almost all the same things as these expensive pieces of software the software is called WEKA. WEKA is the product of the University of Waikato (New Zealand) and was first implemented in its modern form in 1997. It uses the GNU General Public License (GPL). The figure of weka is shown in the figure 2.The software is written in the Java™ language and contains a GUI for interacting with data files and producing visual results (think tables and curves). It also has a general API, so you can embed WEKA, like any other library, in our own applications to such things as automated server-side data-mining tasks. I am using the all clustering algorithms of weka for comparison of algorithms, For complete to this purpose I am taking data from two ISBSG and PROMISH data repositories. And study all clustering [5] algorithms of weka classification of data. For working of weka we not need the deep knowledge of data mining that’s reason it is very popular data mining tool. Weka also provides the graphical user interface of the user and provides many facilities [4, 7].
Figure2: front view of weka tools
IV. THE EXPERIMENTER GUI
Often, finding the best learning scheme for a given task is a matter of trial and error. Several techniques will need to be tested with different parameters, and their results analyzed to find the most suitable one. The Experimenter is used to automate this process, it can queue up multiple machine learning algorithms, to be run on multiple data sets and collect statistics on their performance
V. THE KNOWLEDGE FLOW GUI
The Knowledge Flow provides a work flow type environment for Weka. It provides an alternative way of using Weka for those who like to think in terms of data flowing through a system. In addition, this interface can sometimes be more efficient than the Experimenter, as it can be used to perform some tasks on data sets one record at a time without loading the entire set into memory.
VI. DATASET
International Journal of Emerging Technology and Advanced Engineering
Website: www.ijetae.com (ISSN 2250-2459, Volume 2, Issue 5, May 2012)75
VII. METHODOLOGY
My methodology is very simple. I am taking the past project data from the repositories and apply it on the weka. In the weka I am applying different- different clustering algorithms and predict a useful result that will be very helpful for the new users and new researchers.
VIII. PERFORMING CLUSTERING IN WEKA
For performing cluster analysis in weka. I have loaded the data set in weka that is shown in the figure. For the weka the data set should have in the format of CSV or .ARFF file format. If the data set is not in arff format we need to be converting it.
Figure3: load data set in to the weka
After that we have many options shown in the figure. We perform clustering [10] so we click on the cluster button. After that we need to choose which algorithm is applied on the data. It is shown in the figure 4. And then click ok button.
F igure4: various clustering algorithms in weka
IX. COBWEB CLUSTERING ALGORITHM
[image:3.612.332.577.240.440.2]The COBWEB algorithm was developed by machine learning researchers in the 1980s for clustering objects in a object-attribute data set. The COBWEB algorithm yields a clustering dendrogram called classification tree that characterizes each cluster with a probabilistic description. Cobweb generates hierarchical clustering [2], where clusters are described probabilistically.
Figure 5: Cobweb clustering algorithm
Advantages and disadvantages of cobweb
COBWEB uses a heuristic evaluation measure called category utility to guide construction of the tree. It incrementally incorporates objects into a classification tree in order to get the highest category utility. And a new class can be created on the fly, which is one of big difference between COBWEB and K-means methods. COBWEB provides merging and splitting of classes based on category utility, this allows COBWEB to be able to do bidirectional search. For example, a merge can undo a previous split. While for K-means, the clustering [7] is usually unidirectional, which means the cluster of a point is determined by the distance to the cluster centre. It might be very sensitive to the outliers in the data.
International Journal of Emerging Technology and Advanced Engineering
Website: www.ijetae.com (ISSN 2250-2459, Volume 2, Issue 5, May 2012)76
This is especially so when the attributes have a large number of values because the time and space complexities depend not only on the number of attributes, but also on the number of values for each attribute. Furthermore, the classification tree is not height-balanced for skewed input data, which may cause the time and space complexity to degrade dramatically. And K-means methods don't have such issues as considerations of probabilities and independence. It only take into consideration of distance, but this feature also renders them un proper for high dimensional data sets.We can see the result of cobweb clustering algorithm in the result window. Right click on the visualize cluster assignment, a new window is open and result is shown in the form of a Graph. If we want to save the result, just click on the save button. The result will be shown in the form of arff format.
Figure6: Result of cobweb in form of graph
We can be open this result in ms excel and perform various operations and arrange the data in a manner and predict useful information on the data.
X. DBSCANCLUSTERING ALGORITHM
DBSCAN (for density-based spatial clustering of applications with noise) is a data clustering algorithm proposed by Martin Ester, Hans-Peter Kriegel, Jorge Sander and Xiaowei Xu in 1996 It is a density-based clustering algorithm because it finds a number of clusters starting from the estimated density distribution of corresponding nodes. DBSCAN [4] is one of the most common clustering algorithms and also most cited in scientific literature.
OPTICS can be seen as a generalization of DBSCAN to multiple ranges, effectively replacing the parameter
with a maximum search radius. The analysis of dbscane [13] in the weka is shown in the figure.
Figure7: dbscane algorithm
Advantages
1. DBSCAN does not require you to know the number of clusters in the data a priori, as opposed to k-means.
2. DBSCAN can find arbitrarily shaped clusters. It can even find clusters completely surrounded by (but not connected to) a different cluster. Due to the MinPts parameter, the so-called single-link [18] effect (different clusters being connected by a thin line of points) is reduced.
3. DBSCAN has a notion of noise.
4. DBSCAN requires just two parameters and is mostly insensitive to the ordering of the points in the database. (Only points sitting on the edge of two different clusters might swap cluster membership if the ordering of the points is changed, and the cluster assignment is unique only up to isomorphism.
Disadvantages
1. DBSCAN can only result in a good clustering [8] as good as its distance measure is in the function region Query (P, ). The most common distance metric used is the Euclidean distance measure. Especially for high-dimensional data, this distance metric can be rendered almost useless due to the so called "Curse of dimensionality", rendering it hard to find an appropriate value for .
International Journal of Emerging Technology and Advanced Engineering
Website: www.ijetae.com (ISSN 2250-2459, Volume 2, Issue 5, May 2012)77
2. DBSCAN cannot cluster data sets well with largedifferences in densities, since the MinPts-combination cannot be chosen appropriately for all clusters then.
Result of dbscane is shown in form of graph:
Figure8: Result of dbscane algorithms
XI. EM ALGORITHM
EM algorithm [3] is also an important algorithm of data mining. We used this algorithm when we are satisfied the result of k-means methods. an expectation– maximization (EM) algorithm is an iterative method for finding maximum likelihood or maximum a posteriori (MAP) estimates of parameters in statistical models, where the model depends on unobserved latent variables. The EM [11] iteration alternates between performing an expectation (E) step, which computes the expectation of the log-likelihood evaluated using the current estimate for the parameters, and maximization (M) step, which computes parameters maximizing the expected log-likelihood found on the E step. These parameter-estimates are then used to determine the distribution of the latent variables in the next E step.
The result of the cluster analysis is written to a band named class indices. The values in this band indicate the class indices, where a value '0' refers to the first cluster; a value of '1' refers to the second cluster, etc.
The class indices are sorted according to the prior probability associated with cluster, i.e. a class index of '0' refers to the cluster with the highest probability.
Advantages
1. Gives extremely useful result for the real world data set.
2. Use this algorithm when you want to perform a cluster analysis of a small scene or region-of- interest and are not satisfied with the results obtained from the k-means algorithm.
Disadvantage
1. Algorithm is highly complex in nature.
Figure9: EM algorithm
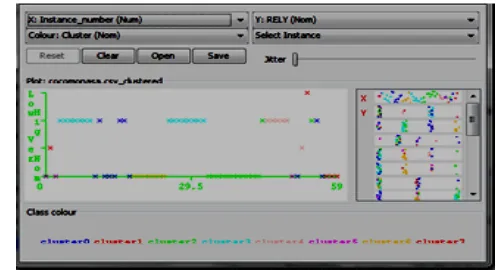
This figure 9 shows that the result of EM algorithm. Next figure show the result of EM algorithm in form of graph. We have seen the various clusters in the different- different colors.
[image:5.612.327.575.539.674.2]International Journal of Emerging Technology and Advanced Engineering
Website: www.ijetae.com (ISSN 2250-2459, Volume 2, Issue 5, May 2012)78
XII. FARTHEST FIRST ALGORITHM
Farthest first is a Variant of K means that places each cluster centre in turn at the point furthest from the existing cluster centers. This point must lie within the data area. This greatly sped up the clustering in most cases since less reassignment and adjustment is needed.
Implements the "Farthest First Traversal Algorithm" by Hochbaum and Shmoys 1985: A best possible heuristic for the k-center problem, Mathematics of Operations Research, 10(2):180-184, as cited by Sanjoy Dasgupta "performance guarantees for hierarchical clustering"[9], colt 2002, sydney works as a fast simple approximate clustered [17] modeled after Simple Means, might be a useful initialize for it Valid options are:
N -Specify the number of clusters to generate.
S -Specify random number seed.
Analysis of data with farthest first algorithms is shown in the figure
Figure11: Farthest fist algorithm
Result of farthest first algorithm is shown in the figure. It is divide the whole data set in two clusters. Each cluster had shown the lowest and higher value of the data sets.
Advantage
Farthest-point heuristic based method has the time complexity O (nk), where n is number of objects in the dataset and k is number of desired clusters. Farthest-point heuristic based method is fast and suitable for large-scale data mining applications.
XIII. OPTICS ALGORITHM
The Ordering Points to Identify the Clustering Structure (OPTICS) [14] algorithm is procedurally identical to that of the previously mentioned DBSCAN.
Thus its algorithm is similar to that shown previous Algorithm, and its time complexity is the same? The OPTICS technique builds upon DBSCAN by introducing values that are stored with each data object; an attempt to overcome the necessity to supply different input parameters. Specifically, these are referred to as the core distance, the smallest epsilon value that makes a data object a core object, and the reach ability-distance, which is a measure of distance between a given object and another. The reach ability-distance is calculated as the greater of either the core-distance of the data object or the Euclidean distance between the data object and another point. These newly introduced distances are used to order the objects within the data set. Clusters are defined based upon the reach ability information and core distances associated with each object; potentially revealing more relevant information about the attributes of each cluster
[image:6.612.325.565.341.491.2]Figure12: Optics algorithms
International Journal of Emerging Technology and Advanced Engineering
Website: www.ijetae.com (ISSN 2250-2459, Volume 2, Issue 5, May 2012)79
This figure shows the result of optics algorithms in tabular form.XIV. K-MEANS CLUSTERING ALGORITHMS
In data mining, k-means clustering [6] is a method of cluster analysis which aims to partition n observations into k clusters in which each observation belongs to the cluster with the nearest mean. This results into a partitioning of the data space into Verona cells.
K-means (Macqueen, 1967) is one of the simplest unsupervised learning algorithms that solve the well known clustering problem. The procedure follows a simple and easy way to classify a given data set through a certain number of clusters (assume k clusters) fixed a priori. The main idea is to define k centroids, one for each cluster. These centroids should be placed in a cunning way because of different location causes different result. So, the better choice is to place them as much as possible far away from each other. The next step is to take each point belonging to a given data set and associate it to the nearest centroid. When no point is pending, the first step is completed and an early group age is done. At this point we need to re-calculate k new centroids as bar centers of the clusters resulting from the previous step. After we have these k new centroids, a new binding has to be done between the same data set points and the nearest new centroid. A loop has been generated. As a result of this loop we may notice that the k centroids change their location step by step until no more changes are done. In other words centroids do not move any more.
The algorithm is composed of the following steps: 1. Place K points into the space represented by the
objects that are being clustered. These points represent initial group centroids.
2. Assign each object to the group that has the closest centroid.
3. When all objects have been assigned, recalculate the positions of the K centroids.
4. Repeat Steps 2 and 3 until the centroids no longer move. This produces a separation of the objects into groups from which the metric to be
minimized can be calculated
.
The problem is computationally difficult (NP-hard), however there are efficient heuristic algorithms that are commonly employed that converge fast to a local optimum. [15] These are usually similar to the expectation-maximization algorithm for mixtures of Gaussian distributions via an iterative refinement approach employed by both algorithms.
[image:7.612.330.570.195.377.2]Additionally, they both use cluster centers to model the data, however k-means clustering tends to find clusters of comparable spatial extent, while the expectation-maximization mechanism allows clusters to have different shapes.
[image:7.612.333.574.399.592.2]Figure:14 k- means clustering algorithms
Figure 15: Result of k-means clustering
This figure show that the result of k-means clustring methods. After that we saved the result, the result will be saved in the ARFF file formate. We also open this file in the ms exel. And sort the data according to clusters.
Advantages to Using this Technique
International Journal of Emerging Technology and Advanced Engineering
Website: www.ijetae.com (ISSN 2250-2459, Volume 2, Issue 5, May 2012)80
K-Means may produce tighter clusters thanhierarchical clustering, especially if the clusters are globular.
Disadvantages to Using this Technique
Difficulty in comparing quality of the clusters produced (e.g. for different initial partitions or values of K affect outcome).
Fixed number of clusters can make it difficult to predict what K should be.
Does not work well with non-globular clusters. Different initial partitions can result in different final clusters. It is helpful to rerun the program using the same as well as different K values, to compare the results achieved
XV. RESULT AND CONCLUSION
In the recent few years data mining techniques covers every area in our life. We are using data mining techniques in mainly in the medical, banking, insurances, education etc. before start working in the with the data mining models, it is very necessary to knowledge of available algorithms. The main aim of this paper to provide a detailed introduction of weka clustering algorithms. Weka is the data mining tools. It is the simplest tool for classify the data various types. It is the first model for provide the graphical user interface of the user. For perform the clustering we used the promise data repository. It is provide the past project data for analysis. With the help of figures we are showing the working of various algorithms used in weka. we are showing advantages and disadvantages of each algorithm. Every algorithm has their own importance and we use them on the behavior of the data, but on the basis of this research we found that k-means clustering algorithm is simplest algorithm as compared to other algorithms. We can’t required deep knowledge of algorithms for working in weka. That’s why weka is more suitable tool for data mining applications. This paper shows only the clustering operations in the weka, we will try to make a complete reference paper of weka.
REFERENCES
[1] Yuni Xia, Bowei Xi ―Conceptual Clustering Categorical Data with Uncertainty‖ Indiana University – Purdue University Indianapolis Indianapolis, IN 46202, USA
[2] Sanjoy Dasgupta ―Performance guarantees for hierarchical clustering‖ Department of Computer Science and Engineering University of California, San Diego
[3] A. P. Dempster; N. M. Laird; D. B. Rubin ―Maximum Likelihood from Incomplete Data via the EM Algorithm‖ Journal of the Royal Statistical Society. Series B (Methodological), Vol. 39, No. 1. (1977), pp.1-38.
[4] Slava Kisilevich, Florian Mansmann, Daniel Keim ―P-DBSCAN: A density based clustering algorithm for exploration and analysis of attractive areas using collections of geo-tagged photos, University of Konstanz
[5] Fei Shao, Yanjiao Cao ―A New Real-time Clustering Algorithm‖ Department of Computer Science and Technology, Chongqing University of Technology Chongqing 400050, China
[6] Jinxin Gao, David B. Hitchcock ―James-Stein Shrinkage to Improve K-meansCluster Analysis‖ University of South Carolina,Department of Statistics November 30, 2009
[7] V. Filkov and S. kiena. Integrating microarray data by consensus clustering. International Journal on Artificial Intelligence Tools, 13(4):863–880, 2004
[8] N. Ailon, M. Charikar, and A. Newman. Aggregating inconsistent information: ranking and clustering. In Proceedings of the thirty-seventh annual ACM Symposium on Theory of Computing, pages 684–693, 2005
[9] E.B Fawlkes and C.L. Mallows. A method for comparing two hierarchical clusterings. Journal of the American Statistical Association, 78:553–584, 1983
[10] M. and Heckerman, D. (February, 1998). An experimental comparison of several clustering and intialization methods. Technical Report MSRTR-98-06, Microsoft Research, Redmond, WA.
[11] Celeux, G. and Govaert, G. (1992). A classification EM algorithm for clustering and two stochastic versions. Computational statistics and data analysis, 14:315–332
[12] Hans-Peter Kriegel, Peer Kröger, Jörg Sander, Arthur Zimek (2011). "Density-based Clustering". WIREs Data Mining and Knowledge Discovery1 (3): 231–240. doi:10.1002/widm.30. [13] Microsoft academic search: most cited data mining articles:
DBSCAN is on rank 24, when accessed on: 4/18/2010
[14] Mihael Ankerst, Markus M. Breunig, Hans-Peter Kriegel, Jörg Sander (1999). "OPTICS: Ordering Points To Identify the Clustering Structure". ACM SIGMOD international conference on Management of data. ACM Press. pp. 49–60.
[15] Z. Huang. "Extensions to the k-means algorithm for clustering large data sets with categorical values". Data Mining and Knowledge Discovery, 2:283–304, 1998.
[16] R. Ng and J. Han. "Efficient and effective clustering method for spatial data mining". In: Proceedings of the 20th VLDB Conference, pages 144-155, Santiago, Chile, 1994.
[17] E. B. Fowlkes & C. L. Mallows (1983), "A Method for Comparing Two Hierarchical Clusterings", Journal of the American Statistical Association 78, 553–569.