RELATIONSHIP BETWEEN DECOMPOSITION LEVEL AND INDUCED SOLIDIFICATION OF PEAT BASED ON LABORATORY INVESTIGATION
JUNITA BINTI ABD RAHMAN
A thesis submitted in
Fulfilment of the requirements for the award of the Degree of Master of Civil Engineering
Faculty of Civil and Environmental Engineering University Tun Hussein Onn Malaysia
ABSTRACT
Over 60 % of Pontian district is covered by peat. Peat is considered as a poor quality soil for construction due to the high moisture content and low bearing capacity. Solidification of peat is important in this area before any construction work could start thus, will increase the population rate in the district. The degree of decomposition affects the porosity of peat while the porosity is affected by both particle size and structure of the peat. The pores between the decomposed materials in peat can be filled and bound using ordinary portland cement (OPC) and coal ash (fly ash, FA and bottom ash, BA). Different decomposition levels of peat require different amounts of filler and binder to achieve the optimum strength. The peats are categorized as fabric for the less decomposed peat, hemic for the moderately decomposed and sapric for the mostly decomposed peat. The Pontian peat has high moisture content with fabric peat having 970 %, hemic peat, 417 % and sapric peat, 720 %. All peat was found acidic with pH 3-4.5 while the binders and filler are in alkaline state. The physico-chemical and mechanical properties of peat were identified according to British (BS 1377, 1990) and US (ASTM, 2000) standards. Chemical tests were adopted from previous researchers to identify the chemical properties. The mixtures of peat-binder-filler were subjected to the unconfined compressive strength (UCS) test, bender element (BE) test and the same chemical tests as applied for the original sample. The mix ratios examined were of four types being 100 % OPC, 50 % OPC 50 % BA, 50 % OPC 25 % BA 25 % FA and 25 % OPC 50 % BA 25 % FA. Two water-binder ratios were used, i.e. 1 and 3. Curing periods of 7, 14, 28 and 56 days were applied for all samples. The moisture content of the peat was controlled at 300 % before mixing. The scanning electron microscope (SEM) result shows that over time, the peat was filled with calcium silicate hydrate (CSH) and calcium aluminate hydrate (CAH) which were products of cement hydration. The strength gain for fabric peat is 157 kPa, while hemic peat, 737 kPa and sapric peat, 121 kPa. It is concluded that regardless the peat decomposition level, the optimum for a peat-binder-filler mixture to get the significant strength, should consist of i) 23 - 34 % of particles, being combination of peat fiber and BA with size ranging from 2 mm to 0.15 mm, ii) OPC with equal amount of dry mass of the peat and iii) 25 % of FA by the total mass of binder. This combination was found to be effective for the peat-binder-filler mixture.
ABSTRAK
Lebih 60 % daripada daerah Pontian adalah terdiri dari tanah gambut. Tanah gambut lazimnya dikenali sebagai tanah yang tidak berkualiti bagi sebarang kerja-kerja binaan disebabkan oleh kandungan lembapan yang sangat tinggi dan kapasiti galas yang rendah. Pemejalan tanah gambut di kawasan ini adalah penting sebelum sebarang kerja-kerja pembinaan boleh dimulakan dimana ia akan meningkatkan tahap populasi di daerah ini. Tahap penguraian tanah gambut memberi kesan kepada tahap keliangan tanah manakala tahap keliangan pula dipengaruhi oleh saiz zarah dan struktur tanah gambut tersebut. Liang-liang diantara bahan yang telah terurai boleh dipenuhi dan diikat menggunakan semen portland biasa (OPC) dan abu arang batu (abu atas, FA dan abu bawah, BA). Tahap penguraian tanah gambut yang berbeza memerlukan jumlah pengisi dan pengikat yang berbeza bagi mencapai kekuatan yang optimum. Tanah gambut dikategorikan sebagai gambut fabrik bagi yang kurang terurai, gambut hemik bagi separa terurai dan gambut saprik bagi yang paling terurai. Tanah gambut Pontian mempunyai kadar kelembapan yang tinggi dengan gambut fabrik 970 %, gambut hemic, 417 % dan gambut saprik, 720 %. Semua jenis gambut didapati berasid dengan pH 3-4.5 sementara pengikat dan pengisi adalah dalam tahap alkali. Sifat fizik-kimia dan mekanikal tanah gambut dikenalpasti berdasarkan standard British (BS 1377, 1990) dan US (ASTM, 2000). Ujian kimia pula diadaptasi dari kajian-kajian terdahulu bagi mengenalpasti sifat-sifat kimia bahan. Campuran tanah gambut-pengikat-pengisi adalah tertakluk kepada ujian kekuatan mampatan tak terkurung (UCS), ujian unsur terbengkok (BE) dan ujian kimia yang sama seperti yang telah dilakukan keatas sampel asal. Terdapat empat nisbah campuran yang diuji iaitu 100 % OPC, 50 % OPC 50 % BA, 50 % OPC 25 % BA 25 % FA dan 25 % OPC 50 % BA 25 % FA. Dua jenis nisbah air-pengikat digunakan iaitu 1 dan 3. Tempoh bertenang 7, 14, 28 dan 56 hari telah diaplikasi pada semua sampel. Kandungan lembapan tanah gambut telah dikawal pada 300 % sebelum pencampuran dibuat. Keputusan dari imbasan mikroskop elektron (SEM) menunjukkan dengan bertambahnya masa, tanah gambut telah diisi dengan calcium silicate hydrate (CSH) dan calcium aluminate hydrate (CAH), dimana ia adalah hasil dari proses penghidratan simen. Kekuatan yang telah dicapai oleh gambut fabrik ialah 157 kPa, gambaut hemik, 737 kPa dan gambut saprik, 121 kPa. Kesimpulannya, bagi sebarang jenis tanah gambut, campuran optimum bagi sebatian gambut-pengikat-pengisi mendapatkan kekuatan yang signifikan mestilah terdiri daripada, i) 23 - 34 % partikel, kombinasi fiber dari tanah gambut dan abu bawah dengan saiz julat dari 2 mm ke 0.15 mm, ii) kuantiti OPC yang sama banyak dengan jisim tanah gambut kering, dan iii) 25 % FA berasaskan jisim keseluruhan sebatian. Kombinasi campuran ini didapati efektif bagi sebatian gambut-pengikat-pengisi.
TABLE OF CONTENTS
TITLE i
DECLARATION ii
DEDICATION iii
ACKNOWLEDGEMENTS iv
ABSTRACT v
TABLE OF CONTENTS vii
LIST OF FIGURES x
LIST OF TABLES xiv
LIST OF SYMBOLS AND ABBREVIATION
xvi
CHAPTER 1 INTRODUCTION 1
1.1 Overview 1
1.2 Background of study 2
1.3 Statement of the problem 4
1.4 Objectives 5
1.5 Scopes of the study 5
1.6 Significance of the study 5
1.7 Organization of the thesis 6
CHAPTER 2 LITERATURE REVIEW 7
2.1 Introduction 7
2.2 Peat soil 7
2.2.1 Definition and review 7
2.2.2 Decomposition level of peat 9
2.3 Peat solidification 13
2.4 Selection of binder 13
2.4.2 Fly ash 18
2.5 Filler 21
2.5.1 Bottom ash 21
2.6 Factors affecting solidification of peat 23 2.7 Relationship between different
decomposition level of peat and binder
25
2.8 Testing for solidified peat 29
CHAPTER 3 MATERIALS AND METHODS 34
3.1 Introduction 34
3.2 Flow of study 35
3.3 Test 36
3.3.1Experimental Procedures 38
3.3.1.1 Physical Properties
Determination
38
3.3.1.2 Chemical Properties Determination
42
3.3.1.3 Engineering properties 48
3.4 Field Sampling 52
3.4.1 Soil sample 52
3.4.2 Binders and filler 56
3.5 Mixing of treated samples 57
3.5.1 Peat 57
3.5.2 Binder and filler preparation 58
3.5.3 Mixing plan 59
3.6 Summary 62
CHAPTER 4 RESULTS AND DISCUSSION 63
4.1 Introduction 63
4.2 Preparing the peat for mixing - controlling the moisture content
63
4.3 Identification of the physico-chemical properties of raw materials
66
4.4 The effectiveness of solidification concept
4.4.1 Strength analysis of solidified peat 69
4.4.2 Solidified peat stiffness 75 4.4.3 Shear wave velocity of solidified
peat
78
4.5 Physico-chemical effect to solidified peat
82
4.5.1 Neutralization concept 83
4.5.2 Microscopic image 87
4.5.3 Chemical composition pre and post solidification
94
4.5.4 Effect of curing days 101
4.6 Establishment of the relationship between decomposition level and the induced solidification of peat
102
CHAPTER 5 CONCLUSIONS AND
RECOMMENDATIONS
107
5.1 Introduction 107
5.2 Conclusions 107
5.3 Recommendations 109
REFERENCES 110
APPENDIX 126
LIST OF FIGURES
FIGURE NO.
TITLE PAGE
1.1 Pontian district 1
1.2 Population at Johor in 20 years: 1991- 2
1.3 Examples of road and building affected by settlement of peat at Pontian on 2013
3
2.1 Peat distributions in the world 8
2.2 Distribution of peat swamp in Malaysia 8
2.3 SEM images of peats 10
2.4 Profile morphology of drained organic soil 11
2.5 Typical XRD pattern of OPC 15
2.6 Simplified illustration of hydration of cement paste 18
2.7 Fly ash 21
2.8 Bottom ash application in US in 2007 22
2.9 Particle size distributions for filler 23
2.10 Unconfined compressive stress- vertical strain relationships of the stabilized peat specimen
27
2.12 Graph showing stress-strain of four materials 29 2.13 The derivation of E0, Ep and E50 from UCS
stress-strain curve
30
2.14 Shear Wave Velocity Data at Sherman Island 31 2.15 Scanning electron micrographs of the (a) untreated
peat, and stabilized peat at (b) 7 (c) 14 and (d) 28 days of curing in water
31
2.16 Scanning electron micrographs of treated peat 32
2.17 XRD pattern of 5 samples over time 32
3.2 Specific Gravity Test: Small Pycnometer method 39
3.3 FESEM instrument 41
3.4 Electronic inverted microscope 41
3.5 pH meter and samples 42
3.6 Completely burnt peat at 450oC 43
3.7 XRF instrument 44
3.8 The Perkin Elmer FTIR spectrometer 46
3.9 Thermogravimetric analysis equipment 47
3.10 Unconfined Compressive Strength test equipment with sample
48
3.11 The pattern of stress-strain curve that indicate the properties of UCS sample prepared
48
3.12 Vane used in this work 49
3.13 Spring used for laboratory vane shear test 49 3.14 Schematic diagram of laboratory vane shear 49
3.15 Laboratory vane shear 50
3.16 Bender element setup 51
3.17 Actual soft-sample 51
3.18 Villagers normally embank up to 2 m to avoid subsidence after some years of housing construction
53
3.19 Road failures due to peat settlement at Pontian 53
3.20 Pontian site 54
3.21 Sample collection 55
3.22 Site layout - plan view 56
3.23 The fly ash is forwarded to ash pool while the land is filled with bottom ash
57
3.24 Fibers that have been taken out from peat sample before mixing process
58
3.25 Labelling of specimen 61
4.1 Specimen of fabric peat with 200 % OPC at moisture content of 805 %
64
4.2 Projection of undrained shear stress versus percentage of OPC
4.3 Peat was dried at 100oC 65
4.4 Dried peat unable to re-absorb water 65
4.5 Peat dried at room temperature 65
4.6 Moisture content versus time taken for controlling the water content of peat using air drying technique
65
4.7 Particle size distributions of peat, binders and filler 67
4.8 qu versus curing days 69
4.9 Unconfined compressive strength versus water to binder ratio
72
4.10 Unconfined compressive stress–vertical strain relationships of the stabilized peat specimens
74
4.11 Young’s modulus (E) - unconfined compressive strength
75
4.12 Modulus strain versus qu 77
4.13 Modulus strain versus qu (Hoo, 2013) 77 4.14 Stress-strain curves for optimum mixture of
solidified fabric peat and solidified clay at D28
77
4.15 Shear wave velocity and unconfined compressive strength, qu versus curing days
78
4.16 Shear wave velocity, vs versus curing days 78 4.17 Particle size distributions of peat and clay 79 4.18 The poor signal received by the H(1)50OPC_50FA
with the specimen size of 38 x 76 mm
80
4.19 The good signal received by the H(1)50OPC_50FA with modified method
80
4.20 qu versus Vs 81
4.21 Process flowchart of peat solidification 82
4.22 pH versus curing days 84
4.23 pH of peat and solidified peat 85
4.24 Vane shear of peat with OPC at D3 86
4.25 SEM of peat-OPC mixture (magnification 2000x, 2 kV)
86
mixture
4.27 H(1)50OPC_25BA_25FA 90
4.28 H(1)_100OPC 90
4.29 Illustration of binding of OPC with organic matter in peat
91
4.30 SEM photos of 10 % OPC at different curing time (Horpibulsuk, 2012)
91
4.31 Bleeding phenomenon due to thyxothropic effect of S(3)_50OPC_50BA at D56
93
4.32 Average penetration for mixture of peat and BA 93 4.33 Mass percentage versus time and heating
temperature
96
4.34 TGA on Pontian peat 97
4.35 TGA on solidified peat 98
4.36 FTIR reading for peat 99
4.37 FTIR reading for solidified peat (optimum formulation)
100
4.38 Moisture content versus curing days 101
4.39 Illustration of fine particles filling porous spaces in BA and peat
102
4.40 Undrained sheer strength versus percentage of binder/ filler in a mixture
104
4.41 FESEM images for peat-binders at D3 104
LIST OF TABLES
TABLE NO.
TITLE PAGE
2.1 General definitions of peat 7
2.2 USDA classification of peat 9
2.3 Degree of Humification of Peat 10
2.4 Physical and chemical properties of peat 12 2.5 Prices comparison of binders and fillers in Malaysia
as year 2010
14
2.6 Main chemical compounds of Portland cement 16
2.7 Hydration reaction of OPC 17
2.8 Typical chemical compounds of Class C and Class F 20 2.9 Influencing parameters to classify fly ash 20 2.10 Comparison of binder and strength gained 28
3.1 List of test description 36
3.2 Common functional groups on FTIR spectra of peat 46 3.3 Height of BE sample for specific UC strength, qu 51
3.4 Peat profile at Pontian site 55
3.5 Mixing portion for peat-binder- filler admixture 60 3.6 Calculation of mixture in peat-binder-filler admixture 61
3.7 Summary of testing 62
4.1 Physico-chemical and engineering properties of peat 66 4.2 Physico-chemical properties of binders and fillers 67
4.3 Deformation and failure patterns 74
4.4 Microscopic images of peat under low magnification 86 4.5 Microscopic images of peat under high magnification 87
4.7 SEM images and qu of solidified peat at D28 with different mixing portion and techniques
90
4.8 XRF analysis on peat, binder and filler 92 4.9 XRF analysis on 3 main oxides in mixture of
solidified peat with different mixing proportion
93
4.10 Explanation of optimum mixture 103
4.11 Calculation of solid content in an optimized mixture based on 100 g of dry peat
LIST OF SYMBOLS AND ABBREVIATION
AASHTO American Association of State Highway and Transportation Officials
Al2O3 aluminium oxide
ASTM American Society for testing and Materials International Standard
BA Bottom ash
BE Bender Element
BS Bristish Standard
C Cement
C2S Dicalcium silicate
C2SHx, C3S2Hx Hydrated calcium silicates
C3A Tricalcium aluminate
C3S Tricalcium silicate
C4AF Tetracalcium aliminofferrite
CaO calcium oxide
CH calcium hydroxide
CILAS Particle Size Analyzer CSH calcium silicate hydrate
Cl Chlorine
Cu Undrained shear strength
Cv Coefficient of consolidation
D Diameter
e Void ratio
Eo Initial Tangent Modulus Ep secant modulus at peak stress
E50 50 % of peak stress
e.g. For example
EDS Energy-dispersive X-ray Spectroscopy
ET ettringite
et al and other people
etc and others
F Fibric peat
FA Fly ash
Fe2O3 feric oxide
FESEM Field Emission Scanning Electron Microscope FTIR Fourier Transform Infrared Spectroscopy
g Gram
Gmax maximum shear modulus
Gs Specific gravity
GWT Ground water table
H Hemic peat
i.e. In other words
i.e. that is
kg Kilogram
kN Kilo Newton
kPa Kilo Pascal
L Length
LL Liquid limit
LOI Loss on ignition
MARDI Malaysia Agricultural Research and Development Institute
Mg Mega gram (1000 kg)
mm Milimeter
MSCS Malaysian Soil Classification System
N Ignition loss
o
C degree celcius
OC Organic content
OPC Ordinary Portland cement
qu Unconfined compressive strength RECESS Research Centre for Soft Soils
SEM Scanning electron microscopy SiO2 silica dioxide
SO3 sulfur dioxide
TGA Thermogravimetric Analysis UCS Unconfined compressive strength USCS unified soil classification systems USDA United States Department of Agriculture UTHM Universiti Tun Hussein Onn Malaysia
vs shear wave velocity
vp compression wave velocity
W (%) percent moisture content
w Water content
w/c Water-cement ratio
wn Natural water content
WS Weight of dry soil
XRF X – Ray fluorescence
CHAPTER 1
INTRODUCTION
1.1 Overview
Over 60 % of Pontian district is covered with peat as shown in Figure 1.1. Figure 1.2 shows that Pontian has least population compared with other towns in Johor. It
[image:16.595.218.410.518.670.2]reflects that peat area is not a preferred inhabitants place due to limitation of the road network and infrastructure. Engineers are reluctant to construct on peat due to challenging accessibility to the sites and other problems related to the unique characteristics of peat. Report from National Audit Department (2011) stated that most projects that have been delayed and reconstructed were due to peat settlement. Hence, it is important to have peat treatment in this area to catalyze the population rate and to avoid unbalanced district population over time i,e, some cities to be more congested compared to the others.
CHAPTER 2
LITERATURE REVIEW
2.1 Introduction
This chapter describes the type of peat soil, binder and filler with its properties. The correlation between all these substances is critically discussed here.
2.2 Peat soil
2.2.1 Definition and review
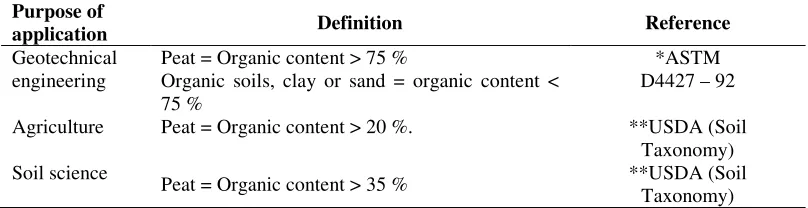
[image:17.595.127.531.613.717.2]Peat is generally referred as cumulative of decomposed plant material but it actually has various definitions, depending on the scope of usage. The standard definitions are as given in Table 2.1:
Table 2.1 General definitions of peat
Purpose of
application Definition Reference
Geotechnical engineering
Peat = Organic content > 75 %
Organic soils, clay or sand = organic content < 75 %
*ASTM D4427 – 92
Agriculture Peat = Organic content > 20 %. **USDA (Soil
Taxonomy) Soil science
Peat = Organic content > 35 % **USDA (Soil
Taxonomy)
*USDA = United States Department of Agriculture
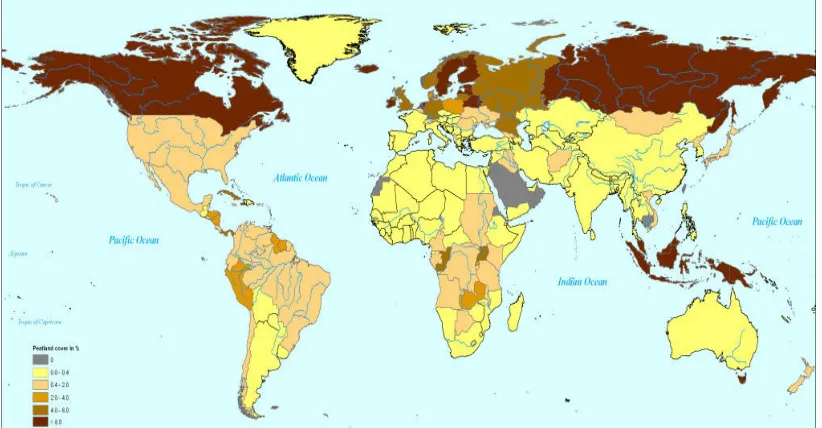
Based on the global chart of total peat deposit around the world, Malaysia is the 9th country with the highest total area of peat soil (Figure 2.1). The total area of
[image:18.595.114.525.178.392.2] [image:18.595.183.456.447.617.2]peat soil in Malaysia is about 2.6 million hectares (26,000 km2), of which 13 % are in Malaysian Peninsular, over 80 % in Sarawak and about 5 % in Sabah as shown in
Figure 2.2 (Leete, 2006).
Figure 2.1 Peat distributions in the world (source: http://www.wetlands.org)
Figure 2.2 Distribution of peat swamp in Malaysia (Leete, 2006)
advanced stages of decomposition, they may not be evident. Peat is an organic soil with organic content of more than 75 % as defined by ASTM D4427 (Table 2.1).
2.2.2 Decomposition level of peat
There are several types of peat classification system for example, United State Department of Agriculture (USDA) (Table 2.2) and Van Post scale (Table 2.3). Both systems are comparable as depicted in Table 2.2. According to Van Post
scale, peat classification is determined based on the appearance of soil water that is extruded when the soil is squeezed by hand. Degree of decomposition (humification) is expressed in terms of a ten-class scale on which higher numbers indicate stronger peat decomposition. The peat classification according to the USDA classification system will be used throughout this thesis.
Table 2.2 USDA classification of peat
Type of peat Fiber content Von Post Scale
Fibric peat Over 66 % H4 or less
Hemic peat 33 - 66 % H5- H6
Sapric peat Less than 33 % H7 and above
The degree of decomposition varies between peat mosses since some plants or some parts of the plants are more resistant than others. Also, the degree of decomposition of peat depends on combination of conditions, such as the chemistry of the water supply, the temperature of the region, aeration and the biochemical stability of the peatforming plant (Huat et al., 2011). These variations make peat possesses wider range of physical properties such as colour, texture, density, specific gravity and water content.
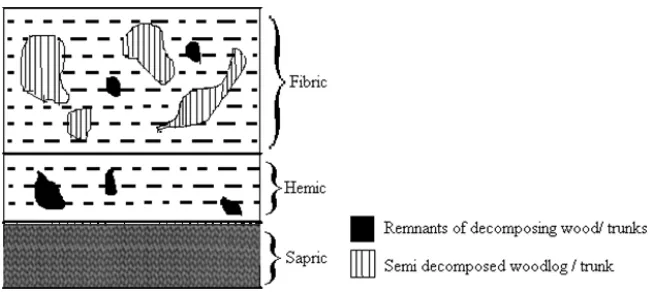
observe this physical variation of peat. The arrangement of particles seen to be relatively loose in fibrous peat compared to the more decomposed peat, for example, sapric as seen in Figure 2.3. The morphology, structure of peat is shown in Figure 2.4. The remnants of logs and woody plant can be seen clearly in fibrous peat but
[image:20.595.120.525.235.641.2]almost absent in sapric peat.
Table 2.3 Degree of Humification of Peat (Von Post and Granlund 1926)
Degree of humification
Description
H1 Completely undecomposed peat which releases almost clear water. Plant remains easily identifiable. No amorphous material present.
H2 Almost completely undecomposed peat which releases clear or yellowish water. Plant remains still easily identifiable. No amorphous material present.
H3 Very slightly decomposed peat which releases muddy brown water but for which no peat passes between the fingers. Plant remains still identifiable and no amorphous material present.
H4 Slightly decomposed peat which, when squeezed, releases very muddy dark water. No peat is passed between the fingers but the plant remains are slightly pasty and have lost some of their identifiable features.
H5 Moderately decomposed peat which, when squeezed, releases very “muddy” water with a very small amount of amorphous granular peat escaping between the fingers. The structure of the plant remains is quite indistinct although it is still possible to recognize certain features. The residue is very pasty.
H6 Moderately decomposed peat which a very indistinct plant structure. When squeezed, about one-third of the peat escapes between the fingers. The structure more distinctly than before squeezing.
H7 Highly decomposed peat. Contains a lot of amorphous material with very faintly recognizable plant structure. When squeezed, about one – half of the peat escapes between the fingers. The water, if any is released, is very dark and almost pasty. H8 Very highly decomposed peat with large quantity of amorphous material with
very indistinct plant structure. When squeezed, about two thirds of the peat escapes between the fingers. A small quantity of pasty water may be released. The plant material remaining in the hand consists of residues such as roots and fibers that resist decomposition.
H9 Practically fully decomposed peat in which there is hardly any recognizable plant structure. When squeezed it is fairly uniform paste.
H10 Completely decomposed peat with no discernible plant structure. When squeezed, all the wet peat escapes between the fingers.
(a) (b) (c)
Figure 2.3 SEM images of peats: (a) fibrous, (b) sapric and (c) hemic (Huat et al.,
[image:20.595.119.525.236.751.2]Figure 2.4 Profile morphology of drained organic soil (Mutalib et al., 1992)
According to Hartford (1993), bulk density of organic soils or peat tends to increase with decomposition. Slightly decomposed organic soils (fibric peat) have larger pore spaces and higher rates of saturated water movement compared to well-decomposed sapric peat which may have hydraulic conductivity rates lower than clay soils (Robert, 1996).
Among three types of peat, namely: fibric, hemic and sapric, fibric or fibrous peat generally has very high natural water content due to its natural water-holding capacity. Soil fabric, characterized by organic coarse particles, holds a considerable amount of water because the course particles are generally very loose, and the organic particle itself is hollow and largely full of water. Previous researches have indicated that high water content of fibrous peat results in high buoyancy and high pore volume leading to low bulk density and low bearing capacity (Huat, 2004; Islam, 2009).
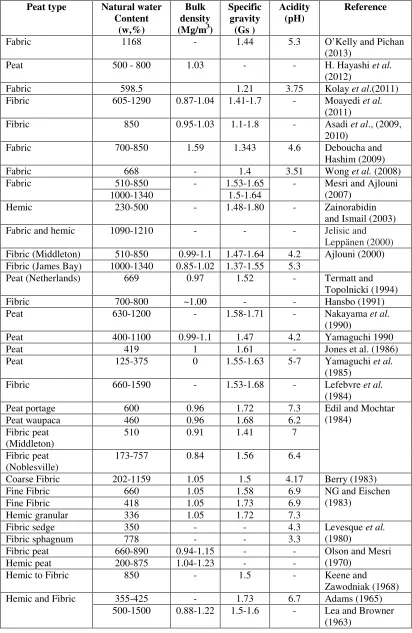
Table 2.4 lists the physical and chemical properties of peat. The comparison
[image:21.595.156.481.69.215.2]Table 2.4 Physical and chemical properties of peat
Peat type Natural water Content
(w,%)
Bulk density (Mg/m3)
Specific gravity (Gs ) Acidity (pH) Reference
Fabric 1168 - 1.44 5.3 O’Kelly and Pichan
(2013)
Peat 500 - 800 1.03 - - H. Hayashi et al.
(2012)
Fabric 598.5 1.21 3.75 Kolay et al.(2011)
Fibric 605-1290 0.87-1.04 1.41-1.7 - Moayedi et al.
(2011)
Fibric 850 0.95-1.03 1.1-1.8 - Asadi et al., (2009,
2010)
Fabric 700-850 1.59 1.343 4.6 Deboucha and
Hashim (2009)
Fabric 668 - 1.4 3.51 Wong et al. (2008)
Fabric 510-850 - 1.53-1.65 - Mesri and Ajlouni
(2007)
1000-1340 1.5-1.64
Hemic 230-500 - 1.48-1.80 - Zainorabidin
and Ismail (2003)
Fabric and hemic 1090-1210 - - - Jelisic and
Leppänen (2000)
Fibric (Middleton) 510-850 0.99-1.1 1.47-1.64 4.2 Ajlouni (2000) Fibric (James Bay) 1000-1340 0.85-1.02 1.37-1.55 5.3
Peat (Netherlands) 669 0.97 1.52 - Termatt and
Topolnicki (1994)
Fibric 700-800 ~1.00 - - Hansbo (1991)
Peat 630-1200 - 1.58-1.71 - Nakayama et al.
(1990)
Peat 400-1100 0.99-1.1 1.47 4.2 Yamaguchi 1990
Peat 419 1 1.61 - Jones et al. (1986)
Peat 125-375 0 1.55-1.63 5-7 Yamaguchi et al.
(1985)
Fibric 660-1590 - 1.53-1.68 - Lefebvre et al.
(1984)
Peat portage 600 0.96 1.72 7.3 Edil and Mochtar
(1984)
Peat waupaca 460 0.96 1.68 6.2
Fibric peat (Middleton)
510 0.91 1.41 7
Fibric peat (Noblesville)
173-757 0.84 1.56 6.4
Coarse Fibric 202-1159 1.05 1.5 4.17 Berry (1983)
Fine Fibric 660 1.05 1.58 6.9 NG and Eischen
(1983)
Fine Fibric 418 1.05 1.73 6.9
Hemic granular 336 1.05 1.72 7.3
Fibric sedge 350 - - 4.3 Levesque et al.
(1980)
Fibric sphagnum 778 - - 3.3
Fibric peat 660-890 0.94-1.15 - - Olson and Mesri
(1970)
Hemic peat 200-875 1.04-1.23 - -
Hemic to Fibric 850 - 1.5 - Keene and
Zawodniak (1968)
Hemic and Fibric 355-425 - 1.73 6.7 Adams (1965)
500-1500 0.88-1.22 1.5-1.6 - Lea and Browner
2.3 Peat solidification
Soft soil stabilization or solidification is a term that refers to treatment of peat where the soil is expected to be strengthened for construction above ground. The challenge in the peat stabilization is on finding the best binder, filler and ratio for the admixture. Several studies on binder and filler for soft soil stabilization have been done for centuries, which include the use of recycle waste product, rice husk and many more. This study is limited to cement and fly ash as binders while bottom ash as filler.
Peat stabilization depends upon the water content; physical, chemical and mineralogical properties; nature and amount of organic content and pH of pore water. Tremblay et al., (2002) reported that the properties of treated organic soils by binder and filler depend not only on the content of the organic matter but also on the nature or the type of the organic matter. The strength gained will also depend upon the decomposition of the organic compound to organic acid due to biological activity. The engineering behaviour of fine-grained soil is mostly influenced by their specific surface area (Santamarina et al., 2002). Kazemian (2011) reported the specific surface area of sapric, hemic and fibrous peat is 93, 69 and 50 m2/g, respectively. As the specific surface of peat increases, a greater surface area is available (sapric peat) for reaction when considered on a unit mass or volume basis. Hence, higher shear strength is obtained when compared with the other two peats, fabric and hemic (Kazemian,2011).
2.4 Selection of binder
Referring to Oxford Dictionary (Soanes, 2008), binder is defined as a substance that used to make other substances or materials stick or mix together. In civil engineering, binder is described as a material which has properties of holding solid particles together to constitute a coherent mass.
stabilized material with improved geotechnical properties. Cement is a hydraulic binder. Interaction of the binder with the soft soil leads to a material which has better engineering properties than the original soil (Hebib and Farrell, 2003).
The cost of the raw materials for binders and filler in this study, would form a significant influence in modeling the construction material. Table 2.5 shows the
[image:24.595.183.441.297.406.2]price of the most common binders and fillers used in peat treatment. Based on financial comparison , OPC, fly ash and bottom ash are still the competitive materials to be used in solidification of peat.
Table 2.5 Prices comparison of binders and fillers in Malaysia as at year 2010
(Kalantari, 2010)
Material Price (RM/m3)
OPC* 23.00
Fly ash - class C 15.20
Fly ash - class F* 0.00
Blast furnace slag 22.70
Sand 6.10
Bottom ash* 0.00
Sodium bentonite 130.40
Steel fiber 56.70
* materials use in this study
2.4.1 Cement
It is generally recognized that peat can be solidified by Ordinary Portland Cement (OPC) (Consoli et al., 2002, Tremblay et al., 2002, Rotta et al., 2003, Rao and Shivananda, 2005 and Ahnberg, 2006). The finer the grain size of cement, the more reactive it will be (Sha'abani and Kalantari, 2012).
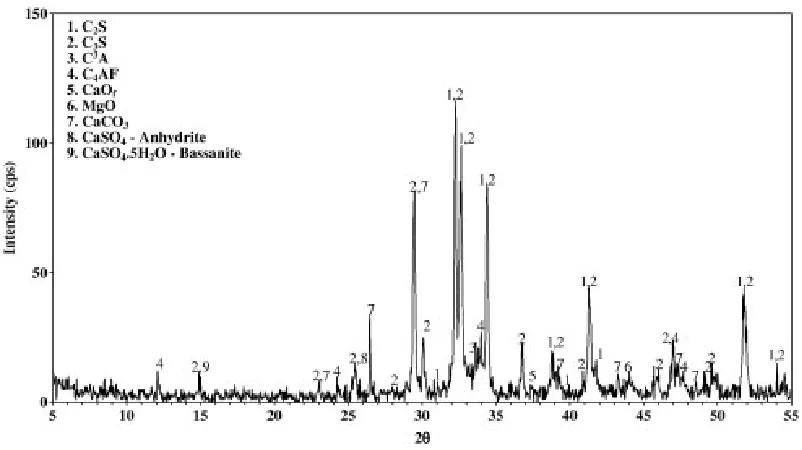
Figure 2.5 shows the XRD analysis of OPC that indicate the presence of
Figure 2.5 Typical XRD pattern of OPC (Tsakiridis et al., 2008)
Bergado et al., (1996) noted that there are two major chemical reactions in cement stabilization namely primary hydration reaction of cement and water, and secondary pozzolanic reaction between cement and soil minerals. The hydration reaction leads to initial gain in strength as the cementation product is formed due to drying up of water. Moreover, pozzolanic reaction, which is also understood as solidification, will harden the soil skeleton with increase in strength over time.
Table 2.6 Main chemical compounds of Portland cement (Jackson, 1996)
The calcium hydroxide is not consumed during the hardening process and is free to react with any minerals present in the soil or even filler. The reaction which takes place in soil-cement stabilizations is presented in equation 2.1 to equation 2.4.
CS + HO CSH (Hydrated gel) + Ca(OH)2 (2.1)
(Primary cementitious product)
Ca(OH)2 Ca2+ + 2(OH)- (2.2)
Ca2+ + 2(OH)- + SiO2 (Soil silica) CSH (2.3) (Secondary cementitious product)
Ca2+ + 2(OH)- + Al2O3 (Soil alumina) CAH (2.4)
(Secondary cementitious product)
Name of compound
Chemical composition
Usual
abbreviation Descriptions
Tricalcium
silicate 3CaO.SiO2 C2S
Hydrates and hardens rapidly and is largely responsible for initial set and early strength. Portland cement with higher percentage of C2S will exhibit higher early strength.
Dicalcium
silicate 2CaO.SiO2 C2S
Hydrates and hardens slowly and is largely responsible for strength increases beyond one week.
Tricalcium
aluminate 3CaO.Al2O3 C3A
Hydrates and hardens the quickest. Liberates a large amount of heat almost immediately and contributes somewhat to early strength. Gypsum is added to portland cement to retard C3A hydration. Without gypsum, C2A hydration would cause portland cement to set almost immediately after adding water.
Tetracalcium aliminoferrite
4CaO.Al2O3
Fe2O3 C4AF
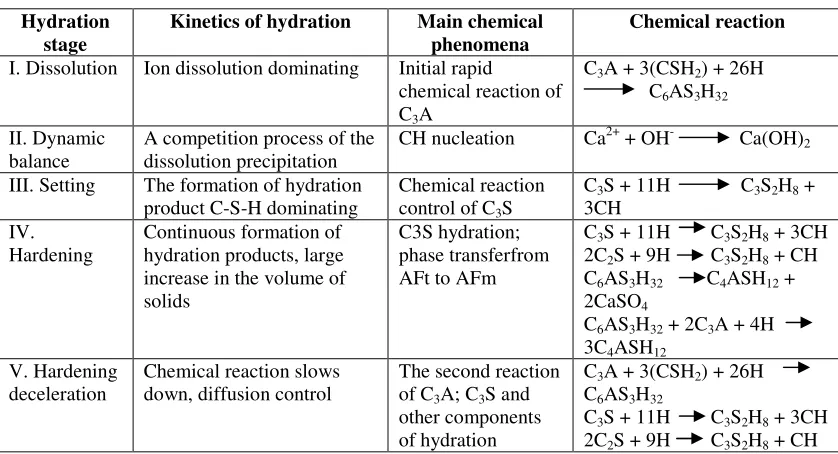
The cement hydration and pozzolanic reaction can last for months, or even years, after mixing. Thus, the strength of cement-treated soil tends to increase with time as long as the reactions still occur. The hydration of portland cement is rather more complex than that of the individual constituent minerals. A simplified illustration of the development of hydrate structure in cement paste is given in
[image:27.595.109.528.253.480.2]Figure 2.6 and the detail of hydration reaction is presented in Table 2.7.
Table 2.7 Hydration reaction of OPC (Xiao and Li, 2009)
Hydration stage
Kinetics of hydration Main chemical phenomena
Chemical reaction
I. Dissolution Ion dissolution dominating Initial rapid
chemical reaction of C3A
C3A + 3(CSH2) + 26H C6AS3H32
II. Dynamic balance
A competition process of the dissolution precipitation
CH nucleation Ca2+ + OH- Ca(OH)2
III. Setting The formation of hydration product C-S-H dominating
Chemical reaction control of C3S
C3S + 11H C3S2H8 + 3CH
IV. Hardening
Continuous formation of hydration products, large increase in the volume of solids
C3S hydration; phase transferfrom AFt to AFm
C3S + 11H C3S2H8 + 3CH 2C2S + 9H C3S2H8 + CH C6AS3H32 C4ASH12 + 2CaSO4
C6AS3H32 + 2C3A + 4H 3C4ASH12
V. Hardening deceleration
Chemical reaction slows down, diffusion control
The second reaction of C3A; C3S and other components of hydration
C3A + 3(CSH2) + 26H C6AS3H32
C3S + 11H C3S2H8 + 3CH 2C2S + 9H C3S2H8 + CH
Figure 2.6 Simplified illustration of hydration of cement paste (Newman, 2003)
2.4.2 Fly Ash
Pozzolan is a material that contains siliceous or siliceous and aluminous material which, in itself, possesses little or no cementitious value. With the presence of water, pozzolan will react chemically with calcium hydroxide at room temperature to form compounds possessing cementitious properties (Mehta, 1987). Small amount of secondary pozzolanic materials is added to the admixture to promote secondary pozzolanic reactions. This is the reason of the long term strength gain of the cemented soil. In this study, fly ash (Figure 2.7) was used as the secondary
Fly ash is a by-product from the burning of coal in thermal power stations. It is the non-combustible portion of coal that is collected at the combustion chamber. The particles themselves are spherical and smooth with the size ranging from 0.5 µm to 300 µm which is finer than cement particles. Fly ash is one of the component in cement that have the characteristics to reduces permeability, greater corrosion resistance, substantially higher fire resistance (up to 2400° F), high compressive and tensile strengths, a rapid strength gain, and lower shrinkage. This translates to higher durability of cement.
There are two types of fly ash which are Class C and Class F. Class C fly ash exhibits considerable true cohesive strength due to cementitious reactions. Due to this property, self-cementing ash could define as a very economical stabilization agent, for a wide range of application. When exposure to water, Class C fly ash reacts with water immediately and hydrates forming cementitious products that are similar to those produced during the hydration of Portland cement. Type C fly ash exhibits self hardening when mixed with water due to its higher calcium content (Collins, 1988).
McLaren & DiGioia (1987) reported the shear strength of fly ash. Class F fly ash is a frictional material, its shear strength is mainly derived from friction between particles. According to the ASTM C618, the classification of the fly ash is based on the specified major element oxide content (Mattigod et al., 1990). Class F fly ash must contain at least 70 % sum of SiO2, Al2O3 and Fe2O3 and it normally produced by Bituminous or Anthracite Coal which has low CaO. For the Class C fly ash, sum of SiO2, Al2O3 and Fe2O3 is less than 70 % but more than 50 % and commonly generated from the combustion of Lignite or Sub-bituminous coal with a high CaO.
Hydration properties of a fly ash depend on some factors including the coals source, boiler design, and type of ash collection system. The coal source controls the amount and type of inorganic matter present in the coal, thus dominating the chemical composition of the ash. Bituminous coals and some lignite coals have low calcium contents. The ash (Class F fly ash,) which is produced from bituminous coals and some lignite coals contain rarely amount of calcium.
2002).The comparison between chemical composition of class C fly ash and class F fly ash is shown in Table 2.8. The amount of calcium compounds are higher in
[image:30.595.111.525.278.373.2]Sub-bituminous coals and the ashes produced through combustion of these coals typically contain from 20 to 35 % calcium oxide, as determined by ASTM C - 311 (sampling and testing fly Ash or Natural Pozzolans for Use as a Mineral Admixture in Portland Cement Concrete). Addition of fly ash in this study is to understand the secondary pozzolanic effect and the correlation with the solidification of peat.
Table 2.8 Typical chemical compounds of Class C and Class F (Halstead, 1986)
Chemical Compound Class C Class F
SiO2 39.9 54.9
Al2O3 16.7 25.8
Fe2O3 5.8 6.9
CaO 24.3 8.7
MgO 4.6 1.8
SO3 3.3 0.6
Na2O & K2O 1.3 0.6
The most influencing factor that divide these two classes of fly ashes are their amount of calcium, silica (SiO2), alumina (Al2O3), and iron contents (Fe2O3) among other factors. Some of the most influential parameters that divide the two types of fly ashes are shown in Table 2.9.
Table 2.9 Influencing parameters to classify fly ash (Samsuri 1997)
Properties Fly ash class
F C
Sio2 + Al2O3 + Fe2O3, min, % 70 50
SO3, max, % 5.0 5.0
Moisture content, max, % 3.0 3.0
Loss on ignition, max, % 6.0 6.0
Past researches show that addition of fly ash in cement, or lime when mixed with mineral soils can improve the performance of the final product (Sukumar et al.
[image:30.595.155.481.522.593.2]Figure 2.7 Fly ash
2.5 Filler
Fillers are used to increase the amount of solid particles in wet peat forthe binder to join. Practically, the filler produce insignificant chemical reactions in cement hydrolysis due to the large size of the particles but it enhance the strength of the cemented peat by increasing the contact surface areas for the cementation bonds to form, thereby producing a stabilized soil structure. In addition, the filler reduces void ratio of cemented peat by filling the spaces within the loose peat during the cementation process. Economically, it is feasible to reduce the cost of peat stabilization by including the filler into the cemented peat.
Peat normally requires big quantities of stabilizer or binder. This is because peat contains fewer solid particles to stabilize. Since it is the solid particles that provide structure, a greater quantity of binder need to be added. Moreover, peat has considerably high water content, which is usually not less than 200%. The large amount of water in the soil implies larger voids, requiring more binder. Filler is introduced to lessen the amount of binder needed in filling the void in peat during soil stabilization (Wong, 2008).
2.5.1 Bottom ash
(Environmental Quality Act) (Rashid et al. 2010). The low density of bottom ash, around 700 kg/m3 creates a lighter product. The usage of bottom ash is still an ongoing study but a few industries found it is effective to use bottom ash in their sector as reported in Figure 2.8.
The main components of the bottom ash are glass, magnetic metals, minerals, synthetic ceramics, paramagnetic metals and unburned organic matter. The 4–25 mm size fraction (Figure 2.9) accounts for approximately 50 % of the bottom ash weight
and comprises mainly of glass. 50 % of the glass fraction consists of synthetic ceramics 26 % and minerals 8 %, and it is suitable as secondary building materials or for glass recycling industry. Magnetic metals, 1–6 mm particle in size accumulate 6 % of this fraction (Chimenos,1999).
[image:32.595.134.502.423.721.2]The main chemical element in bottom ash consists of SiO2, Al2O3, CaO and Fe2O3, which are the essential pozzolanic oxide compounds with the total of 92.64 %. Such an indication confirms the suitability of bottom ash as a natural pozzolan due to the sum of the oxide compounds exceeds 70% as recommended by ASTM C 618 Standard (Billong et al., 2009).
Figure 2.8 Bottom ash application in US in 2007 (source: American Coal Ash
Association, ACAA) Structural Fills Embarkments 46.6% Cement-Raw Feed for Clinker 11.0% Road Base Subbase Pavement 9.7% Miscelaneous Other 8.1% Aggregate 7.7% Concrete, Concrete Products, Grout 7.1%
Snow and Ice Control 4.0% Soil Modification Stabilization 2.2% Waste Stabilization Solidification 1.3%
Blast Grit, Roofing Granules
1.0%
Mining Applications
1.0%
Mineral Filler in Asphalt
0.2%
Figure 2.9
2.6 Factors affecting solidification of
The study of soil and cement interaction normally
Clay as inorganic soils reacts with cement nicely and form ettringite as product of hydration process. This ettringite is the reason why the solidified clay strong and stiff. However, the solidification of peat is more challenging th
inherent variability and the tendency of humic acids to hinder the hydration processes and related reactions required for the development of
solidification (Axelsson Peat consists
macromolecules collectively known as humic substance, that contribute to odour, taste, as well as acidity in
substances represent one of the most chemicall
their high surface area, and surface charge, and thus have a critical influence on the chemical and physical properties of soils
low pH of peat in the presence of
if it is to be stabilized by ordinary Portland cement. This is possible due to the fact that the acid tends to react with calcium liberated from cement hydrolysis to form insoluble calcium humic acid making it difficult for calcium c
calcium crystallization
Islam, 2008; Chen and Wang,
9 Particle size distributions for filler (Chimenos, 1999)
ffecting solidification of peat
The study of soil and cement interaction normally use clay as the benchmark. Clay as inorganic soils reacts with cement nicely and form ettringite as product of hydration process. This ettringite is the reason why the solidified clay strong and stiff. However, the solidification of peat is more challenging than clay, given their inherent variability and the tendency of humic acids to hinder the hydration processes and related reactions required for the development of
(Axelsson et al., 2002).
s of organic matter, some of which are complex aromatic macromolecules collectively known as humic substance, that contribute to odour, taste, as well as acidity in water supply (Fong and Mohamed,
substances represent one of the most chemically reactive fractions
their high surface area, and surface charge, and thus have a critical influence on the d physical properties of soils (Santagata et al., 2008).
low pH of peat in the presence of humic acid tend to interrupt the hydration process, if it is to be stabilized by ordinary Portland cement. This is possible due to the fact that the acid tends to react with calcium liberated from cement hydrolysis to form insoluble calcium humic acid making it difficult for calcium c
calcium crystallization product would strenghten the cemented ; Chen and Wang, 2005).
Particle size distributions for filler (Chimenos, 1999)
clay as the benchmark. Clay as inorganic soils reacts with cement nicely and form ettringite as product of hydration process. This ettringite is the reason why the solidified clay strong and an clay, given their inherent variability and the tendency of humic acids to hinder the hydration processes and related reactions required for the development of strength following
O'kelly and Pichan (2014) stated that addition of more FA produced a progressively stronger alkaline blend which would inhibit growth of the microorganisms and microbial activity. However, Mitchell and Santamarina (2005) stated that microorganisms generally have very rapid rates of generation, mutation and natural selection, which allows very fast adaptation and extraordinary biodiversity to develop under ideal environments. This probability provides the possibility that microorganism in the solidified peat is re-activated after sometime. Thus, it secretes chemicals that digest organic matter into fragments (Hobbs, 1986; Pankratov et al., 2011). Nevertheless, the microbial population and activity in peat material have hardly been explored and are less understood.
Peat usually requires larger stabilizer quantities, because they contain few solids to stabilize.Therefore, more stabilizers are required to bind the particles together (Kalantari, 2010). The high water content in peat gives a higher water/total-cementitious ratio and which in turn lower the strength. The quantity of binder for soils with high organic content must exceed a certain threshold before any stabilization is obtained. A possible reason for this threshold effect possibly due to sufficient binder added to neutralize the humic acids (Janz and Johansson, 2002).
The quantity of natural fiber in peat gives a significant role in peat solidification. Kalantari (2010) induced polypropylene fiber in hemic and sapric peat. Hemic peat, as moderately decomposed consist of 33 - 66 % of fiber. The presence of polypropylene fiber in hemic peat, improves its strength for about 600 %. Dehghanbanadaki et al. (2013) use well graded sand, poorly graded gravel, coarse poorly graded sand and fine poorly graded sand as filler to fibric peat. The strength increased from 17 kPa to 178 kPa as the highest reading shown amongst the samples. However, certain trend shown that too much of filler in solidified peat, reduced its strength. The peat was found increasing it strength at dosage of filler 75 - 122 kg/m3 but started to decline at filler dosage of 125 - 150 kg/m3. It was somehow indicated that maximum allowable quantity of filler should be added for peat solidification.
REFERENCES
Abd Rahman, J. and Chan, C.M. (2013). Influence of Temperature on the Mass Losses of Tropical Peat at Different Decomposition Level. Soft soil Engineering International Confrence 2013. Sarawak.
Abd Rahman, J. and Chan, C.M. (2014). A preliminary study of the threshold limit for cementation of peat at different decomposition levels. Zaytoonah University International Engineering Conference on Design and Innovation in Sustainability 2014 (ZEC Infrastructure 2014). Amman, Jordan.
Abd Rahman, J. and Chan, C.M. (2014). Effect of Additive to the Moisture Content at Different Decomposition Level of Peat. Journal of Civil Engineering Research 2014, 4(3A). 59-62.
Abdul Rahman, I. Memon, A. H., Nagapan, S. Bux, Q., Latif, A. I. and Abdul Azis, A. A. (2012). Time and Cost Performance of Costruction Projects in Southern and Cenrtal Regions of Penisular Malaysia. IEEE Colloquium on Humanities, Science & Engineering Research (CHUSER 2012), Malaysia. 52-57.
Adon, R., Bakar, I., Wijeyesekera, D. C., & Zainorabidin, A. (2013). Overview of
the Sustainable Uses of Peat Soil in Malaysia with Some Relevant
Geotechnical Assessments. International Journal of Integrated Engineering,
4(3).
Ahnberg, H. (2006). Consolidation stress effects on the strength of stabilised Swedish soils. Ground Improvement, 10(1): 1-13. Digital Object Identifier (DOI): 10.1680/grim.2006.10.1.1.
Ahnberg, H. and Bengtsson, P.E. (2005) Shear wave velocity and shear strength relation for binder-mixed soil – preliminary results from a laboratory study. Vattenbyggaren, No. 4, pp. 46–51 (in Swedish).
Ahnberg, H. and Holmen, M. (2008). Assessment of stabilized soil strength with geophysical methods. Ground Improvement. Volume 164 Issue GI3. 109-116. Akol, A. K.(2012). Stabilization of peat soil using lime as a stabilizer. Project
dissertation .Civil Engineering Programme Universiti Teknologi PETRONAS. Alawode, O. and Idowu, O. I. (2011). Effects of Water-Cement Ratios on the
Mixes. The Pacific Journal of Science and Technology. Volume 12. Number 2. 99-105.
Ali, F., Wong, L. S. and Hashim, R. (2010). Engineering properties of improved fibrous peat. Scientific Research and Essay Vol. 5 (2). 154-169.
Alwi, A. (2008). Ground improvement of Malaysian peat soils using stabilized peat column techniques. PhD thesis, University of Malaya, Kuala Lumpur, Malaysia.
American Society of Testing Materials (ASTM) (2000). Annual Book of ASTM Standards, Section four: Construction, vol. 04.08.
Andriesse, J.P. (1988). Nature and Management of Tropical Peat Soils. FAO Soils Bulletin 59, Rome.
Annual Book of ASTM Standards. (2000). ASTM D 2974: Standard Test Method for Moisture, Ash, and Organic Matter of Peat and other Organic Soils. USA: Philadelphia.
Annual Books of ASTM Standards. (1994). ASTM C 618: Specification for Coal Fly Ash and Raw or Calcined Natural Pozzolanic for Use as A Mineral Admixture
in Portland Cement Concrete. USA: Philadelphia.
Annual Books of ASTM Standards. (1996). ASTM D 1997-91: Standard Test Method for Laboratory Determination of the Fiber Content of Peat Samples by Dry
Mass. USA: Philadelphia.
ASTM D2976-71. Standard Test Method for pH of Peat Materials. American Society for Testing and Materials. West Conshohocken,PA. 317-318.
ASTM D4427-07. (2007). Standard Classification of Peat Samples by Laboratory Testing. D 4427-92. ASTM International. Retrieved on March 23, 2013 from
http://www.astm.org/Standards/D4427.htm.
Axelsson, K., Johansson, Sven-Erick. and Anderson, R. 2002. Stabilization of organic soils by cement and pozzolanic reaction-feasability study. Swedish Deep Stabilization Research Centre, Report 3, 1–51.
Barbosa, N. R. and Overstreet, C. (2010). What Is Soil Electrical Conductivity? LSU AgCenter Pub. 3185. 1-4.
Barrière, J., Oth, A., Schenkluhn, R., Krein, A.(2013). Joint Analysis of seismograms and hydroacoustic data for bedload transport monitoring in a small lowland
river. International workshop of acoustic and seismic monitoring of bedload and mass movements 2013, Swiss Federal Research Institute WSL, Birmensdorf, Switzerland.
Behzad, K and Huat, B.B. K. (2008). Peat soil stabilization using ordinary portland cement, polypropelene, fibers and air curing technique. Electronic Journal of Geotechnical Engineering, Vol. 13, Bund. J.
Bergado, D.T., Anderson, L.R., Miura, N.& Balasubramaniam, A.S. (1996). Soft
Bergner K. and Albano C. (1993). Thermal analysis of peat. Analitical Chemistry. 204-208.
Billong, N., Melo, U.C., Louvet, F., Njopwouo, D. (2009). Properties of compressed lateritic soil stabilized with a burnt clay-lime binder: effect of mixture
components. Construction and Building Materials 23, 2457–2460.
Blissett, R.S. and Rowson, N.A. (2012). A review of the multi-component utilisation of coal fly ash. Fuel . Vol. 97.1–23.
Boelter, D.H. (1968). Important physical properties of peat materials. Proceedings of the Third International Peat Congress. Quebec,Canada. 150-156.
Book, A. A. (1985). Standard Classification of Peat Samples by Laboratory Testing
(D4427-84). ASTM, Section, 4, 883-884.
Boulanger, R. W., Arulnathan, R., Harder Jr., L. F., Torres, R. A. and Driller, M. W. (1998). Dynamic properties of Sherman Island peat. Journal of Geotech. Geoenvironment Engineering.124. 12-20.
British Standard Institution, 1986. BS 8004: 1986. Method of Test for Soils for Civil Engineering Purposes.
British Standard Institution, 1990. BS 1377, 1-8: 1990. Method of Test for Soils for Civil Engineering Purposes.
Brouwer, P. N. (2010). Theory of XRF, 3rd edition, The Netherlands, PANalytical B.V.
Cancellieri, D., Leroy, C. V., Leoni, E., Simeoni, A., Kuzin, A. Y., Filkov, A. I. and Rein, G. (2012). Kinetic investigation on the smouldering combustion of boreal peat. Fuel. Vol. 93, 479–485.
Cement and Its Impact on Concrete Performance. (2012). Portland Cement Association, USA.
Chan, C.M. (2006). A Laboratory Investigation of Shear Wave Velocity in Stabilized Soft Soils. PhD thesis, Department of Civil and Structural Engineering, University of Sheffield.
Chan, C.M. (2009). NeuSOIL: Regenerating soft soils for engineering applications. Engineering Seminar on Peat, Sibu, Sarawak.
Chan, C.M. (2012). On the intepretation of shear wave velocity from bender element
Chapman, S. J., Campbell, C. D., Fraser, A. R. and Puri, G. (2001). FTIR spectroscopy of peat in and bordering Scots pine woodland: relationship with
chemical and biological properties. vol. 33. 1193–1200.
Chen, H. and Q. Wang, 2006. The behaviour of organic matter in the process of soft
soil stabilization using cement. B. Eng. Geo. Environ., 65(4): 445-448.Digital
Object Identifier (D OI): 10.1007/s10064-005-0030-1.
Chimenos, J. M., Segarra, M., Fernandez, M. A. and Espiell, F. (1999). Characterization of the bottom ash in municipal solid waste incinerator.
Journal of Hazardous Materials A:64 1999 211–222.
Collins, R. (1988). A Comparison between Coal Ash and Incinerator Ash.
Proceedings of the First International Conference on Municipal Solid Waste Combustor Ash Utilization, Philadelphia. 99 - 108.
Consoli, N. C., Zortéa, F. de Souza, M. and Festugato, L. (2011). Studies on the Dosage of Fiber-Reinforced Cemented Soils. Journal of Materials in Civil Engineering © ASCE . 1624-1632.
Consoli, N.C., G.V. Rotta and P.D.M. Prietto (2002). Influence of curing under stress on the triaxial response of cemented soils. Geotechnique, 52(5): 382-384.
Cwalina, B. (2008). Biodeterioration of concrete. Architecture Civil Engineering Environment. 133-140.
Deboucha, S. and Hashim, R. (2009). Durability and swelling of tropical stabilized peat soils. Journal of Applied Sciences 9 (13). 2480-2484.
properties of stabilized soil specimens. In International Symposium on Deep Mixing and Admixture Stabilization, Okinawa 12-21 May.
Dehghanbanadaki, A., Ahmad, K. and Ali, N. (2013).Influence of natural fillers on shear strength of cement treated peat. Gradevinar 65. 633-640.
Dobry, R. and Vucetic, M. (1987). State of the art report: Dynamic properties and response of soft clay deposits. Proceeding, International Symposium on Geotechnics Engineering of Soft Soils, Mexico City, Vol. 2. 51–87.
Douglas, P.R., 2004. Properties of self-consolidating concrete containing type F fly ash. Thesis (MS). North western University. USA.
Dunlap, M. and Adaskaveg, J.E. (1997). Introduction to the Scanning Electron Microscope, Theory, Practice, & Procedures, Facility for Advanced Instrumentation, U. C. Davis.
El-Jazairi, B. & Illston, J.M. (1977). A Simultaneous Semi-Isothermal Method of Thermogravimetry and Derivative Thermogravimetry, and Its Application to Cement Plates. Cement and Concrete Research, Vol.7, 247-258.
El-Jazairi, B. & Illston, J.M. (1980). The Hydration of Cement Plate Using the SemiIsothermal Method of Thermogravimetry. Cement and Concrete Research, Vol.10, 361-366.
Erol, M., Küçükbayrak, S. and Ersoy-Meriçboyu, A. (2008). Characterization of sintered coal fly ashes. Fuel. Vol. 87. 1334–40.
EuroSoilStab. (2002). Development of design and construction methods to stabilize soft organic soils (design guide soft soil stabilisation). European Comission, Industrial and Material Technologies programme (Brite-EuRam III), Brussels. Ferrari, L., Kaufmann, J., Winnefeld, F. and Plank, J. (2011). Multi-method approach
to study influence of superplasticizers on cement suspensions. Cement and Concrete Research. 41(10). 1058-1070.
Francioso O., Ciavatta C., Montecchio D., Tugnoli V., Sanchez-Cortes S., Gessa C.(2003). Quantitative Estimation of Peat, Brown Coal and Lignite Humic Acids Using Chemical Parameters, 1H-NMR and DTA Analyses. Bioresource Technology, N 88, 189-195.
Gofar, N. and Sutejo, Y. (2007). Long term compression behaviour of fibrous peat.
Malaysian Journal of Civil Engineering 19(2) :104-116.
Greaves, G. N., Greer,A. L., Lakes, R. S. and Rouxel, T. (2011). Poisson’s ratio and modern materials. Nature Materials 10, 823–837.
Ground Improvement in LowLand and Other Environments. American Society of Civil Engineers (ASCE) Press. 235-238.
Halstead, W.J. (1986). Use of Fly Ash in Concrete. Washington: Transportation Research Board, National Research Council.
Hamer, D.A. (2012), Stabilization of peat by infiltration of reactants, feasibility study: infiltration of silica biopolymer suspension in peat, Msc. Thesis University of Utrecht, Netherlands.
Harrison, A. M., Taylor, H. F. W., and Winter, N. B.(1985). Electron optical analyses of the phases in a portland cement clinker, with some observations on the calculation of quantitative phase composition. Cement Concrete Research.15:775.
Hartford, R. A. (1993). Smoldering combustion limits in peat as influenced by
moisture, mineral content, and organic bulk density (Master's thesis,
University of Montana).
Hashim, R. and Islam S. (2008). A Model Study to Determine Engineering Properties of Peat Soil and Effect on Strength after Stabilization. European J. Scientific Res., 2, 205–215.
Hayashi, H., Yamazoe, N., Mitachi, T., Tanaka, H. and Nishimoto, S. (2012) Coefficient of earth pressure at rest for normally and overconsolidated peat ground in Hokkaido area. Soils and Foundations 52. The Japanese Geotechnical Society. 299–311.
Hebib, S. and Farell, E. R. (2003). Some experiences on the stabilisation of Irish peats: Can. Geotech. Journal. 40. 107-120.
Hingley, M. (1993). Microscopic Life in Sphagnum. Richmond Publishing, England. Hiraide, A., Baba, K. and Azuma, H. (1996). Quality assessment of stabilized soil by
Hoo, L.S. (2013). Solidification of Malaysian Dredged Soils: Strength Characteristics. Bachelor Degree Thesis. Faculty of Civil and Environmental Engineering, Universiti Tun Hussein Onn Malaysia.
Horpibulsuk, S. (2012). Strength and Microstructure of Cement Stabilized Clay, Scanning Electron Microscopy. ISBN: 978-953-51-0092-8, InTech.
Horpibulsuk, S., Miura, N. and Nagaraj, T. S. (2005). Clay–Water/Cement Ratio Identity for Cement Admixed Soft Clays. Journal of Geotechnical and Geoenvironmental Engneering © ASCE. 187-192.
Horpibulsuk, S., Rachan, R., Chinkulkijniwat, A., Raksachon, Y. and Suddeepong, A., (2010). Analysis of strength development in cement-stabilized silty clay from microstructural considerations. Construction and Building Materials 24. 2011–2021.
Huat, B. B. K., Maail, S. and Mohamed, T. A. (2005). Effect of Chemical Admixtures on the Engineering Properties of Tropical Peat Soils. American Journal of Applied Sciences: Vol.2 (7). 1113-1120.
Huat, B.B.K. (2004). Organic and peat soil engineering. Serdang, University Putra Malaysia Press.
Huat, B.B.K., Kazemian, S., Prasad, A. and Barghchi, M. (2011). State of an art review of peat: General perspective. International Journal of the Physical Sciences Vol. 6(8), 1988-1996.
Hunter, P.J., Petch, G.M. and Calvo-Bado, L.A. (2006). Differences in microbial activity and microbial populations of peat associated with suppression of damping-off disease caused by Pythium sylvaticum. Applied and Environmental Microbiology 72(10). 6452–6460.
Islam, M. S. and Hashim, R. (2010). Behaviour of stabilised peat: A field . study.
Scientific Research and Essays Vol. 5(17), 2366-2374.
Islam, M.D.I. and Hashim, R. (2008). Stabilization of Peat by Deep Mixing Method: A critical Review of the state of Practice. Electronic J. of Geotechn. Eng., 13, Bund H.
Ismail, N., Nonaka, T., Noda, S.and Mori, T. (1993). Effect of carbonation on microbial corrosion of concretes. Journal of Construction Man. and Engineering. 133-138.
Jackson, N. and Dhir, R.K. (1996). Civil Engineering Materials 5th edition.
McMillan Publisher.
Janz, M. and Johansson, S. (2002). The function of different binding agents in deep stabilization. Report 9, Swedish Deep Stabilization Research Center, Linköping, Sweden. 1-47.
Jolicoeur, C. and Simard, M. A. (1998). Chemical Admixture-Cement Interactions: Phenomenology and Physico-chemical Concepts. Cement and Concrete Composires. Vol. 20. 87-101.
Kahn, Z., Majid, A., Cascante, G., Hutchinson, D.J. and Pezeshkpour, P. (2006). Characterization of a cemented sand with the pulsevelocity method. Canadian Geotechnical Journal 43(3): 294– 309.
Kalantari, B. (2010). Stabilization of tropical fibrous peat using ordinary portland cement and additives. PHD thesis. Universiti Putra Malaysia.
Kalantari, B. and Prasad, A. (2011). Precast Peat Columns Stabilized with Cement and Fibers to Reinforce Peat Deposits. 5th SASTech, Khavaran Higher-education Institute, Mashhad, Iran. 1-16.
Kalantari, B. and Prasad, A. (2014). A study of the effect of various curing techniques on the strength of stabilized peat. Transportation Geotechnics 1. 119–128.
Kazemian, S., Huat, B. B. K., Prasad, A. and Barghchi, M. (2011a). A state of art review of peat: Geotechnical engineering perspective. International Journal of the Physical Sciences. Vol. 6(8). 1974-1981.
Kazemian, S., Huat, B.K., Prasad, A. and Barghchi, M. (2011b). Effect of peat media on stabilization of peat by traditional binders, International Journal of the Physical Sciences Vol. 6(3), pp 476-481.
Kevan, D.S. (1993). Fly Ash for Soil Improvement. New York: American Society of Civil Engineers.
Kido, Y., Nishimoto, S., Hayashi, H. and Hashimoto, H. (2009). Effects of curing temperatures on the strength of cement-treated peat. International Symposium on Deep Mixing and Admixture Stabilization, OKINAWA 2009.
Kolay, P.K, Sii, H. Y. and Taib, S.N.L.(2011).Tropical Peat Soil Stabilization using Class F Pond Ash from Coal Fired Power Plant International Journal of Civil and Environmental Engineering 3:2. 79-83.
Kosmatka, S. and Farny, J. (1997). Concrete Technology Today. Illinois ,USA. Portland Cement Association.
Krumins, J., Klavins, M., Seglins, V. and Kaup, E. (2012). Comparative Study of Peat Composition FT-IR Spectroscopy. Material Science and Applied Chemistry.106-114.
Laporan Ketua Audit Negara, Aktiviti Jabatan/Agensi Dan Pengurusan Syarikat
Kerajaan Negeri Johor Tahun 2011, Jabatan Audit Negara, Malaysia.
Larkin, P. J. (2011). IR and Raman: Principles and Spectral Interpretation. Waltham, USA. Elsevier Inc.
Larsson, R., Holm, G., Ahnberg, H. and Bengtsson, P.E. (2005). Shear wave velocity and shear strength relation for binder-mixed soil – preliminary results from a
laboratory study. No. 4. 46–51.
Lee, J. S. and Santamarina, J. C. (2005). Bender Elements: Performance and Signal
Interpretation. Journal of geotechnical and environmental engineering©
ASCE. 1063- 1070.
Leete, R. (2006). Malaysia’s Peat Swamp Forest Conservation and Sustainable Use. United Nations Development Programme Malaysia. Ministry of Natural. Resources and Environment, Malaysia.
Leong, E. C. and Eriktius, D. T. (2013). Improvement of peaty soils with municipal solid waste fly ash. Environmental Geotechnics Volume 1 Issue EG4.200–209. Leong, E.C., Yeo, S.H. and Rahardjo, H. (2005). Measuring shear wave velocity
using bender elements. Geotechnical Testing Journal 28(5). 488–498.
Little, D. N. (1999). Evaluation of structural properties of lime stabilized soils and aggregates. Summary of findings, Volume I, National Lime Association, USA.