Journal of Chemical and Pharmaceutical Research, 2015, 7(9S):165-176
Research Article
CODEN(USA) : JCPRC5
ISSN : 0975-7384
Production, purification, and characterization of inulinase from dahlia
rizhosphere-isolated Aspergillus clavatus
Saryono
a*, Chainulfiffah A. M.
a, Aulia Ardhi
aand Nova Wahyu Pratiwi
baDepartment of Chemistry, Faculty of Mathematics and Natural Sciences, Universitas Riau
bDepartment of Biology, Faculty of Mathematics and Natural Sciences, Universitas Riau
_____________________________________________________________________________________________
ABSTRACT
This study undertook exploration of Indonesian Dahliaplant (Dahlia variabilis), that can potentially be developed as the source of inulin. Aspergillus clavatus Gmn11.3 was an endophytic fungi isolated from Brastagi’s Dahlia rizhosphere which had been previously reported to show high inulinase activity by producing wide halo zone around the colonies. This research aimed to optimize the production of inulinase by A.clavatus Gmn11.3.Inulinase production was carried out using the best inducer;1% inulin in a medium containing 0.05% MgSO4.7H2O; 0.015%
FeSO4; 0.2% NaCl, 0.05%KCl, and 1.0% yeast extract at 37 0
C, pH 4.5, and 5 days incubation (120 hours).The crude extract of extracellular enzyme was purified by ammonium sulphate precipitation, followed by Sephadex G75 and G50 gel filtration, DEAE cellulose and DEAE-Toyopearl anion exchanger-column chromatography. The purity of extracellular enzyme was monitored using SDS PAGE. Inulinase purity increased 5.91 fold after ammonium sulphate-fractionation, and 71.66 fold after purification using gel filtration-column chromatography and ion exchange-column chromatography. Inulinase from A. clavatus Gmn11.3 showed higher affinity than to its substrates with Km 0.078mM and 0.039mM, and Vmax were 0.098mM/h and 0.041mM/h respectively at optimum pH 5.0; temperature 500C at four hours-incubation time; and its molecular weight were estimated to be 65.2KDa and 62.4KDa. Whilstinulinase from A. niger Gmn11.1, as a comparison, had a Km and Vmax value 0.021mM and
0.022mM/h respectively at optimum pH 4.6; temperature 450C with 15 hours incubation time; and its molecular weight was estimated to be 63KDa.
Keywords: Aspergillus clavatus,Dahlia, fungi, inulinase, purity rhizosphere.
_____________________________________________________________________________________________
INTRODUCTION
Inulinase is an enzyme that hydrolyses inulin into fructose or fructooligosaccharide. Exo-inulinase (β
-D-fructanfructohydrolase, EC 3.2.1.80) splits off the terminal fructose units from non-reducing end of the inulin
molecule; it also hydrolyzed sucrose and rafinose. Endoinulinase (2,1-β-D-fructanfructanohydrolase, EC 3.2.1.7)
targets the β-2,1 linkage of inulin (a polyfructan consisting of linear β-2,l-linked fructose) and hydrolyzes it into
fructose [1,2]. This polymer is a recognized source for the production of ultra-high fructose syrups, which after exo-enzymatic hydrolysis yielding over 95% D-fructose content, while the production of oligofructose syrup is carried out by endo-enzymatic hydrolysis, or for ethanol production using fermentation process [2].
Inulin can be hydrolyzed by a chemical approach, but there are many disadvantages [1,3]. On the other hand, complete hydrolysis of inulin by inulinase yields 95% pure fructose and fructo-oligosaccharides. Inulinase can be produced by many microorganisms including Staphylococcus, Xanthomonas, Pseudomonas, and Arthrobacterurea
faciens; yeasts such as Kluyveromyces fragilis, K. marxianus, Candida kefyr, and Debaryomyces cantarelli; and
fungi including Penicillium and Aspergillus species [1,2,4,5]. The enzyme convert inulin into an oligosaccharide,
DFA III (di-D-fructofuranose 1,2l:2,3ldianhydride), and a small amount of other oligosaccharides. This enzyme was
the inulin fructotransferase (DFA III-producing) from Arthrobacter species [6,7,8,9]. Another enzyme had been purified from Bacillus sp by Kang et al. [10].
In foreign countries, Chicory root plants (Cichoriumintybus) have been commercially used as a possible candidate for alternative crop to sugar beet contains inulin [11]. However, people from some countries including Indonesia have never used to take the benefits from Chicory. Dahlia tubers are known to contain compounds which have high bioactivity. In some regions in Indonesia, especially in Sumatera with the mountainous topography, Dahlia can naturally grow well. For instance, in the province of Sumatera Barat, such as in Solok, Padang Panjang, Payakumbuh, and BatuSangkar; Brastagi (Sumatera Utara), Curup (Bengkulu), and LubukLinggau (Sumatera Selatan) Dahlia thrives in an environment of settlements. While in Kalimantan, Dahlia is relatively difficult to find due to environmental factors affecting the growth of Dahlia [12].In this study, exploration of Dahlia
variabilisendophytic fungi that can potentially be developed as the source of inulin was carried out. Soil samples
and Dahlia tuber crops which have become rotten are sources of inulinase-producing microbes [13]. Our previous studies resulted that a number of fungi isolated from some regions in Sumaterashowedmedium to high inulinase activity and Aspergillus clavatus was found to be the highest [14]. Since there was lack of reports on inulinase from this fungi,this research aimed to produce, purify, and characterize the inulinase from Aspergillus clavatus strain Gmn11.3.
EXPERIMENTAL SECTION
Materials
The strain, Aspergillus clavatusGmn11.3,used in the present study was isolated from the rhizosphere of Dahlia (Dahlia variabilis)which was grown in Brastagi, Province of Sumatera Utara. This strain had produced the widest clear zone in the previous study [15] and it maintained in PDA slants and taken for further studies. The fungal culture was inoculated into 25 ml PDA medium with pH 7.0 then incubated in a shaking incubator at 100rpm speed
for 3 days at 300C [14]. The culture was used for the subsequent fermentation experiments.A total of 2.5 mL
fermentationculture was inserted into the flask containing 25 mL of medium pH 5 consisting of 1% inulin, 0.5%
(NH4)2HPO4, 0.05% MgSO4.7H2O, and 0.015% FeSO4[16]. The mixture was incubated for 5 days in an incubator
shaking at 100 rpm and 300C.
Inulinase Production by Aspergillus clavatus Gmn11.3 Determination of the length of incubation
Determination of the length of incubation in inulinase production was carried out by varying the incubation time from 0 to 12 days. Inulinase activity was determined by measuring the reducing sugars formed by the method of ortho-toluidine and biomass was determined gravimetrically.
Determination of the effect of inducer concentration
A series of inulin concentration used were 0.1%; 0.25%; 0.5%; 0.75%; 1.0%, and 1.5%. The medium carbon source change was made with glycerol, lactose, cellulose, starch and sucrose to see whether inulinase which had been produced was inductive or constitutiveExperiment was carried out with three replications. This mixture was
incubated at a temperature of 30oC and pH 7.0. Harvesting is done every 12 hours with an initial hour as control. All
samples were examined of fructose level formed, the number of biomass produced, and inulinase activity.
Determination of the influence of the medium composition
[image:2.595.70.542.650.759.2]Experiment was conducted in a variety of medium composition to determine the effect of various composition of the medium on enzyme activity as showed in Table 1. Determination of fructose, reducing sugars, and biomass that formed with three replications was undertaken in 10 fermented medium. The most appropriate medium in this experiment was used in subsequent experiments.
Table 1.Various compositions used to measure enzyme activity
No. medium Composition
1 1% inulin
2 1% inulin + 0,5% (NH4)2HPO4
3 1% inulin + 0,5% (NH4)2HPO4 + 0.05% MgSO4.7H2O
4 1% inulin + 0,5% (NH4)2HPO4 + 0.05% MgSO4.7H2O + 0,015% FeSO4
5 1% inulin + 0,5% (NH4)2HPO4 + 0.05% MgSO4.7H2O + 0,015% FeSO4 + 0,2% NaCl
6 1% inulin + 0,5% (NH4)2HPO4 + 0.05% MgSO4.7H2O + 0,015% FeSO4 + 0,2% NaCl + 0,0-5% KCl
7 1% inulin + 0,5% (NH4)2HPO4 + 0.05% MgSO4.7H2O + 0,015% FeSO4 + 0,2% NaCl + 0,0-5% KCl + 1% yeast extract
8 1% inulin + 0.05% MgSO4.7H2O + 0,015% FeSO4 + 0,2% NaCl + 0,0-5% KCl + 1% yeast extract
9 1% inulin + 1% yeast extract
Effect of fermentation temperature
Experiment was conducted with 25ml of medium pH 5 and agitation 100rpm with various temperature used 30oC;
35oC; 37oC; 40oC, and 50oC, and then determined the relationship between biomass growth and enzyme activity
against temperature.
Effect of pH fermentation medium
A series of pH value 3.5; 4.0; 4.5; 5.0; 5.5; and 6.0 was used. Subsequently, the relationship curve between biomass growth and enzyme production with pH treatment at the optimum temperature was made.
Biomass concentration measurement
Cells produced during the fermentation process were separated from the liquid medium by centrifugation at 5000 rpm for 15 minutes and washed with distilled water and filtered with filter paper that had been known the weight
quantitatively. Subsequently, the samples were dried in an oven for 3 hours at a temperature of 60-70oC and after
cooling in a desiccator for 15 minutes the samples were weighed. Samples were reheated for 20 minutes and cooled in a desiccator for 15 minutes and then weighed again until reaching constant weight.
Determination of inulinase activity
Inulinase activity was determined by adding 1mlof enzyme solution with 9 ml of 1% inulin. Incubation was carried
out at a temperature of 400oC for 8 hours, and then the enzyme activity was stopped by immersing the system in
boiling water for 10 minutes [14]. In addition, fructose formed was determined using ortho-toluidine method.
InulinasePurification Inulinase Fractionation
Inulinase production was carried out in a 600 ml erlenmeyer flask with 300 ml medium at 37oC, pH 4.5, and
agitation of 100 rpm for 5 days incubation. After incubation, extracellular enzymes were separated by centrifugation
at 5000 rpm, for 20 minutes at a temperature of 40oC. A crude enzyme extract fractionated by precipitation using
ammonium sulphate with degree of saturation of 60-100%. The result of fractionation was dialyzed in 0,02 M phosphate buffer pH 7, and then inserted into the gel filtration chromatography column. Purification by column chromatography Sephadex G75 gel filtration was using a 1.5 x 60 cm column with a flow rate of 1 ml/h and 0.01 M acetic acid as elution media. Purification followed by Sephadex G50 column chromatography sized 1,2 x 28cm.The active fraction resulted fromSephadex G50 column chromatography was purified further by anion exchange column chromatography with DEAE-Cellulose and DEAE-Toyopearl.
Determination of protein content
Protein content was determined by the Lowry method [17] using bovine serum albumin as a standard.
Determination of kinetic parameters
The Michaelis-Menten kinetic parameters Km and Vmax were determined from Lineweaver-Burk plots using inulin at concentrations ranging from 0.5 to 2.0 mM and 20 to 200 mM, respectively, as substrate.
RESULTS AND DISCUSSION
The rising potential of inulinase applications, such as production of high fructose syrups, fructooligosaccharides, ethanol, and inulo-oligosaccharides which are extensively used in pharmaceutical and food industries, has been promoting to search for new sources of inulinase. Hence, microorganisms are the best sources for commercial production of inulinase because of their easy cultivation and high yields of the enzyme. The attempt of this research was made to optimize and identify inulinase production by Aspergillus niger isolated from the rhizosphere of Dahlia.
Saryonoet al.[15] had isolated33inulinase-producing fungi isolated from Dahlia’s rizhospheres which were grown in various places on the island of Sumatra and Java and there were 15 species that had never been reported as a producer of inulinase, namely: Cunningha mellaelegan, Rhizopus stolonifer, Aspergillus clavatus, Fusarium
culmorum, F. solani, F. culmorum, Cylindro cephalumaureum, Humicola grisea, Oidio dendrongriseum, Geotricum sp., G. candidum, Penicilliummelinii Thom, P. citreoningrum, andCephalosporium sp. The isolates were tested using
Optimization for inulinase production by Aspergillus clavatus Gmn11.3
Various treatments such as the length of incubation, inducer concentration, carbon sources, and medium composition were prepared as described in materials and methods as an optimization for inulinase production by A.
clavatus Gmn11.3 grown in the basal medium for 24 h.
The length of incubation for inulinase production
The incubation time of inulinase production by A. clavatus Gmn11.3 varied from 0 to 12 days with pH 5,
temperature 300C and agitated at 100 rpm. Inulinase activity produced by A. clavatus Gmn11.3 increased during the
growth phase until the stationary phase. This result was consistent with the research of Vandamme and Dirk [13] who found that the production of extracellular inulinase enzyme produced by Kluyveromyces fragilis increased even during stationary phase. The length of incubation for inulinase production by A. clavatus Gmn11.3 was five days
with the highest activity of 2.51 mg/ml. The highest biomass produced on 8thday was as much as 0.0197 g, and the
[image:4.595.137.478.564.708.2]highest level of reducing sugars in the medium was found on 4thday of 3.97 mg / mL, as shown in Fig 1.
Figure 1. Profil of inulinase production by A. clavatus Gmn11.3. on medium containing inulin as the only carbon source
A. clavatus Gmn11.3 could potentially be used as a producer of inulinase, because the incubation time was relatively
faster than the production of inulinase from Fusarium oxysporum,Marinimicrobium sp., and Aspergillus
versicolor[18,19,20]. Nakamura et al., [21], produced inulinase from A. niger mutant 817 with a seven days
incubation time. While Chainulfiffah et al., [22], reported that optimum incubation time for the production of inulinase from local strain of A. niger Gmn11.1 was five days.
The production of inulinase is growth associated and reached the optimum near the stationary phase. The decrease in enzyme activity after 5 days fermentation could be either due to decrease in nutrient availability in the medium or catabolic repression of enzyme as reported by Kumar et al.,[23]. One of the most important factors that determined the cost of production in the fermentation process was the time of enzyme production. Therefore, many efforts needed to transform and accelerate the production time because microorganisms naturally produced the enzyme at slow speed.
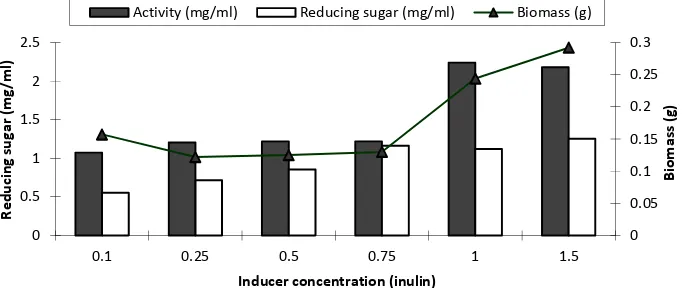
Figure2. Inulinase activity, reducing sugar content, and biomass produced at various concentrations of inducers on inulinase production by A. clavatus Gmn11.3
0 0.05 0.1 0.15 0.2 0.25 0.3 0.35 0 0.5 1 1.5 2 2.5 3 3.5 4 4.5
0 1 2 3 4 5 6 7 8 9 10 11 12
B io m as s (g ) R ed u ci n g s u g ar ( m g /m l)
Length of incubation (days)
Activity (mg/ml) Reducing sugar (mg/ml) Biomass (g)
0 0.05 0.1 0.15 0.2 0.25 0.3 0 0.5 1 1.5 2 2.5
0.1 0.25 0.5 0.75 1 1.5
B io m a ss ( g ) R e d u ci n g s u g a r (m g /m l)
Inducer concentration (inulin)
Determination of inducer concentration
Determination of the appropriate inducer concentration for inulinase production by A. clavatus performed by varying the series of concentration of inulin 0.1%; 0.25%; 0.50%; 0.75%; 1.0%; and 1.5%. Inductive enzyme such as inulinase would be synthesized by a microorganism if there were inducers or inducer compounds. In Fig.2, the highest inulinase enzyme production was obtained at inducer concentration of 1.0% with activity of 2.24 mg/ml. The highest biomass was 0.044 g, also produced at the inulin concentration of 1.0%. While the highest reducing sugar level was obtained at the concentration of inducer 1.5%.
Inducer is a substrate or a similar compound used by enzymes to synthesize. Inulin was used as inducer, because inulin is a substrate for the inulinase enzyme. Kauret al. [24]also produced inulinase from Fusarium oxysporum using inulin from Chikory as inducer. According to Vandamme and Dirk [13], the use of inulin as a carbon source was a prerequisite in inulinase-producing microbial screening. Kluyveromyces fragilis used 3% inulin as inducer and carbon source to produce inulinase. The use of inulin was better than the other inducers such as raffinose, fructose, and sorbitol.
To determine whether inulinase produced was constitutive or inductive, replacement with a carbon source glycerol and lactose was performed. The highest inulinase activity was 2.37 mg/ml, produced using inulin as a carbon source. Biomass concentration was expressed as dry cell weight. As the carbon concentration increased, biomass concentration increased correspondingly. These results were in agreement with those obtained in previous study[25]. The highest biomass produced by fungi grown in medium containing 0.2963 g of lactose, while the highest reducing sugar lactose presented in the medium at 6.05 mg/ml as shown in Fig.3.
Inulinase generated by A. clavatus Gmn11.3 was inductive which inulin was the best inducer, although this enzyme could also be induced by other carbon sources such as sucrose, starch, and cellulose. Whilst, glycerol and lactose could not induce inulinase at all. Cruzguerrero et al., [26], found that while inulin was a best source of carbon or inducers for inulinase production by Kluyveromyces marxianus CDBB-L-278, this fungus produced the same enzyme using glycerol as carbon source as well. On the other hand, a different result reported by Mahmoud et
al.[27]that sucrose slightly favored inulinase production compared with pure inulin which suppressed enzyme.
Figure3. Inulinase activity, reducing sugar, and biomass in inulinase produced by A. clavatus Gmn11.3 in various carbon sources
Based on the result of this study, inulin was a potential inducer of inulinase and it was in a good agreement with Gao
et al. [25] which yielded inulinase 66% higher than fructose. In the previous study, fructose was believed to be the
primary inducer of inulinase[28]. Fig.3 shows that A. clavatus Gmn11.3 produced high reducing sugar using lactose as a carbon source or inducer. This symptom indicated that A. clavatus Gmn11.3 was not only able to produce
inulinase but also produced lactase or β-galactosidase when using lactose as inducer. Inulinase production by
microbes was often followed by the activity of other enzymes such as invertase. Kaur et al., [24] had identified four types of inulinase and four types of invertase with different properties on Fusarium oxysporum with inulin as carbon source. Clostridium thermosuccinogenes grown on inulin medium could produce six enzymes out of inulinase, namely lactate dehydrogenase, phosphoenol pyruvate carboxylase, malate dehydrogenase, fumarase, fumarate reductase, phosphor-transacetylase, acetate kinase, pyruvate kinase, and alcohol dehydrogenase [29].
Selection of growth medium composition for production inulinase
The highest activity and the highest reducing sugar content was obtained from medium no. 8 which was consisting
of 1% inulin; 0.05% 0.05% MgSO4.7H2O; 0.015% FeSO4; 0.2% NaCl, 0.05% KCl, and 1% yeast extract. This
10 (Fig.4). Optimization of the enzyme production by a microbial was influenced by the formulation of the medium, pH, temperature, and the availability of specific nutrients properly during fermentation[30,31].
Figure4. Effect of medium composition on inulinase activity, reducing sugar content, and biomass produced by A. clavatus Gmn11.3
The composition of microbial growth media was different from each other depending on the type of microbes. Enzyme production by microbes also depended on the type of microbes and nutrients needs appropriately. A. niger Gmn11.1 isolated from Malang, East Java, showed high inulinase activity in the medium with inorganic nitrogen
source, which consisted of 1% inulin; 0.5% (NH4)2HPO4; 0.05% MgSO4.7H2O [22]). Another study [21] reported
that inulinase produced from A. niger mutant 817 with medium composition 1% inulin; 0.5% peptone; 0.1%
(NH4)2HPO4; 0.05% KCl; 0.05% MgSO4.7H2O; and 0.001% FeSO4.7H2O.
Determination of incubation temperature on enzyme production
The optimum fermentation temperature on inulinase production by A. clavatus Gmn11.3 was obtained by varying
the temperature into 300C, 350C, 370C, 400C, 450C and 500C. Fig 5 showed the optimum inulinase and the optimum
biomass activity were reached at temperature of 370C with reducing sugar content of 1,97 mg/ml. It had a little
different from Meenakshi et al.[32], who reported the optimum temperature for inulinase production by Bacillus
cereus was at 300C. Generally, inulinase formation would be reduced if the temperature kept increasing because temperature influenced the metabolic activity of cells. The optimum activity of inulinase production by the soil
bacteria, Enterococcus faecalis, was achieved at a higher temperature of 550C after incubation [33].
Figure5.Effect of incubation temperature on inulinase activity, reducing sugar content, and biomass produced by A. clavatus Gmn11.3
Determination of pH on Enzyme Production
The secretion of extracellular enzymes by a microbial growth medium is significantly affected by pH. Determination of the optimum pH for the inulinase production by A. clavatus Gmn11.3 conducted using the optimum temperature conditions which had been obtained. The optimum inulinase activity (2.55 mg/ml) was produced at pH 4.5. The highest reduction sugar (3.8mg/ml) was produced at pH 4 and the highest biomass (0.26 g) was obtained at pH 5, as shown in Fig.6. Production of inulinase by Thielavia terrestris NRRL 8126 and mesophile Aspergillus
foetidus NRRL 337 had optimum pH at 4.5 to 5.5 [34].On contrary to this, maximum production of inulinase from
0 0.05 0.1 0.15 0.2 0.25 0.3 0 0.5 1 1.5 2 2.5 3
1 2 3 4 5 6 7 8 9 10
B io m as s (g ) R ed u ci n g s u g ar ( m g /m l)
Sequence number of the medium
Activity (mg/ml) Reducing sugar (mg/ml) Biomass (g)
0 0.05 0.1 0.15 0.2 0.25 0.3 0.35 0.4 0 0.5 1 1.5 2 2.5 3
30 35 37 40 45 50
B io m as s (g ) R ed u ci n g s u g ar ( m g /m l) Temperature
inulin by Xanthomonas campestris was obtained at pH 7, which was also shown to be the optimal pH for biomass growth[35]. However, pH of extracellular enzyme production by a microbe is not always the same as pH of optimum cell growth, because pH of the enzyme production is closely related to the secretion of enzymes produced through the cell membrane [13].
Figure6.Effect of pH on inulinase activity, reducing sugar content, and biomass produced by A. clavatus Gmn11.3
Inulinase Fractionation
Based on the best condition which was obtained previously, inulinase production was carried out in a 300 ml
medium at 370C, pH 4.5, and agitation of 100 rpm for 5 days incubation. After separated using 5000 rpm
sentrifugation, the crude enzyme extract was yielded as much as 270 ml with activity of 0.144 U and 6 mg/ml proteint content. Fractionation of crude enzyme extracts was performed using ammonium sulphate and Sephadex G75 gel filtration. Purification was followed by Sephadex G50 chromatography columns, the active fraction was purified further by DEAE-Cellulose anion exchange column chromatography.
Activity of 60-100% saturated (NH4)2SO4 purified fraction was 117.3 mg/ml or equivalent to 0.651 units/ml and
[image:7.595.151.468.126.289.2]4.56 mg/ml protein content.The purity level increased 5.91 times and recovery reached 33.5% as shown in Table 2. Inulinase produced byA. clavatusGmn11.3 was further purified by gel filtration column chromatography using Sephadex G75 as a matrix. Sephadex G75 is able to filter out molecules with molecular weight of 30-70 kDa while inulinase was about 60 kDa [36].
Figure 7. Purification using Sephadex G75 column chromatography (1.5 x 60 cm) of crude enzyme extract fraction at 60-100% saturation of (NH4)2SO4, 0.01 M acetic acid as eluent at flow rate of 1 ml/hour
Separation using Sephadex G75 gel filtration chromatography showed three peaks of protein (Fig. 7). Inulinase was contained in the third peak which its activity was 354 mg reducing sugar/ml or equivalent to 0.651 units of activity, and the protein content of 3.83mg/ml. The enzyme moved out of the column at the end or third peak fraction could be caused by the enzyme molecules which passed through the pores of the gel in advance so that the protein having a molecular weight greater than 70 kDa came out first. Protein at third peak from fractions 15, 16, 17, 18, 19, 20, 21, and 22 which have inulinase activity were collected for subsequent purification stages. Electrophoresis results of the active fraction from Sephadex G75 gel filtration results still showed three protein stains. Two stains adjacent to each
0 0.05 0.1 0.15 0.2 0.25 0.3 0 0.5 1 1.5 2 2.5 3 3.5 4
4 4.5 5 5.5 6
B io m as s (g ) R ed u ci n g s u g ar ( m g /m l) pH
Activity (mg/ml)) Reducing sugar (mg/ml) Biomass (g)
0 0.2 0.4 0.6 0.8 1 1.2 0 0.2 0.4 0.6 0.8 1 1.2 1.4
1 3 5 7 9 11 13 15 17 19 21 23 25 27 29
A
ct
ivi
ty
(m
g
re
d
u
ci
n
g
su
gar
/m
l)
A
b
sor
b
an
ce
at
280
n
m
No. fraction tubes
other which were about 60-70 kDa while another stain was located quite a distance which was about 25 kDa. To separate the protein of A. clavatus Gmn11.3 located far apart on the electrophoresis gel, those were performed with gel filtration chromatography Sephadex G50, which can filter out molecules with a molecular weight of about 1.5 to 30 kDa.
[image:8.595.138.477.539.713.2]Separation of proteins by Sephadex G50 column chromatography resulted in two major peaks. Inulinase activity presented in the first peak at fractions 5, 6, 7, 8, and 9 was obtained as much as 413.4 mg/ml, equivalent to 2.29 units (Fig 8). Results of chromatographic separation using Sephadex G50 obtained the inulinase activity in the first peak and moved out first because its molecular size was larger than the pores of the gel. The second peak has no inulinase activity and protein allegedly positioned at 25 kDa.
Figure 8. Patterns of protein and activity of fractions after chromatographic separation usingSephadex G50 column
SDS-polyacrylamide gel electrophoresis result of the protein from the active fractions of Sephadex G50 gel chromatography column showed the persistence of the two adjacent stains. Separation of both types of proteins was accomplished by ion exchange chromatography column with a matrix of DEAE cellulose which positively charged at pH below 9. This positive charge bound negatively charged proteins in the inulinase molecules. Inulinase having pH of about 5 negatively charged at pH below 9.
Protein content measurement of the fraction results of ion exchange chromatography showed two major peaks. The data were consistent with results of previous electrophoresis (Fig. 8), where the G50 gel filtration fraction results left two stains. Inulinase activity was shown at the second peak (Fig. 9), which was 435mg/ml or equivalent to 2.42 units with a protein content of 1.41mg/ml. This fraction electrophoresis showed one major stains, but there was still a thin shadow stain nearby. Thus, inulinase fromA. clavatus Gmn11.3 was estimated to have two sub-units.
Figure 9. Patterns of protein and activity of fractions after ion exchange chromatographic separation using DEAE cellulose column
Separation of the two adjacent protein resulted from purification using Sephadex G50 was continued with DEAE-Toyopearl matrix chromatography. The chromatogram showed that there were four protein peaks (Fig. 10), where
0
0.05
0.1
0.15
0.2
0.25
-0.01
0.01
0.03
0.05
0.07
0.09
0.11
0.13
0.15
1
3
5
7
9
11 13 15 17 19 21
A
ct
ivi
ty
(m
g
re
d
u
ci
n
g
su
gar
/m
l)
A
b
sor
b
an
ce
at
280n
m
No. fraction tubes
Absorbance at 280 nm
Activity (mg reducing sugar/ml)
0
0.1
0.2
0.3
0.4
0.5
0.6
0.7
0.8
0.9
0
0.01
0.02
0.03
0.04
0.05
0.06
0.07
0.08
0.09
1 4 7 10 13 16 19 22 25 28 31 34 37 40 43 46
Activ it y ( m g r ed u ci n g s u g a r/ m l) A b so rb a n ce a t 2 8 0 n m
No. fraction tubes
inulinase activity was obtained at the third and fourth adjacent peak, so that this enzyme was thought to consist of two subunits. However, there was also a possibility that this fraction was composed of two types of inulinase. Nakamura et al.[21]Reported the existence of two types of inulinase of Aspergillus niger mutant 817 with a molecular weight of 70 kDa and 68 kDa. Whilst Gupta et al.[37] found that there were four types of inulinase produced by Fusarium oxysporumwhich each had different properties, such as pH optimum, Km values, and thermal stability.
Figure 10. Patterns of protein and activity of fractions after ion exchange chromatographic separation using DEAE Toyopearl column
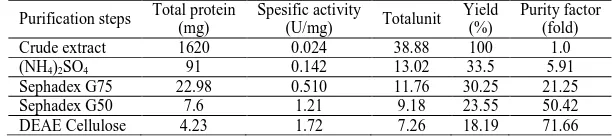
[image:9.595.149.461.155.330.2]Based on all the purification steps that had been made, the protein content and enzyme activity were resumed in Table 2. The purity increased as the terrace purifications were stepped and it reached 71.66 fold after being purified with DEAE Cellulose matrix.
Table 2. Purification steps and its effects on protein content and enzyme activity
Purification steps Total protein
(mg)
Spesific activity
(U/mg) Totalunit
Yield (%)
Purity factor (fold)
Crude extract 1620 0.024 38.88 100 1.0
(NH4)2SO4 91 0.142 13.02 33.5 5.91
Sephadex G75 22.98 0.510 11.76 30.25 21.25
Sephadex G50 7.6 1.21 9.18 23.55 50.42
DEAE Cellulose 4.23 1.72 7.26 18.19 71.66
Determination of inulinase molecular weight by SDS-PAGE electrophoresies
SDS-PAGE was performed on all stages of the purification of the enzyme. To determine the molecular weight of the purified enzyme, standard proteins was used and followed by the curve of % migration versus log molecular weight. Total length of gel used was 6 cm while samples inulinase moved on the gel as far as 1.6 cm and 1.7 cm, so that the migrationswere26.6% and 28.3% respectively (Fig. 11). If the percent migration of enzyme samples was plotted on a standard curve,the molecular weightswere obtained of 65.2 kDa and 62.4 kDa. Inulinase molecular weight resulted from various microbes appearedto bedissimilar one to others. Inulinase produced by Aspergillus species generally showed the nearly molecular weight. Nakamura et al. [21] found endo- and exo-inulinase of Aspergilllus niger mutant 817 having a molecular weight of 68 kDa and 70 kDa respectively. Fawzi[34], discovered an enzyme of
Aspergillus foetidus NRRL 337 and Thielavia terrestris NRRL 8126with molecular weight of 78 kDa and 70 kDa
respectively.
[image:9.595.151.458.420.488.2]Figure 11. SDS-Page electrophoresis of inulinase fromA. clavatus Gmn11.3, 1= standard 20 µl, 2=DEAE-celluloseion exchange chromatography, 3= 1st peak of DEAE-Toyopearl, 4= 2nd peak of DEAE-Toyopearl, 5 and 6= 3rd peak of DEAE-Toyopearl, 7 and 8= 4th
peak of DEAE-Toyopearl.
Figure 12.Lineweaver-Burk curve of inulinase from A. clavatusGmn11.3 with pure inulin as substrate
Lower Km and higher Vmax indicated that this enzyme had a high reactivity. Km value of A. clavatus Gmn11.3 inulinasewas smaller than inulinase from Bacillus substilis 430A that is equal to 8mM[38]. On the other hand, Nakamura et al. [21]reported Km of inulinasefromA. nigermutant 817 was 0.48mM. It showed that the lower value of Km inulinase of A. clavatusGmn11.3 meaning that this enzyme had a higher specificity towards their substrate compared with inulinase from Bacillus substilis 430A and inulinase from A. niger Mutants 817.
0
0,5
1
1,5
2
-0,3
0,1
0,5
0,9
1,3
1,7
[image:10.595.144.484.346.516.2]Figure 13.Lineweaver-Burk curve of inulinase from A. clavatusGmn11.3 with dahlia tubers extract as substrate
CONCLUSION
Inulinase production was carried out using the best inducer; 1% inulin in a medium containing 0.05% MgSO4.7H2O;
0.015% FeSO4; 0.2% NaCl, 0.05% KCl, and 1.0% yeast extract at 370C, pH 4.5, and 5 days incubation (120
hours).The crude extract of extracellular enzyme was purified by ammonium sulphate precipitation, followed by Sephadex G75 and G50 gel filtration, DEAE cellulose and DEAE-Toyopearl anion exchanger-column chromatography. The purity of extracellular enzyme was monitored using SDS PAGE. Inulinase purity increased 5.91 fold after ammonium sulphate-fractionation, and 71.66 fold after purification using gel filtration-column chromatography and ion exchange-column chromatography. Inulinase from A. clavatus Gmn11.3 showed higher
affinity than to its substrates with Km 0.078 mM and 0.039 mM, and Vmax were 0.098 mM/h and 0.041 mM/h
respectively at optimum pH 5.0; temperature 500C at four hours-incubation time; and its molecular weight were
estimated to be 65.2 KDa and 62.4KDa. Whilst inulinase from A. niger Gmn11.1, as a comparison, had a Km and
Vmax value 0.021 mM and 0.022 mM/h respectively at optimum pH 4.6; temperature 450C with 15 hours incubation
time; and its molecular weight was estimated to be 63 KDa.
REFERENCES
[1] Pandey A; Soccol CR; Selvakumar P; Soccol VT; Krieger N; Fontana JD. ApplBiochem Biotech, 1999, 81(1), 35-52.
[2] Rocha JR; Catana R; Ferreira BS; Cabral JMS; Fernandes P. Food Chem, 2006, 95,77–82. [3] Gill PK; Manhas RK; Singh P. J Food Eng, 2006, 76, 369-375.
[4] Nakamura T; Hoashi S. Nippon NogeikagakuKaishi, 1969, 43, 599-605. [5] Kalil SJ; Maugeri-Filho F; Rodrigues M. Process Biochem, 2005, 40, 581-586.
[6] Haraguchi K; Kishimoto M; Seki K; Kobayashi S; Kainuma K. AgricBiolChem, 1988, 52, 291-292. [7] Kawamura M; Takahashi S; Uchiyama T. AgricBiolChem, 1988, 52, 3209-3210.
[8] Yokota A; Enomoto K; Tomita F. J Ferment Bioeng, 1991, 72, 262-265. [9] Haraguchi K; Yamanaka T; Ohtsubo K. CarbohydPolym, 2002, 52, 117-121. [10] Kang S; Kim W; Chang Y; Kim S. Biosci Biotech Biochem, 1998, 62, 628-631.
[11] Sévenier R; Hall RD; van der Meer I; Hakkert HJ; van Tunen AJ; Koops AJ. Nature Biotechnol, 1998, 16, 843– 846.
[12] Saryono S; Reginawati H. UNRI Press, Pekanbaru, 2009, 7-8. [13] Vandamme EJ; Derycke DG. AdvApplMicrobiol, 1983, 29, 139-176.
[14] Saryono; Chainulfiffah AM; Soekartadiredja EM; Supriatna; Hadiman.Seri KajianIlmiahUnikaSoegijapranata,
1999, 9(2), 1-10.
[15] Saryono; Atria M; Chainulfifah AM. Jurnal Natur Indonesia, 2002, 4(2), 171-177. [16] Byun SM., BH.Nahm.J Food Sci, 1978, 43, 1871-1873.
[19] Gupta AK; Rathore P; Kaur N; Singh R. J Chem Tech Biotech, 1990, 45(1),245-251. [20] Ai-Xia Li; Li-ZhongGuo; Wei-Dong Lu. World J MicrobBiot, 2012, 28(1): 81-89.
[21] Nakamura T; Nagatomo Y; Hamada S; Nisino Y; Ohta K. J Ferment Biotech, 1994, 78(2), 134-139. [22] Chainulfiffah AM; Jhon S; Saryono. LembagaPenelitianUniversitas Riau, Pekanbaru, 2000, 3-4. [23] Kumar GP; Kunamneni A; Prabhakar T; Ellaiah P. World J MicrobBiot, 2005, 21: 1359-1361. [24] Kaur N; ;Kaur M; Gupta AK; Singh R. J Chem Tech Biotech, 1992, 53,279-284.
[25] Gao J; Chen L; Yuan W. J BioSci Biotech, 2012, 1(2), 155-161.
[26] Cruzguerrero A; Garciapena I; Barzona E; Garciagaribay M; Gomezruiz L. J Ferment Bioeng, 1995, 80(2), 159-163.
[27] Mahmoud DAR; Mahdy EME; Shousha WG; Refaat W; Abdel-Fattah AF. J Basic ApplSci, 2011, 5, 453-462. [28] Jing W; Zhengyu J; Bo J; Augustine A. Process Biochem, 2003, 39, 5-11.
[29] Sridhar J; Eiteman MA; Weigel JW. Appl Environ Microb, 2000, 66(1), 246-251.
[30] Smith JE. Biotechnology, Studies in Biology, 3rd edition, Cambridge University Press, Cambridge, 1997, 60.
[31] Sivakumar T; Shankar T; Vijayabaskar P; Ramasubramanian V. Academic Journal of Plant Sciences, 2012, 5 (3), 102-109.
[32] Meenakshi S; Umayaparvathi S; Manivasagan P; Arumugam M; Balasubramanian T. Indian Journal of
Geo-Marine Sciences, 2013. 42(4), 510-515.
[33] Tinrat S; Wongsariya K; Chomnawang MT. Isolation of a Novel Inulinase Producing Bacteria from Soil, Proceeding on The 8th International Symposium on Biocontrol and Biotechnology, Bangkok, 2010, 62-67.
[34] Fawzi EM. Braz J Microbiol, 2011 , 42(2), 633–649.
[35] Ayyachamy MK; Khelawan D; Pillay KP; Singh S. Lett ApplMicrobiol, 2007, 45, 439-444.
[36] Determann H. Gel Chromatography, A Laboratory Handbook, 2nded, Springer–Verlag,
Berlin-Heiddelberg-New York, 1969.