Journal of Chemical and Pharmaceutical Research, 2015, 7(12):354-362
Research Article
CODEN(USA) : JCPRC5
ISSN : 0975-7384
The effect of milling process on acyclovir inclution complex with
beta cyclodextrin
Deni Noviza*, Dedi Afrianto, Erizal and Auzal Halim
Department of Pharmaceutics, Faculty of Pharmacy, Andalas University, Kampus Unand Limau Manis
Padang, Indonesia
_____________________________________________________________________________________________
ABSTRACT
Acyclovir (ACV) is an antiviral drug used for the treatment of herpes simplex virus infection (HSV) and varicella zoster virus infection (VZV). One of the problems in acyclovir formulation is low solubility in water. The objective of this study is to find out the influence of milling time toward inclusion complex’s character that being formed between ACV and β-cyclodextrin (β-CD). The milling process used ball mill with variation of time in 1 hour, 3 hours, 6 hours. Preparation of inclusion complex used kneading method in 1:1 molar ratio. The characters of ACV-
β-CD inclusion complex observed by using X-ray Powder Diffraction (XRD), Differential Thermal Analysis (DTA), Fourier Transform Infra-Red (FTIR), Scanning Electron Microscopy (SEM) and dissolution profile. In the dissolution profile observed a decreasing of dissolution rate on milled ACV inclusion complex compared with ACV inclusion complex without milling. Milling process create aggregation which is decreases the dissolution rate of inclusion complex.
Keywords: acyclovir, β-cyclodextrin, milling, kneading, inclusion complex.
_____________________________________________________________________________________________
INTRODUCTION
Acyclovir (ACV) (9-[(2-hydroxy-ethoxy)methyl]-9H-guanine) is an acyclic guanine nucleoside analog that lacks a 3¢-hydroxyl on the side chain. The discovery and development of acyclovir, approved in 1982, provided the first effective treatment for less severe Herpes Simplek Virus and Varisella Zoster Virus infections in ambulatory patients. ACV is the prototype of a group of antiviral agents that are phosphorylated intracellularly by a viral kinase and subsequently by host cell enzymes to become inhibitors of viral DNA synthesis. [1,2]
The solubility of a poorly soluble drug can be altered in many ways, such as modification ofdrug crystal forms, addition of co-solvents, addition of surfactant, and complexation withcyclodextrin etc. Among these possibilities the cyclodextrin approach is of particularinterest.[3,4].ACV is very sparingly soluble in water [2]. The poor solubility of ACV give rise to difficulties in pharmaceutical formulation meant for oral or parental use, which may lead to variation in bioavailability. To overcome these difficulties, increase in the aqueous solubility of ACV is an
important goal hence in this investigation inclusion complexation of ACV was tried with β-cyclodextrin (βCD) with
the aim to improve its pharmaceutical properties (i.e. aqueous solubility and dissolution properties).
Cyclodextrin are cyclic (α-1, 4)-linked oligosaccharides of α-D-glucopyranose, containing a relatively hydrophobic
complexes with a variety of drug molecules. Cyclodextrin are used to increase the solubility of water insoluble drug through inclusion complexes formulation [3,5].
The previous studies on the inclusion complex of ACV has been carried out by Tomar et al. (2010). It about the
increased solubility of acyclovir used solid dispersion method and the inclusion complex with β-siklodektrin using
kneading method. In this study it was found that the inclusion complexes of ACV with β-siklodektrin can increase
the solubility of ACV unsignificantly.[6]
In this study, an attempt was made to improvethe solubility and dissolution rate of ACVby milling the ACV used
ballmill method and thancomplexing with β-Cyclodextrin, therebyincreasing its bioavailability and
therapeuticsefficiency.The complex of ACV with βCD was prepared by using Physicalmixture, andkneading
method at1:1 stoichiometric ratio. Thecharacterization of drug with β-CDusing differential Thermal
Analysis(DTA), powder X-ray diffractometry (PXRD)and FTIR, dissolution rate profile of complexes wereperformed.
EXPERIMENTAL SECTION
Materials
Acyclovir was received from PT. Sampharindo, Jakarta, Indonesia, as a gift sample. β- siklodekstrinpurchase from
PT. Sigma Husada. All the reagents and solvent were analytical grade and distilled water was used.
Phase Solubility Study
Phase solubility studies were carried out according to the method reported by Higuchi and Connors. An excess of
ACV (200 mg) was added to 25 ml portions of distilledwater, each containing variable amount of β -CD such as 0,
2, 4, 6, 8, and 10 x 10-3 moles/liter. All the above solutionswith variable amount of β -CD were shaken for 72 hours.
After shaking, thesolutions were filtered and their absorbancewas noted at 251,8 nm. The solubility of the ACV in β
-CD solution was calculated and phase solubilitydiagram was drawn between the solubility of ACV and different
concentrations of β -CD.[3,7]
The milling of ACV
Milling process of ACV using a Ball Mill (Pascal® L9FS) with variations in time of 1 hour, 3 hours, and 6 hours at 100 rpm.
Preparation of Complexes with β-CD
Physical Mixture
ACV with β -CD in 1:1 molar ratios were mixed in a mortar for about one hour with constant trituration, passed
through sieve No. 100 and stored in a desiccators over fused silica gel.
Kneading method
ACV with β -CD in 1:1 molar ratios were taken. First cyclodextrin is added to the mortar, small quantity distilled
water is added while triturating to get slurry like consistency. Then slowly drug is incorporated into the slurry and
trituration is further continued for one hour. Slurry is then air dried at 45oC for 24 hours, pulverized and passed
through sieve No. 100 and stored indesiccators over fused silica gel.For treatment 1 (F1) used ACV without grinding, treatment 2 (F2) is used ACV by milling 1 hour, treatment 3 (F3) is used ACV bymilling 3 hours, and treatment 4 (F4) is used ACVby milling 6 hours.[6,8]
Drug Content Estimation
50 mg of complex was accurately weighed and transferred to 100 ml volumetric flash and volume was made up to the mark with NaOH 0.1 N. From this 5 ml was taken in 50 ml volumetric flash and volume is adjusted up to the mark with same solvent. From this 5 ml was taken in 25 ml volumetric flash and volume is adjusted up to the mark with same solvent. The adsorbance of the solution was measured at 264.4 nm using appropriate blank. The drug content of ACV was calculated using calibration curve.
DifraksiSinar-X
The powder X-RD patterns of drug, β-CD, and complexes were recorded by using XRD X’pert Powder dy3688 with
filter Cu radiation over the interval 5-35°/2θ. The operation data were as follows: voltage 40 kV, current 20 mA,
Differential Thermal Analysis (DTA)
The samples were analyzed by DTA using Perkin Elmer system. The sample were placed into pierced aluminum container. The studies were performed understatic air atmosphere in the temperature range of 30°C to 300°C at a heating rate of 10°C/min. The peak temperatures were determinedafter calibration with standard.
Fourier Transform Infrared (FTIR)
The IR spectra of ACV and their complexes were obtained by KBr pellet method by Perkin Elmer Spectrophotometer.The scanning range was 400-4000 cm-1,resolution was 4 cm-1.
Scanning Electron Micrcoscopy(SEM)
Analysis was conducted on ACV, milling product, β-cyclodextrin, physical mixtures and inclusion complexes of
each formula. Its were placed on the aluminum sample holder and coated with gold with a thickness of 10 nm. The Voltage is set at 20 kV and current 12 mA.
In-Vitro Dissolution Studies
The dissolution of ACV inclusion complexes was perpormed to evaluate ACV release profiles. The dissolution patterns of the complexes werecompared with those of pure drug. Thedissolution studies were performed on the USP dissolution appatarus type II. The sample, corresponding to 50mg of ACV, were placed into hard gelatincapsules. The dissolution medium was 900mlof HCl 0.1 N than containing sodium Lauryl sulfate0,5% b/v. The stirring speed of the paddle was 50 rpm, and the temperaturewas maintained at 37°C ± 0.5°C. at fixed time interval (5, 10, 15, 30, and 45 min), 5 ml aliquots were withdrawn and equal volumes of fresh medium were replaced. The samples were filtered through whattmanfilter paper and analyzed by UV spectrophotometer at 255.8 nm.[6,11]
RESULTS AND DISCUSSION
Phase Solubility
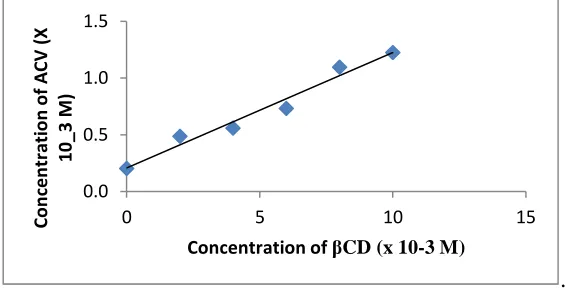
The phase-solubility diagram for the complex formation between ACV and β-CD presented in fig 1. This plot
showed that the aqueous solubility of drug increase linearly as a function of β-CD concentration. The phase
solubility diagram can be classified as type AL according to Higuchi and Connors. It is assumed that the increase in solubility observed was due to the formation of a 1:1 M inclusion complex. The solubility constant (Kc) was calculated from the slope of the linear plot of the phase solubility diagram according to equation,
Where Sois the solubility of the drug in absence of CD. The calculated Kc value was 510,15Mrespectively.
[image:3.595.164.447.540.688.2].
Fig. 1. Phase Solubility Diagram of ACV with β-CD
X-Ray Diffractometry
X-ray diffraction pattern of ACV showed a high degree of crystallinity due to the height and sharp peaks. This is 0.0
0.5 1.0 1.5
0 5 10 15
C o n ce n tr at io n o f A C V ( X 1 0 _ 3 M )
to the formation of polymorphs ACV due to the instability of energy during the grinding process so that the conditions and crystal structure of ACV changed compared with ACV without milling.[12]
F1 inclusion complexes diffractogram pattern showing crystalline form mixed with amorphous. In the diffractogram
showed a sharp decrease in the intensity of the acyclovir in the diffraction angle 2θ = 21.06. The diffractogramof F4
inclusion complexes also showed a sharp decrease in the intensity of ACV at a diffraction angle 2θ = 23,97º.
However, there was a sharp increase in intensity at 2θ = 12,71º.The diffractogramof physical mixture show a
[image:4.595.136.446.186.393.2]decrease in the intensity of the diffraction also at 2θ = 26,19º.
Fig. 2. XRD Spectra of ACV (A), ACV grinding 1 hour (B), ACV grinding 3 hour (C), ACV grinding 6 hour (D), β-CD (E), inclution complex F1 (F), inclution complex F4 (G), physical mixture (H)
Differential Thermal Analysis (DTA)
DTA thermogramof ACV exhibit an endothermic transition between 165,7ºC and 176,7ºC corresponding to its melting point 154.1 ° C (Fig. 3). The thermograph of ACV milling showed several endothermic peak (Fig. 4). This is due to the formation of ACV polymorphs that related to the instability of energy during the milling process and the conditions and crystal structure of ACVhas changes. Based on the previous research, it is known that the drug is a polymorph that containhydrate form with a ratio between ACV with water molecules by 3: 2 in the crystal structure and in two anhidrat form with a ratio of 1: 2 [13].The DTA thermogramof inclusion complexes F1 and F4 (Fig. 5, 6)showed a slight shift in peak into lower temperature,which indicates the present of ACV molecule inside
the βCD cavity.[12]
[image:4.595.146.449.541.723.2]Figure 4.DTA thermogram of ACV milling 6 hour
[image:5.595.157.457.287.711.2]Figure 5. DTA thermogramof F1
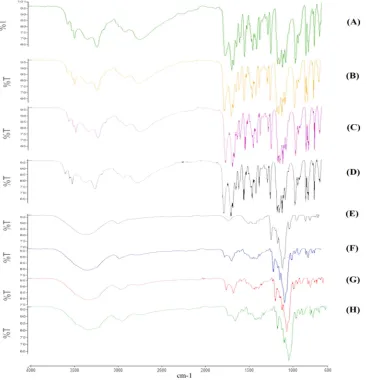
Fourier Transform Infrared (FTIR)
FTIR spectroscopy is used to estimate the interantioan betweenβCD and ACV in the solid state.The FTIR
spectrashowed ashift of adsorbance bands of C-O, C=C, O-H and C-O stretching to higher frequency, its indicating
[image:6.595.130.496.139.521.2]weak interaction between ACV and βCD.[12]
Fig. 7. FTIR Spectrum of ACV (A), ACV milling 1 hour (B), ACV milling 3 hour (C), ACV milling6 hour (D), β-CD (E), inclution complex F1 (F), inclution complex F4 (G), physical mixture (H)
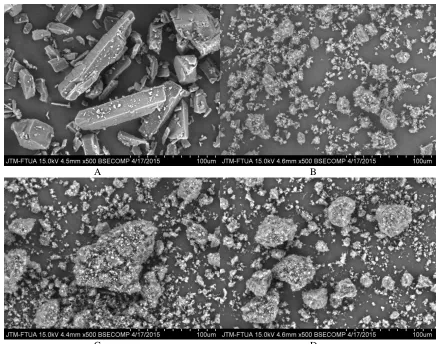
Scanning Electron Micrcoscopy(SEM)
SEM results of ACV (Fig. 8a) shows a basil crystal form. In the ACV was milled for 1 hour the formation of aggregateswas observe (Fig. 8b). Similarly, in the ACV was milled for 3 hours (Fig. 8c). and6 hours (Fig. 8d) aggregates formed more numerous and larger than was milled for 1 hour. This is because the energy required to reduce the particle size increased van der Waals interactions and electrostatic power between the particles (Spence,
et al., 2005).Where β-CD morphology exhibite a stem irregular form as shown in Fig. . In physical mixtures and
A B
[image:7.595.86.529.68.412.2]C D
Figure 8. SEM ficture of ACV (A), ACV milling 1 hour (B), ACV milling 3 hour (C), ACV milling 6 hour (D)
[image:7.595.198.412.437.601.2]A B
C D
Figure 10.SEM Ficture of F1 (A), F2 (B), F3` (C), F4 (D)
Drug Content Measurements
The ACV content in physical mixture, the inclusion complex F1, F2, F3, and F4 are respectively 99,13%; 96,73%; 98,57%; 98,84%; dan 97,53%
[image:8.595.125.487.491.707.2].
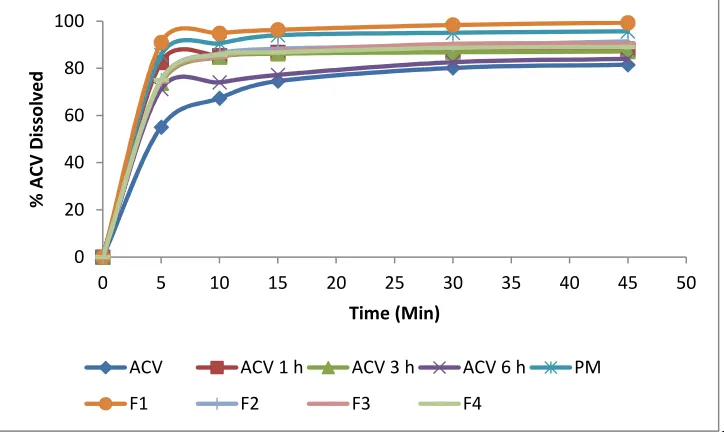
Figure 11.Dissolution studies of ACV, ACV milling 1, 3, 6 hours, F1, F2, F3, F4 and physical mixture 0
20 40 60 80 100
0 5 10 15 20 25 30 35 40 45 50
%
A
C
V
D
is
so
lv
e
d
Time (Min)
ACV ACV 1 h ACV 3 h ACV 6 h PM
In-Vitro Dissolution
Figure 11.shows the cumulative dissolution profiles of ACV, physical mixtures, the inclusion complex F1, F2, F3, and F4 are respectively 81.53%; 95.67%; 99.53%; 91.4%; 90.53%; and 89.04%. Inclution complex F1 exhibited a faster dissolution rate than pure drug and other complexes. The milling process on ACV decreased the dissolution
rate of ACV that cpmplexed with βCD, the longer of the milling process, the rate of dissolution is getting smaller.
The milling process on ACV created aggregation and agglomeration of fine particles due to increased surface energy and Van der Waals forces between molecules to form agglomerates. [14]
CONCLUSION
The milling process to ACV causes the formation of aggregated that decrease the dissolution rate of inclusion complexes . The longer of milling process caused the lowest of dissolutionrate of ACV.
Acknowledgement
Financial support from the Institute for Research and Community Services of AndalasUniversity is acknowledgement.
REFERENCES
[1]LL Brunton, Goodman and Gilman’s The Pharmacological Basis of Therapeutics, 11th Edition, McGrow Hill,
NewYork, 2006
[2]SC Sweetman, Martindale. The Complete Drug Reference, 36th edition, Pharmaceutical Press, London, 2009,
862-864.
[3]N Maski; Arulkumaran, K Girhepunje; P Ghode; S Kumar; Randive; R Pal. Int. J. Pharmacy and Pharm.
Sci.,2009, 1(2),121-135
[4]RL Carrier; LA Miller; I Ahmed., J. Controlled Release, 2007, 123, 78-99.
[5]ME Brewster; T Loftsson, Adv. Drug Delivery Reviews,2007,59, 645-666.
[6]V Tomar;N Garud;P Kannojia;A Garud; NK Jain; N Singh, Scolars Research Library, 2010, 2(5), 341-352.
[7]T Higuchi; KA Connors, Adv. Anal. Chem. Instrm., 1965, 4, 117-212
[8]A Chaudhary; U Nagaich;N Gulati; VK Sharma; RL Khosa, J. Adv. Pharmacy Education & Research,2012,
2(1), 32-67.
[9]P Shirse; KS Rao; MM Iqbal, Int. J. Research in Pharmacy and Chemistry, 2012, 2(1), 222-229
[10]R Hirlekar; V Kadam, AAPS Pharm. Sci. Tech. 2009. 10: 276-281.
[11]United States Pharmacopoeia, The Official Compendia of Standards United States Pharmacopeia, 30thEdition–
National Formulary 25th edition, USP Convention,New York, 2007, 1300-1302.
[12]R Singh; N Bharti; J Madan; SN Hiremath, J. Pharm. Sci. and Tech, 2010, 2(3), 171-183
[13]KM Lutker; R Quinones; J Xu; L Hemandez; CV Plessing, J. Pharm. Sci.,2011,100, 949-963.
[14]JK Spence; SN Bhattachar; JA Wesley; SR Babu, Pharmaceutical Development and Technology, 2005,10,