© 2016, IRJET | Impact Factor value: 4.45 | ISO 9001:2008 Certified Journal
| Page 1821
An ISM-Based Analysis for Modelling Factors in Machine Shop for the
Implementation of Total Productive Maintenance (TPM)
Meghraj
1, Dr.SridharK
21
Department of Mechanical Engg. (Industrial Engg. & management) M.Tech Scholar
Chhatrapati Shivaji Institute of Technology, Durg, India
[email protected]
2
Professor in Mechanical Engineering, Chhatrapati Shivaji Institute of Technology, Durg, India
[email protected]
--- ***
---Abstract - Many organizations have implemented TPM to improve their equipment efficiency and to obtain the competitive advantage in the global market in terms of cost, quality and productivity. But, implementation of TPM is not an easy task. The objective of this paper is to analyze the barriers and implement TPM for improvement of machine. These Barriers can cause the problems of defects, minor stoppages, speed losses etc. Suitable tactics are given to overcome the issues by providing the necessary awareness, incentive systems, motivational action etc. This system is not only used in large scale manufacturing industry but also in the medium as well as small scale manufacturing industry. The certain Barriers are sorted out which hamper the continuous flow of production in the plant, and also we tried to eliminate these Barriers first by prioritizing all the chosen Barriers which is affecting the process most number of times with help of ISM. To analyze the driving power and dependence power of barriers MICMAC analysis is performed. On the basis of MICMAC clusters the TPM pillars is implemented to improve the performances of machines in the machine shop.
Key words: Total Productive Maintenance (TPM), Barriers, MICMAC analysis.
1.
INTRODUCTION
In this 21st century manufacturing industries based on the
automated machine and equipment and minimize the human interference. Maintenance in the past was not familiar to industries or organization, since its manifestation in 1930 till now. In any organization Quality and Maintenance of manufacturing systems are closely related functions. With the change in time two concepts have emerged which are Total Productive Maintenance (TPM) and Total Quality Management (TQM) along with other concepts to achieve World Class Manufacturing
system [1]. It has been noticed that, there has been a drastic change in the manner in which industry works many years ago and now. Due to the improvement in the technology, you can see all the areas of industry have been developed.
To improving the performance of maintenance activities in the plant is to implement Total Productive Maintenance (TPM) strategy. However number of organizations is failing to successfully implement such strategies [2]. Implement of TPM help to find out the bottleneck machine in the cell layout and increase the productivity which can be obtained by them through the analysis barriers for low OEE. Considering all the parameter of TPM become beneficial to sort of the various problems linked with the production. To achieve this target, efficient maintenance was in place, Autonomous maintenance teams were developed for better communication and team-work was promoted. Finally it results improve in Availability, Performance and Quality due to which OEE accelerate [3].
1.1 Role of Management in TPM
The main role of TPM is to use the TPM Pillars to deliver improvement. However in the organization management should ensure that pillars are applied correctly and at right time. The continuous practices of TPM Pillars lead to reduce the breakdowns and other major problems.
To achieve the levels of activity from management:
1. Decide Priorities
2. Create a structure to Manage and Control TPM
© 2016, IRJET | Impact Factor value: 4.45 | ISO 9001:2008 Certified Journal
| Page 1822
2.
LITERATURE REVIEW
To improve the performance and quality need to implement TPM which is not an easy task. By preparing certain questionnaires based on survey an interpretive structural modelling (ISM) approach has utilized in analyzing their mutual interaction. The first course of action is to find out problem and establish a strategic direction for TPM. An ISM model has prepared to identify some key factors and the implementation of TPM. The ISM model developed in this paper acts as a tool for top management to understand/identify the key factors of TPM implementation.ISM model help to identify and rank the factor with help to sort out the major problem. This model has been developed on the basis of consensus of experts and the employees, the results are quite generic and helpful for top management to keep efforts towards the successful implementation of TPM in their organizations [4]. The author (Fatemeh kahrarian [5]) surveyed the barriers to recognize the major barriers that significantly affect the performing of TPM in industries so that management may perform TPM in their organizations in better way. An ISM-based model has been developed to analyze the interactions among different TPM enablers. It identifies the important of any organization on which management should focus for the performing of TPM to eliminate barriers. ISM-based model provides a very useful explanation of the relationships among the factors and information for the formulation of guidelines to improve the quality of maintenance activities [6].
Frequent machine breakdowns, low plant availability, increased rejection are a great threat to increase operating and maintenance cost. The company has to suffer due to lower availability of machines the performance rate also decreases as a result of breakdowns which may leads to possess extra cost during the production [7].
TPM pillars were used to short out major losses in the plant and the results show improvements in machine utilization and OEE for identified critical equipment [8]. TPM is a useful tool in helping firm to achieve optimal manufacturing process. The level of maintenance, an organization will be able to reap competitive advantages brought by TPM [9].
3.
PROBLEM IDENTIFICATION
The data are collected from machine shop (MARS-1) of Bhilai Steel Plant (BSP), Bhilai Chhattisgarh. MARS-1 has a vital role to play in maintaining the plant equipment so for as it supplies the bulk no. of spare parts required by the various units of plant. It acquires an added importance by virtue of the finishing line of manufacturing activities of machine shop. The product mix so arranged so as to meet the demand of both heavy and small spares. In this machine shop due to improper planning & improper identification of problems leads to uncontrollable production losses & increase in waste and unnecessary operation which results in customer complaints (other department). Sometimes material handling system like crane is not available due to which machine remains idle.
4.
METHODOLOGY
After 1 month analysis of machines in machine shop of manufacturing industry some of the barriers are sorted out and on the basis of the analysis 10 main barriers are selected and ISM approach have been used and then TPM pillars is implemented to achieve the objectives of this research. The methodology employed to identifies the existing operations in the facilities with the help of detailed study and project training. Further root cause barriers are pointed out to reduce unproductive time and to increase the overall equipment effectiveness and efficiency of the existing system.
These methodologies and their respective results are discussed in the following sections.
4.1
Barriers
Some of the barriers where sorted out by the analysis of machine during the working shift of the machine, which majorly effecting the machining work of the machine and cause unproductive time which leads to delay in finishing the machining work of the job and ultimately it become burden to entire department of machine shop.
© 2016, IRJET | Impact Factor value: 4.45 | ISO 9001:2008 Certified Journal
| Page 1823
3. Need for training4. Issues in design modification 5. Lack of flexibilities
6. Lack of board organizational involvement 7. Poor communication system
8. Unavailability of equipment parts 9. Conflicts with interdepartmental 10. Frequent changes in design 11. Longer lead time
12. Organization resistance to change 13. Work culture
14. Inability to plan design change or replacement maintenance.
4.2
An ISM approach for modeling of Barriers
ISM is a qualitative tool that was developed by J. Warfield to find the complex comprehensive systematic model [10]. The ISM methodology is interpretive from the fact that as the judgment of the group decides whether the variables are related or not. It is structural model, as on the basis of relationship; an overall structure is developed from the complex set of variables. It is a modelling technique in which the specific relationships of the variables and the overall structure of the system under consideration are portrayed in a digraph model. The model so formed portrays the structure of a complex issue or problem in a carefully designed pattern implying graphics as well as words (Raj et al. [11]; Singh et al. [12]; Ravi and Shankar [13]). The fundamental idea obtain from ISM modelling for converting the complex factors into several sub factors by utilization of realistic knowledge and experience of experts[14].
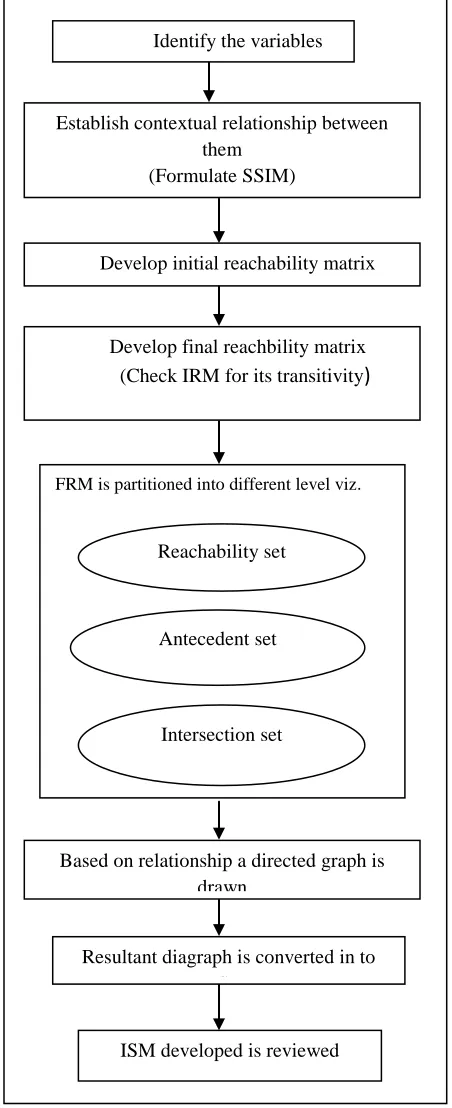
[image:3.612.325.551.128.682.2]The various steps involved in ISM modeling are as follows.
Fig -4.1: Steps involved in ISM modeling Identify the variables
Establish contextual relationship between them
(Formulate SSIM)
Develop initial reachability matrix
Develop final reachbility matrix (Check IRM for its transitivity
)
FRM is partitioned into different level viz.
Reachability set
Intersection set Antecedent set
Based on relationship a directed graph is drawn
Resultant diagraph is converted in to ISM
© 2016, IRJET | Impact Factor value: 4.45 | ISO 9001:2008 Certified Journal
| Page 1824
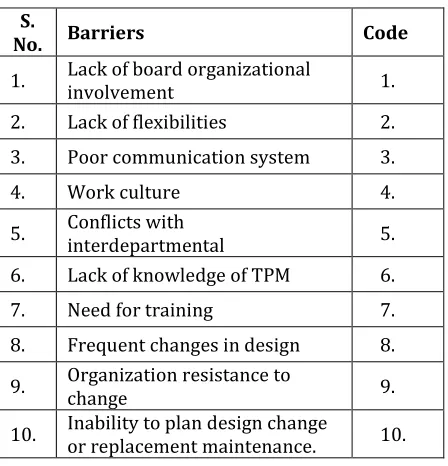
For further improvement in the machine shop ofmanufacturing industry different barriers are found. ISM method is applied to improve the continuous flow production-Table 4.1 shows barriers for TPM implementation in machine shop industry is coded. To arrive the contextual correlation of barriers for TPM implementation ISM model is developed.
Table -4.1: Barriers (Factors) for TPM implementation in machine shop
S.
No. Barriers Code
1. Lack of board organizational
involvement 1.
2. Lack of flexibilities 2.
3. Poor communication system 3.
4. Work culture 4.
5. Conflicts with
interdepartmental 5.
6. Lack of knowledge of TPM 6.
7. Need for training 7.
8. Frequent changes in design 8.
9. Organization resistance to change 9.
10. Inability to plan design change or replacement maintenance. 10.
4.2.1 Structural Self-Interaction Matrix
For analyzing the barriers, a contextual relationship of leads to or influences type is chosen. This means that one barrier influences another barrier. On the basis of this, contextual relationship between the identified barriers is developed.
1. V for the relation from barrier i to barrier j (i.e., barrier i will influence barrier j)
2. A for the relation from barrier j to barrier i (i.e., barrier i will be influenced by barrier j)
3. X for both direction relations (i.e., barriers i and j will influence each other)
4. O for no relation between the barriers (i.e., barriers i and j are unrelated).
Based on the contextual relationships, the SSIM is developed. To obtain consensus, the SSIM was further
[image:4.612.321.573.168.388.2]discussed by a group of experts and analysis. On the basis of their responses and analysis, SSIM has been finalized and it is presented in Table 4.2
Table -4.2: Structural Self Intersection Matrix (SSIM)
4.2.2 Reachability matrix
The SSIM is transformed into a reachability matrix format by transforming the information in each entry of the SSIM into 1s and 0s in the reachability matrix. The substitution of 1s and 0s are as per the following rules:
1. If the (i, j) entry in the SSIM is V, then the (i, j) entry in the reachability matrix becomes 1 and the (j, i) entry becomes 0.
2. If the (i, j) entry in the SSIM is A, then the (i, j) entry in the matrix becomes 0 and the (j, i) entry becomes 1.
3. If the (i, j) entry in the SSIM is X, then the (i, j) entry in the matrix becomes 1 and the (j, i) entry also becomes 1.
4. If the (i, j) entry in the SSIM is O, then the (i, j) entry in the matrix becomes 0 and the (j, i) entry also becomes 0.
Following the below rules, the initial reachability matrix is prepared and is shown in Table 4.3
BARRIERS 10 9 8 7 6 5 4 3 2 1
1. X V O V V O O O V
2. A A A A X O O O
3. O O O A A V X
4. O A X A A X
5. O O O A A
6. V V A V
7. A A X
8. A O
9. X
[image:4.612.31.255.237.470.2]© 2016, IRJET | Impact Factor value: 4.45 | ISO 9001:2008 Certified Journal
| Page 1825
Table -4.3: Initial reachability matrixThe next step of ISM is prepared the final reachability matrix. The initial reachability matrix is converted into final reachability matrix by using the transitivity principle. The transitivity principle shows that the factors A link from factor B and factor B link from factor C than the factor A should link from factor C [15]. It is shown in Table 4.4 with driving power and dependence power.
Table -4.4: Final reachability matrix
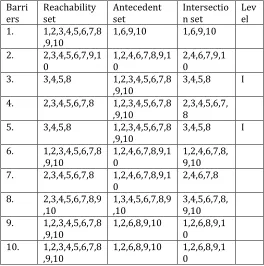
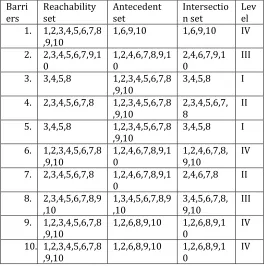
4.2.3 Partitioning the reachability matrix
To find out the levels of barriers it is required to partitioned matrix into the reachability set and antecedent set and interaction between them [10]. The four iterations in the ISM model are shown respectively, in the Table 4.5 – 4.8. The results of the four iterations in ISM model are amalgamated and shown in Table 4.9.
Table -4.5: First iteration to find levels of factors to implement TPM in machine shop
Table -4.6: second iteration to find levels of factors to implement TPM in machine shop
Barrie rs
Reachabilit y set
Antecede nt set
Intersect ion set
Lev el 1. 1,2,6,7,9,10 1,6,9,10 1,6,9,10 2. 2,6,7,9,10 1,2,6,7,9,
10
2,6,7,9,1 0
4. 2,6,7 1,2,6,7,9,
10
2,6,7 II
6. 1,2,6,7,9,10 1,2,6,7,9, 10
1,2,6,7,9, 10
7. 2,6,7 1,2,6,7,9,
10
2,6,7 II
8. 2,6,7,9,10 1,6,7,9,10 6,7,9,10 9. 1,2,6,7,9,10 1,2,6,9,10 1,2,6,9,1
0 10. 1,2,6,7,9,10 1,2,6,9,10 1,2,6,9,1
0 BARRIERS 1 2 3 4 5 6 7 8 9 10
1 1 1 0 0 0 1 1 0 1 1
2 0 1 0 0 0 1 0 0 0 0
3 0 0 1 1 1 0 0 0 0 0
4 0 0 1 1 1 0 0 1 0 0
5 0 0 0 1 1 0 0 0 0 0
6 0 1 1 1 1 1 1 0 1 1
7 0 1 1 1 1 0 1 1 0 0
8 0 1 0 1 0 1 1 1 0 0
9 0 1 0 1 0 0 1 0 1 1
10 1 1 0 0 0 0 1 1 1 1
Bar rier s
1. 2. 3. 4. 5. 6. 7. 8. 9. 10.
Driv ing pow er
1. 1 1 1T 1T 1T 1 1 1T 1 1 10
2. 0 1 1T 1T 1T 1 1T 0 1T 1T 8
3. 0 0 1 1 1 0 0 1T 0 0 4
4. 0 1T 1 1 1 1T 1T 1 0 0 7
5. 0 0 1T 1 1 0 0 1T 0 0 4
6. 1T 1 1 1 1 1 1 1T 1 1 10
7. 0 1 1 1 1 1T 1 1 0 0 7
8. 0 1 1T 1 1T 1 1 1 1T 1T 9
9. 1T 1 1T 1 1T 1T 1 1T 1 1 10
10. 1 1 1T 1T 1T 1T 1 1 1 1 10
Dep end enc e pow er
4 8 10 10 10 8 8 9 6 6
Barri ers
Reachability set
Antecedent set
Intersectio n set
Lev el 1. 1,2,3,4,5,6,7,8
,9,10
1,6,9,10 1,6,9,10
2. 2,3,4,5,6,7,9,1 0
1,2,4,6,7,8,9,1 0
2,4,6,7,9,1 0
3. 3,4,5,8 1,2,3,4,5,6,7,8 ,9,10
3,4,5,8 I
4. 2,3,4,5,6,7,8 1,2,3,4,5,6,7,8 ,9,10
2,3,4,5,6,7, 8
5. 3,4,5,8 1,2,3,4,5,6,7,8 ,9,10
3,4,5,8 I
6. 1,2,3,4,5,6,7,8 ,9,10
1,2,4,6,7,8,9,1 0
1,2,4,6,7,8, 9,10 7. 2,3,4,5,6,7,8 1,2,4,6,7,8,9,1
0
2,4,6,7,8
8. 2,3,4,5,6,7,8,9 ,10
1,3,4,5,6,7,8,9 ,10
3,4,5,6,7,8, 9,10 9. 1,2,3,4,5,6,7,8
,9,10
1,2,6,8,9,10 1,2,6,8,9,1 0
10. 1,2,3,4,5,6,7,8 ,9,10
[image:5.612.29.250.115.344.2] [image:5.612.318.582.232.498.2] [image:5.612.33.580.456.744.2]© 2016, IRJET | Impact Factor value: 4.45 | ISO 9001:2008 Certified Journal
| Page 1826
Table -4.7: Third iteration to find levels of factors toimplement TPM in machine shop
Table -4.8: Fourth iteration to find levels of factors to implement TPM in machine shop
Table -4.9: Levels of factors to implement TPM in machine shop
4.3 Development of ISM model
Hierarchy of the model is developed after identified the level of barriers. In this development, the top level enabler is positioned at the top of the digraph and second level enabler is placed at second position and so on, until the bottom level is placed at the lowest position in the digraph. Next, the digraph is converted into an ISM model by replacing nodes of the elements with statements as shown in Figure 4.3. The final reachability matrix represents the level of factors, Poor communication system, Conflicts with interdepartmental which occupy the first level in the matrix so it is represent in the top level of the hierarchy. Work culture, Need for training occupies the second level in the matrix so it represents the one step below in the hierarchy and so on. As per the relationship between the criteria i and j the direction of arrow is placed. ISM modelling highlights the main factors (barriers) of TPM in machine shop manufacturing industry require to more attention for tackle these barriers.
[image:6.612.30.298.129.229.2]
Fig -4.2: Digraph showing levels of TPM barriers Barrier
s
Reachabilit y set
Anteceden t set
Intersectio n set
Leve l
1. 1,9,10 1,9,10 1,9,10
2. 9,10 1,9,10 9,10 III
6. 1,9,10 1,9,10 1,9,10
8. 9,10 1,9,10 9,10 III
9. 1,9,10 1,9,10 1,9,10
10. 1,9,10 1,9,10 1,9,10
Barrier s
Reachabilit y set
Anteceden t set
Intersectio n set
Leve l
1. 1 1 1 IV
6. 1 1 1 IV
9. 1 1 1 IV
10. 1 1 1 IV
Barri ers
Reachability set
Antecedent set
Intersectio n set
Lev el 1. 1,2,3,4,5,6,7,8
,9,10
1,6,9,10 1,6,9,10 IV
2. 2,3,4,5,6,7,9,1 0
1,2,4,6,7,8,9,1 0
2,4,6,7,9,1 0
III
3. 3,4,5,8 1,2,3,4,5,6,7,8 ,9,10
3,4,5,8 I
4. 2,3,4,5,6,7,8 1,2,3,4,5,6,7,8 ,9,10
2,3,4,5,6,7, 8
II
5. 3,4,5,8 1,2,3,4,5,6,7,8 ,9,10
3,4,5,8 I
6. 1,2,3,4,5,6,7,8 ,9,10
1,2,4,6,7,8,9,1 0
1,2,4,6,7,8, 9,10
IV
7. 2,3,4,5,6,7,8 1,2,4,6,7,8,9,1 0
2,4,6,7,8 II
8. 2,3,4,5,6,7,8,9 ,10
1,3,4,5,6,7,8,9 ,10
3,4,5,6,7,8, 9,10
III
9. 1,2,3,4,5,6,7,8 ,9,10
1,2,6,8,9,10 1,2,6,8,9,1 0
IV
10. 1,2,3,4,5,6,7,8 ,9,10
1,2,6,8,9,10 1,2,6,8,9,1 0
IV
5
3
4
7
8
2
9
6
10
[image:6.612.62.545.372.679.2] [image:6.612.30.298.407.674.2]© 2016, IRJET | Impact Factor value: 4.45 | ISO 9001:2008 Certified Journal
| Page 1827
[image:7.612.37.584.50.515.2]
Fig -4.3: ISM model for barriers to TPM implementation
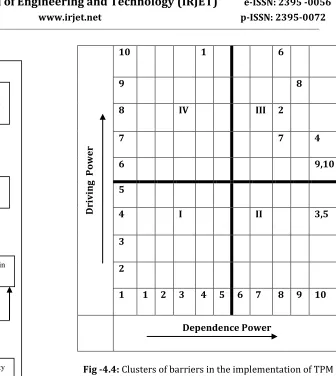
4.4 MICMAC Analysis
To find the driving power and dependence power of barriers for TPM implementation in machine shop MICMAC analysis is performed. This classification is similar to that by Mandal and Deshmukh [16]. The drive power and dependence power of barriers is shown in Table 4.4. The driving power and dependence power diagram is drawn as shown in Figure 4.4. This Figure has been divided into four clusters. First cluster includes ‘autonomous barrier’, second cluster includes ‘dependent barrier’, third cluster includes ‘linkage barrier’ and fourth cluster contains ‘independent barrier’.
D
rivin
g
P
ow
er
10 1 6
9 8
8 IV III 2
7 7 4
6 9,10
5
4 I II 3,5
3
2
1 1 2 3 4 5 6 7 8 9 10
[image:7.612.241.577.54.430.2]Dependence Power
Fig -4.4: Clusters of barriers in the implementation of TPM
I. Autonomous: These barriers have weak driving power but weak dependence power
II. Independent: These barriers have strong driving power but weak dependence power.
III. Linkages: These barriers have strong driving power as well as strong dependence power.
IV. Dependent: These barriers have weak driving power but strong dependence power.
4.5 Implementation of TPM
By the implementation of TPM we can reduce the losses and eliminate the root causes barriers so that machine does don’t require more time than actual time and thus Implementation of TPM is beneficial to the industry. Approach of these 8 pillars was suggested by the Japan Institute of Plant maintenance.
Poor communication
system (3)
Conflicts with interdepartmental
(5)
Lack of board organi zation al involv ement (1)
Organi zation resista nce to change (9)
Inability to plan design change or replacem
ent maintena
nce (10) Lack
of knowle
dge of TPM (6)
Lack of flexibilities (2) Frequent changes in design (8) Work culture (4) Need for training
[image:7.612.38.265.116.521.2]© 2016, IRJET | Impact Factor value: 4.45 | ISO 9001:2008 Certified Journal
| Page 1828
Fig-4.5: TPM Pillars (Nakajima Model) [17]
1. Autonomous Maintenance-This pillar is geared towards developing operators to be able to take care of small task maintenance activities, thus with the help of skilled maintenance people to spend time on and added valuable activities and technical repairs.
Some initiatives like- a. Initial cleaning b. Routine inspection
c. Understand the relation between productivity and maintenance.
d. Small maintenance work.
2. Focused Maintenance- The main is to achieve and sustain zero losses with respect to minor stoppage, measurement and adjustments, defects, barriers and un-avoided down times.
3. Planned Maintenance-It is aimed to produce defect free products for total customer satisfaction. It is an organized maintenance work carried out as per recorded procedures having control. It divided planned maintenance into 4 groups as
a. Preventive Maintenance b. Predictive Maintenance c. Breakdown Maintenance d. Corrective Maintenance
4. Quality Maintenance-Quality Maintenance aims to assure zero defects condition, based on the basic concept of maintaining the equipments in good condition to provide perfect quality products. Quality maintenance is an interaction between man, machine, job and the method in the industry.
5. Education and Training- Its is aimed to provide multi skills to employees, so that it raise morale and add value to the work and perform all required functions effectively and independently. Education and Training of the work is
an important factor which increases the working ability of the employees as well as increase the output of the industry.
6. Safety, Health &Environment- Focus on reduce the pollution, reduce the hazards, increase the recycling and implementation of systems for safety purpose, occupational health and clean, safe environment and zero accident.
7. Office TPM/Administrative Improvements- To improve productivity, and efficiency of administrative functions and to eliminate the losses. Office TPM gives the better planning to perform a task.
[image:8.612.322.541.373.674.2]8. Development Management- Development Management Planning project strategies and analyzing the factors that influencing project decision, design new products as per customer focus, reduce lead time from design to production to market. Development Management focuses on the condition of market according to that implement new product and with new process.
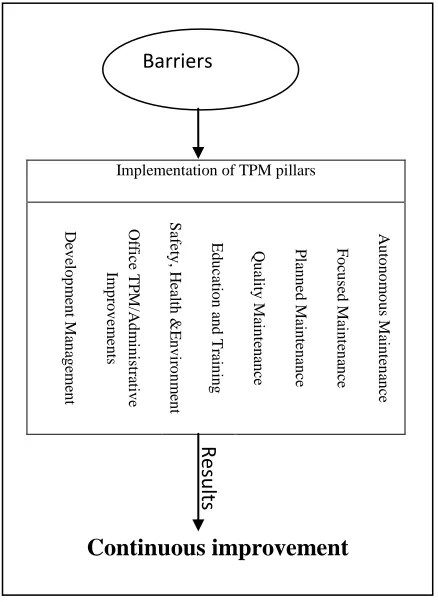
Fig -4.6: Integrated model of TPM Pillars
5.
CONCLUSIONS & DISCUSSIONS
Implementation of TPM pillars
© 2016, IRJET | Impact Factor value: 4.45 | ISO 9001:2008 Certified Journal
| Page 1829
The major objective of this paper is to identify the barriersthat commonly affect the successful implementation of TPM in any industry so that management may successfully implement TPM in their organizations. An ISM-based model has been developed to analyze the interactions among different barriers. It identifies the key barriers on which management should focus for the successful implementation of TPM. With the help of ISM methodology, we have found the key barriers which interrupt the continuous flow production of the firm and by the implementation of TPM it is possible to overcome these barriers. The driver dependence diagram helps to classify different barriers of TPM performing. Whole system and the management have to pay an attention to all the recognized enablers of TPM performing.
By the regular inspection of machine through the TPM pillar the barriers can be eliminate.
Success of TPM depends on various pillars like, Autonomous Maintenance, Focused Maintenance, Planned Maintenance, Quality Maintenance, Education and Training, Safety, Health & Environment, Office TPM/
Administrative Improvements, Development Management, 5-S.
The key factors for this implementation are workers involvement and top management support.
REFERENCES
[1] Ranteshwar Singh, Ashish M Gohil, Dhaval B Shah and Sanjay Desai, “Total Productive Maintenance (TPM) Implementation in a Machine Shop: A Case Study”, Procedia Engineering, Volume 51, 2013, pp.
592–599, Available online at
www.sciencedirect.com.
[2] Gautam Kocher, Ravinder Kumar, Amandeep Singh and Sukhchain Singh Dhillon, “An Approach for Total Productive Maintenance and Factors Affecting its Implementation in Manufacturing Environment”, International Journal on Emerging Technologies, Volume 03, Issue No. 01, May 2012, pp. 41-47, ISSN No : 0975-8364.
[3] Harsha G Hegde and N.S. Mahesh, “Overall Equipment Effectiveness Improvement by TPM and 5S Techniques in a CNC machine shop”, Journal of SASTECH, Volume 8, Issue 2, September 2009, pp. 25-32.
[4] Rajesh Attri, Sandeep Grover, Nikhil Dev and Deepak Kumar, “An ISM approach for modeling the enablers in the implementation of Total Productive Maintenance (TPM)” International Journal of System Assurance Engineering and Management, Volume 04, Issue No. 04, Oct-Dec 2013, pp. 313– 326.
[5] Fatemeh Kahrarian, “An Ism Access for Modeling the Enablers in the Performing of Total Productive Maintenance (TPM)”, International Journal of Research in Social Sciences, Volume 03, Issue No. 06, February 2014, pp.41-59, ISSN: 2307-227X.
[6] Sarbjeet Singh, “An ISM-based Analysis for Modelling Factors in Railway Maintenance task”, International Journal in IT and Engineering, Volume 03, Issue No. 03, March 2015, pp. 279-287, ISSN: 2321-1776.
[7] Binoy Boban and Jenson Joseph E, “Enhancing Overall Equipment Effectiveness for a Manufacturing Firm through Total Productive Maintenance”, International Journal of Emerging Technology and Advanced Engineering, Volume 03, Issue No. 08, August 2013, pp.435-429, ISSN: 2250-2459.
[8] William M. Goriwondo, Samson Mhlanga and Tapiwa Kazembe, “Optimizing a production system using tools of Total Productive Maintenance a case study in Datlabs Pharmaceuticals”, International Conference on Industrial Engineering and Operations Management Kuala Lumpur, Malaysia, January 22 – 24, 2011, pp. 1139-1144.
[9] Abdul Talib Bon, Lim Ping Ping, Berhanuddin Mohd Salleh and Asri Selamat, “Evaluating Total Productive Maintenance using overall equipment effectiveness: fundamental study”, Elixir International Journal, Volume 36, June 2011, pp. 3293-3295, ISSN No.: 2229-712X, Available online at www.elixirpublishers.com.
[10] J.W Warfield, “Developing Interconnected Matrices in Structural Modeling”, IEEE Transaction on Man and Cybernetics, Volume 04 & Issue No. 01, 1974 pp. 51-81.
© 2016, IRJET | Impact Factor value: 4.45 | ISO 9001:2008 Certified Journal
| Page 1830
Production Research, Volume 46, Issue No.24,December 2008, pp. 6883-6912.
[12] MD Singh, R Shankar, R Narain and A Agarwal, “An interpretive structural modeling of knowledge management in engineering industries”, Journal of Advances in Management Research, Volume 01, Issue No. 01, October 2003, pp. 28–40.
[13] V. Ravi and Ravi Shankar, “Analysis of interactions among the barriers of reverse logistics”, Technological Forecasting & Social Change, Volume 72, Issue No. 08, October 2005, pp. 1011-1029.
[14] S.K Sharma, B.N Panda, S.S Mahapatra and S.Sahu, “Analysis of Barriers for Reverse Logistics”, An Indian Perspective International Journal of Modeling Optimization, Volume 01, Issue No. 02, June 2011, pp. 101-106.
[15] Vikram Sharama, Amit Rai Dixit and Mohammad, Asim Qadri, “Analysis of Barriers to Lean Implementation in Machine Tool Sectors”, International Journal of Lean Thinking Volume 05, Issue No. 01, December 2014.
[16] A Mandal and SG Deshmukh, “Vendor selection using interpretive structural modeling (ISM)”, International Journal of Operations & Production Management, Volume 14, Issue No. 06, 1994, pp. 52–59.