© 2016, IRJET | Impact Factor value: 4.45 | ISO 9001:2008 Certified Journal | Page 1207
Numerical simulation and experimental investigation of Variable
Geometry Turbocharged diesel engine for off highway diesel engine
A. S. Kulkarni
1, R. D. Bhuva
2, P. S. Diwate
3, M. R. Dahake
4, D. N. Malkhede
51,2,3
M.Tech Thermal Engineering, Dept. of Mechanical Engineering, College of Engineering Pune, Maharashtra,
4Research Scholar, Dept. of Mechanical Engineering, College of Engineering Pune, Maharashtra, India
5Professor, Dept. of Mechanical Engineering, College of Engineering Pune, Maharashtra, India
---***---Abstract -
Variable geometry turbocharging (VGT) is apotential technology used to achieve higher specific power output and greater fuel economy. This paper presents experimental and simulation studies of upgrading the diesel engine from a fixed geometry turbocharger to a variable geometry turbocharger with actuation system for boost pressure control. The objective of this study is to evaluate the potential of VGT air boosting system in a 4-cylinder, 3.24-liter inline water cooled, fixed geometry turbocharged diesel engine at rated brake power of 43 kW and to up rate it to generate 52 kW brake power. The air boost system consists of VGT with vacuum actuator and intercooler. Quasi one dimensional simulation is carried out using AVL Boost. Simulation and experimentation were carried out for baseline engine with fixed geometry turbocharger and for up rated engine with VGT and intercooler. The power enhancement was evaluated by parametric analysis of engine considering combination with intercooling requirements, varying air boost with VGT and increment in fuel feed. With 30% increase in boost and 20% increase in fuel feed, targeted brake power is achieved. VGT type air boosting system achieves a better flattened torque and power curve.
Key Words: VGT, actuation, intercooling, power
enhancement.
1.INTRODUCTION:
An engine drawing air in from the atmosphere can only achieve a volumetric efficiency of up to 100%, meaning that the pressure inside an individual cylinder is equal to atmospheric pressure while the intake cycle is occurring[1,3]. Since the amount of power that can be extracted from an engine is proportional to the fuel it burns, and the fuel consumption is limited by the amount of air present in a cylinder, times the number of cylinders, the volumetric efficiency limit effectively constrains the power of the engine [2]. To make an engine more powerful, one must increase its displacement. Unfortunately, the consequence to this is that the engine burns more fuel under all conditions, adversely affecting its fuel mileage [4].
Supercharging is a way to supply extra air to engine by means of compressor attached to flywheel. The compressor draws power from engine and supplies compressed air to engine to increase its volumetric efficiency more than 100%
[5]. Since the compressor draws the output power of the engine, ultimately the power at wheel decreases. The turbocharger provides an alternative means of extracting more power from a given displacement by increasing the volumetric efficiency to points significantly above 100%. The pressure in the cylinders is greater than atmospheric. The way gasoline engines are controlled, it turns out that a turbocharger can be set up to only function when one wants additional power, so that most of the time, the turbocharger doesn't adversely affect fuel economy (perhaps a 5% reduction overall), but when needed, the engine is capable of turning out significantly more power.
2.LITERATURE REVIEW:
The potential of variable geometry turbine nozzles has been exploited in small gas turbines for many years [6]. In particular the effect of turbine area control improves utilization of exhaust gas utilization of exhaust gas energy by the turbine at low engine speed [4]. VGT and its conceptualization was designed and developed in late 80’s. Later the application of VGT then increased for power enhancement and reducing emissions in IC engine. During development of VGT it was incorporated for heavy diesel engines. F. J. Wallance and D. Howard in late 80’s implemented Holset H2B VGT on 11.2 L 6 cylinder DI engine of 190kW at 2100 rpm rating[7]. VGT with electronic actuators improved torque from 1020 N.m to 1160 N.m. at 1300 rpm. Increased torque is found along with substantial improvement in fuel economy under part load conditions.
In a similar practice by J. F. Moody [8], VGT is mounted on 3.8 L waste gated TC V6 engine, turbocharger opening was controlled as the boost will be controlled by it. In this experimentation rated torque enhanced to 429.8 N.m from 406.7 N.m also the torque characteristics and does not tend to drop off as quickly as conventional turbocharger.
© 2016, IRJET | Impact Factor value: 4.45 | ISO 9001:2008 Certified Journal | Page 1208
turbocharger combined with elimination of pressurereducing device, mitigates much of cost issues. Rest electronic and hydraulic systems are better than pneumatic or vacuum actuators, but its cost is considerably more.
HSDI engine are one of the prime engines which are highly recommended for high speed applications. As far as diesel is concern, sudden torque is not available as gasoline. Jaehoon Cheong et al found that with VGT at lower engine speed exhaust smoke decreases and BSFC improves by 3-10% and it is possible to improve boost pressure to its optimum value with VGT [11].
From the above literature survey one can understand that variable geometry turbochargers are the solution for waste heat recovery for medium to heavy duty diesel engines. Utilization of exhaust gas which was any how wasted is easily and controllably possible with VGT technology. With VGT not only full load but intermittent load and lower speed performance of the engine can be significantly improved. As far as control of the VGT is concerned, it should be selected according to the sources available. Pneumatic/vacuum and electro-hydraulic could be better options for actuation of VGT.
3.SIMULATION:
[image:2.595.317.554.93.259.2]The model of Kirloskar 4R810T DI diesel engine is created in AVL Boost and its performance was matched with experimental data of actual engine running. Then engine parameters were modified to run engine with intercooler, VGT with different boost and change in fuel quantity to obtain required power output. The detailed description is given below [12, 13].
Table 1: AVL Boost tools Sr.
No. Component Designated by
1 System Boundary (Inlet
and Exhaust) SB1, SB2
2 Air cleaner CL1
3 Turbocharger TC1
4 Intercooler CO1
5 Plenum PL1
6 Cylinders C1,C2,C3,C4
7 Junction J1
8 Pipe connections 1,2,3,4,5,6,7,8,9,10,11,12,
13
9 Measuring Points MP1 to MP9
Flow path from intake to exhaust: SB1-CL1-TC1-PL1-C1, C2, C3, C4-TC1-SB2
The symbolic engine model is created by taking different representative symbols for various engine components from the standard component library provided in Boost. The engine model created and the geometrical and thermodynamic parameters were inserted in the model. The engine was then tuned to match experimental engine.
Fig -1: Base engine model
The updated engine is with variable geometry turbocharger and intercooler mounted on it. Cases are generated in AVL boost to estimate the maximum torque at specified interval. Boost values then varied to obtain optimum boost pressure for each rpm in simulation.
Fig -2: Updated engine model
4.SYSTEM DEVELOPMENT AND EXPERIMENTAL
SETUP:
4.1 Engine
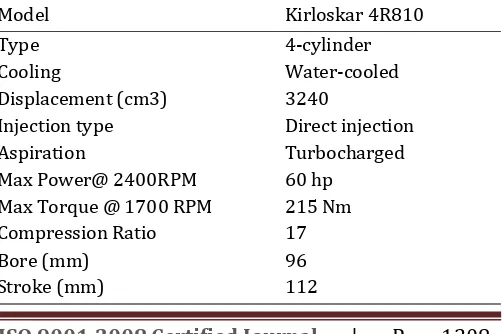
The medium duty turbocharged direct injection Kirloskar Diesel engine was selected for the present study which is widely used in agriculture and off road vehicles. Detailed technical specifications of the test engine are given in Table 2. Selected test engine was 4-cylinder turbocharged direct injection water cooled diesel engine.
Table 2: Specifications of the test engine
Model Kirloskar 4R810
Type 4-cylinder
Cooling Water-cooled
Displacement (cm3) 3240
Injection type Direct injection
Aspiration Turbocharged
Max Power@ 2400RPM 60 hp
Max Torque @ 1700 RPM 215 Nm
Compression Ratio 17
Bore (mm) 96
[image:2.595.313.553.320.472.2] [image:2.595.310.561.618.785.2]© 2016, IRJET | Impact Factor value: 4.45 | ISO 9001:2008 Certified Journal | Page 1209
4.2 Experimental setup
[image:3.595.42.283.217.421.2]Figure 3 shows the proposed engine schematic for the power enhancement requirement including VGT and intercooler. Engine is mounted on a steady concrete base coupled with an eddy current dynamometer. The purpose of the work is to replace a fixed geometry turbocharger from the baseline engine with a new variable geometry turbocharger. An intercooler is incorporated to control the intake charge temperature to the engine.
Fig -3: Engine schematic
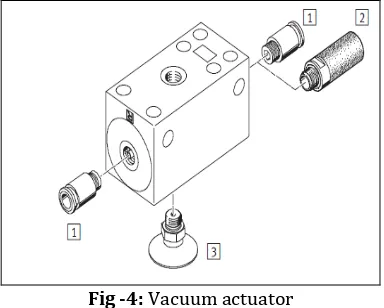
[image:3.595.66.258.559.713.2]Variable geometry turbocharger needs vacuum actuation for operating its vane position. To provide required amount of vacuum, a vacuum generation system is incorporated. This is a casted block of aluminum in which a tube with a throat is formed. Through the tube high pressure air is allowed to pass via throat section. Due to throttling effect, lower pressure with high velocity can be obtained. At the throat, one more connection is provided where desired vacuum can be obtained.
Fig -4: Vacuum actuator
The exploded view of the vacuum generator is shown in figure 4. Port (1) is silencer, (2) is pressurized air supply connection and (3) is vacuum cup. Pressurized air supply can
be provided from entry of port (2) and at vacuum cup i.e. at (3) suction is created.
5. TEST PROCEDURE
During the complete trial special attention is paid to the values of engine coolant temperature, lubricating oil temperature and temperature of exhaust after turbine so that their values do not exceed the limiting values [14]. The safe test conditions decided for testing the said variable geometry turbocharged diesel engine were,
Maximum engine coolant outlet temperature < 80 °C
Maximum engine lubricating oil temperature < 120 °C
Maximum combustion pressure < 140 bar (in simulation only)
Peak pressure rise per crank angle < 6 bar/CrA
After taking care of all safety conditions and basic requirements to conduct the tests, experiment was conducted to estimate the torque curve of the engine. All the values of engine performance were measured. To estimate the curve, torque values at different rpm were measured. RPM considered from 830 rpm i.e. idle speed to 2400 rpm i.e. max speed with the step of 200 rpm. During the test max torque bared by the engine was 211 N.m at 1617 rpm and max power is found to be 43.19 kW at 2397 rpm.
The objective of the project work was to enhance power output of the engine which was carried out in several test conditions according to change in boost pressure by 10% to 30% incorporation of intercooler and change in fuel feed of the engine by 20% and 30%. The purpose of following such step by step improvement in the engine for power enhancement is to monitor and avoid crossing of engine design safe limits.
© 2016, IRJET | Impact Factor value: 4.45 | ISO 9001:2008 Certified Journal | Page 1210
6. RESULTS AND DISCUSSIONS
After completion of theoretical calculations and simulation exercise necessary adoption and modifications were done on the engine to fit the required components. Then new torque curve test is conducted on the engine and all the parameters were recorded as per availability of the measuring instruments. The parameters recorded are ambient pressure and temperature, temperature and pressure across intercooler, temperature after turbine, lubricating oil temperature, engine coolant temperature.
6.1 Power
Chart -1: Power curve
With increase in boost by 20% without putting CAC in system gave 3.57% increase in power at 1000 rpm but also reduced by 3.33% at peak rpm i.e. 2400. This case setup was just to estimate the response of engine with extra air only. At lower rpm engine had less air with older TC but with VGT that need of air was fulfilled and power output increased but at higher rpm the air temperature increased far more and caused reduction in power output. When the CAC brought back in system the results for power were different i.e. with 8% and 2.71% increase at 1000 rpm and 2400 rpm respectively. When boost is further increased to 30%, 10% increase in power is found at lower rpm but again reduced by 5.07% at peak rpm. This could be because of excess air supplied to engine than requirement.
In all the cases above the main focus was up to increasing boost and reducing intake air temperature. Here onwards quantity of fuel also varied to get more power. With 20% more boost and 10% increase in fuel delivery gave maximum 14.9% increase in power at 1400 rpm. Moving forward the boost increased to 30% and fuel to 20% which increased output power by 25% at 1800 rpm and more than 20% increase is found at every rpm.
6.2 Torque
Chart -2: Torque curve
Power is representation of torque and speed therefore similar trends were found in change in torque with respect to change in experiment setup and conditions. Only CAC brought as much as 3% increase in torque than that of baseline engine.
With 20% boost increase without CAC doesn’t change the max torque value but increases by 3% at 1000 rpm where as in same case with CAC 7.6% increase is found at 1000 rpm with average increase of 3.64%. Further increase in boost to 30% increases torque up to 10% at 1000 rpm but depreciates by 5.2% than baseline engine at 2400 rpm. It can be quoted that up to certain extent the intercooler and extra boosting can help the power development but later the performance deteriorates because of much extra air than requirement.
When the fuel to engine increased i.e. with 20% more boost and 10% more fuel with CAC max torque reaches to 240 N.m which is 13.74% more than baseline engine. Max torque change is found at 1800 rpm which is 14.14% of baseline engine. Average increase was found 12% than baseline engine. More increase in boost and fuel gives max torque of 263 N.m at 1600 rpm and average increase is 23.15%
6.3 BSFC
© 2016, IRJET | Impact Factor value: 4.45 | ISO 9001:2008 Certified Journal | Page 1211
The baseline engine with fixed geometry turbocharger isunable to provide air boost at lower speed as it is designed to provide desired boost at higher rpm of the engine and that leads for higher BSFC at lower engine speeds. Intercooling effect to intake charge with fixed geometry turbocharger there is power improvement with same fuel feed as that of baseline engine therefore BSFC reduces 2.5% for lower speeds but there is no significant reduction.
Air boosting without intercooling reduces rated power of the engine. Baseline engine producing rated power has BSFC 238.06 g/kW.hr, raised to 242.93 g/kW.hr with 20% improved boost and without cooling the intake charge, whereas intercooling with same 20% boost results in 7.37% reduction in BSFC for 1000 rpm and for rated power condition it is decreased by 2.64%. When the air boosting increased by 30%, low rpm BSFC reduces by 8.6% but as the rated power reduces BSFC is increased.
When the fuel feed to engine increased than the baseline engine for 20% and 30% air boost, engine brake power increases. But the power improved is with exact proportion to increase in fuel feed hence there is no significant change in BSFC.
6.4 Comparison with simulation
Chart -
4: Base engine torque matching
Chart -
5: Base engine power matching
Chart -
6: Base engine BSFC matching
To simulate the engine for baseline performance experimental data like mass of fuel, intake air temperature and boost pressure by the turbocharger is used. Rest of the data is tuned to match with the real engine performance. After several iterations in parameters the simulation got matched with the experimental results in terms of torque, power and BSFC. As these parameters matched perfectly it was considered that rest of the parameters must have got good match with the real engine.
After making necessary changes in model for the new test conditions the performance is evaluated and verifying its repeatability for several small changes in model, the test condition is adopted. The last and highest power delivering test condition is compared with the simulated engine.
Chart -
7: Updated engine torque matching
[image:5.595.311.558.81.267.2]© 2016, IRJET | Impact Factor value: 4.45 | ISO 9001:2008 Certified Journal | Page 1212
Chart -8: Updated engine power matchingIn power curves shown in figure has the similar trend as that of torque curve. Most of the curve is overlapping to each other exceptional in between 1500 rpm to 1700 rpm there is small deviation in power values.
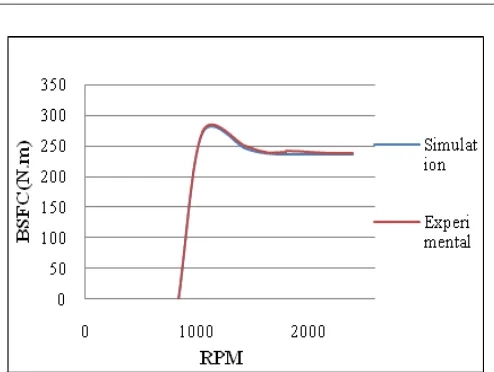
Chart -9: Updated engine BSFC matching
Figure 9 describes the variation in BSFC values in simulation and experimental data. This has lager variation in experimental and simulated values. Experimental data is collected by a specific fuel consumption meter which has 50 ml burette and measurement is taken in terms of time required to empty the burette for each reading. The error could be due to some changes by the governor at that torque which were not accounted in the simulation.
Chart -10: Variation in in-cylinder pressure
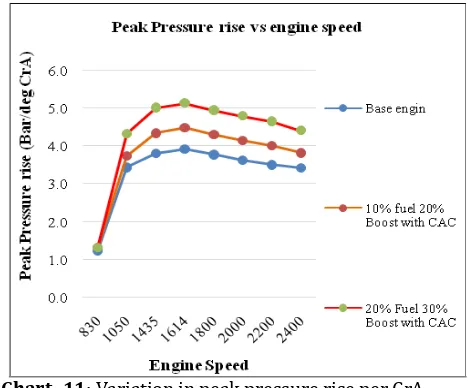
In cylinder temperature showed increasing trend with increase in boost pressure and amount of fuel injected. Peak firing pressure for base engine is 97.57 bar which increase to 128.7 bar for 30 % increase in boost pressure. The max peak fringe pressure found is 136.95 bar which is in the permissible operating limit of 140 bar.
[image:6.595.322.557.380.574.2]© 2016, IRJET | Impact Factor value: 4.45 | ISO 9001:2008 Certified Journal | Page 1213
Chart -12: Variation in pressure rise8. CONCLUSIONS AND FUTURE SCOPE
The power enhancement from the engine was obtained by intercooling and air boosting. Maximum increase in power with intercooling without any change in air boost and fuel quantity is maximum up to 4%. If the boost is increased, performance of the engine increases at lower speed but at higher speed the air provided by older TC was already optimum hence further boost reduced engines performance at peak speed. The fixed geometry turbocharger for the engine was suitable for higher speed operations i.e. beyond 1600 rpm where it ensure the boost requirement of the engine.
The purpose of enhancing power was not very possible without increasing fuel quantity. More fuel is mandatory to generate more power and torque. With increase in fuel 25% power can be enhanced without changing any component or system of the baseline engine.
The system can be upgraded from manual control of boost to some electronic actuation system. Development of ECU for more precise control of VGT can be incorporated. Further development on engine power is possible with more precise monitoring system and advanced cooling system.
REFERENCES
[1] Watson, N., and Late Janota, M.S., “Turbocharging the
Internal Combustion Engine”, The MacMillan Press Ltd., London and Basingstoke, International Edition.
[2] Heywood, J.B., “Internal combustion engine fundamentals”,
McGraw-Hill, 1998, ISBN 9780070286375.1-923.
[3] Bernard Challen and Rodica Baranescu,"Diesel Engine
Referance Book, Second Edition, 1999", Butterworth-Heinemann Linacre House, Jordan Hill, Oxford OX2 8DP, ReedEducational and Professional Publishing Ltd.
[4] Hawley J., Wallaace, Cox A., Horrocks R., Bird
G.,”Reduction of Steady State NOx level from an Automotive Diesel Engine Using Optimized VGT/EGR Schedules” SAE paper No.1999-01-0835, 1999.
[5] Zinner K.,"Supercharging of Internal Combustion Engnies-
Fundamentals, Calculations, Examples", Springer-Velarg Berlin Heidelberg New York 1978, International Edition.
[6] K. Kunberger, New diesel highlights from MAN, Diesel
and Gas Turbine Progress Worldwide.
[7] F. J. Wallace and D. Howad "Variable Geometry
Turbocharging of Large Truck Diesel Engine" SAE-860452, 1987.
[8] Moody,J.S., "Variable Geometry Turbocharger with
Electronic control" SAE-860107, 1987.
[9] Bond, William D., "Diesel Boost Devices" Warren General
Motor engineering staff. Advance product Engineering APMES 83-024, 1983.
[10] Steve Arnold et. al., "Advanced Variable Geometry
Turbocharger for Diesel Engine Applications", SAE-2002001-0161.
[11] Jaehoon Cheong, Sunghwan Cho and Changho Kim,
"Effect of Variable Geometry Turbocharger on HSDI diesel Engine" F200A122, FISITA World Automotive Congress.
[12] AVL BOOST,"Users Guide Version 2013.1"
[13] AVL BOOST,"Theory Version 2013.1"
[14] Gandhi Naresh, et. al.,"Development of Two Stage