3529
NEW STABILITY FORMULAS FOR GEOTEXTILE TUBES
AGAINST WAVE ATTACK
YASSINE AMALLAS 1, YOUSSEF AJDOR 2
1Laboratory of Civil Engineering, Mohammedia School of Engineers, Av Ibn Sina B.P 765, Agdal -Rabat. Morocco 1Laboratory of Civil Engineering, Mohammedia School of Engineers, Av Ibn Sina B.P 765, Agdal -Rabat. Morocco
E-mail: 1 [email protected] ; 2 [email protected]
ABSTRACT
Geotextile tubes are more and more used in maritime field as protection systems (breakwaters, groin, and artificial reef…). They are constantly subjected to ocean hydrodynamic forces. Studying stability of these structures against these agents is a very important task in their dimensioning process because a lack of stability will destroy theme. In literature, there are not yet enough safe, certain and approved formulae or methods to studying stability against wave attack. This is the reason why designers around the world still prefer work with traditional solution (conventional breakwaters with rocks) than these innovative ones. This paper proposes two new formulas to studying stability of geotextile tubes against wave attack. A new called number of stability depending on the degree of filling, the average period and the duration of storm is carried out.
Keywords: Geotextile tubes, stability formulas, wave attack, number of stability.
1. INTRODUCTION
Even geotextile tubes have been used in costal structures for many decades ago as new and promising systems there are sometimes limited by the lack of design rules. That’s probably the reason why planners, designers and contractors are therefore rather hesitant to apply these materials. While the design of traditional solutions using rock elements has been approved by the use of many formulas such as that one of Hudson (1959) [6, 12, 13] and the one of Van Deer Meer (1988) [6, 14, 15].
This paper presents, after an overview of the most existing popular methods, two new formulas to study the stability of geotextile tubes against wave attack. Comparisons between these formulas and the existing ones have been carried out and allows to a good agreement.
2. MOST POPULAR EXISTING
METHODS
The Design methods have been published based on the results of many reduced scale model tests. However, the failure mechanisms that lead to the instability of the tubes are complicated and have not yet led to a generic approved design method [3].
Three existing methods for stability of
geotextile tubes against wave attack are listed in this paper to be the most important ones [10]: Pilarczyk: 2000 [4], CUR217: 2006 [9, 3], and P. Van Steeg, E. Vastenburg 2010 [5, 7, 8].
2.1. Pilarczyk 2000
A theoretical derivation of the stability of a stacked geotextile tube with the crest at water level was done on the results obtained from a study undertaken on the stability of sand- and mortar- filled geotubes and geocontainers by Delft Hydraulics (1994). It was concluded that the critical wave height was equal to the theoretical diameter of the tube [4]. A reduction of the wave period, flattening of the tube and reducing the water level were found to have a positive effect on the stability [4].
Hs 4
3AW ∆
h 1 k
Where:
k = Reflection coefficient (≈ 0.45); Hs = Wave height;
H = Height of tube;
ρ = Density of water; g = Gravitational acceleration; A = Area of tube cross-section ;
ρ = Density of saturated sand ; W = Tube width;
3530 A simplification of the above equation
for tubes lying parallel to the axis of a structure with their crests below or at water level is given by [4] :
H
∆ B 1
2.2.CUR 217 (2006)
CUR 217 recommends a very similar formula for calculating the limiting significant wave height to the formula prescribed by Pilarczyk 2000. However, it is more restrictive, because it replaces the width with the height of the geotextile tube. This has a significant effect on the allowed wave height as the width of an average tube is nearly twice that its height [9, 3]. CUR 217 states that the tube that receives the heaviest loading is the tube at the crest of the structure. A formula for a limiting significant wave height for the stability of a geotextile tube on the crest of a breakwater is given by [9, 3].
H
∆ D 1
Where :
Hs : Significant wave height ;
Dk = height of geotextile tube (with tube perpendicular to wave direction),
= length of geotextile tube (with tube parallel to wave direction);
Δt : relative weight of tube or relative buoyant
weight of tube
Using the above formula gives an estimated Hs equal to the height of the tube (for Δt ≈ 1).
2.3.Van Steeg & Vastenburg 2010
Van Steeg & Vastenburgsuggest a new theoritical dirivation stability number with respect to sliding. For a single placed geotextile tube, this formula is given below: [5, 7, 8].
χHs
∆ √BD fcosα sinα 0.65
With :
Hs : Significant wave height at limit of stability ; Δt : relative density of geotextile tube ;
B : width of geotextile tube;
D : height of geotextile tube structure ; f : friction coefficient of the geotextile and supporting structure interface ( f ≈ 0.5) α : slope of the supporting structure ; χ: reduction factor for lost energy due to overtopping (between 0.2 and 0.74)
3. NEW STABILITY FORMULAS
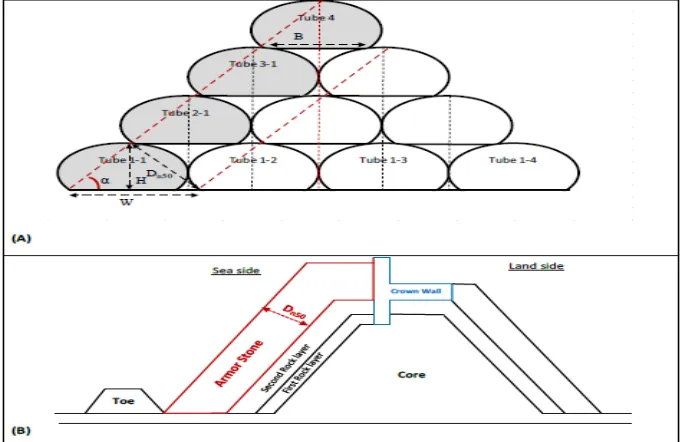
[image:2.612.141.481.476.697.2]In this chapter, we are going to do an analogy between the geotube solution and the traditional solution (conventional dykes with rocks and /or armor stone)..
3531 Formulas of Hudson and Van der Meer have been approved in many cases of projects around the world for traditional solutions with rock elements [6].
From these most popular stability formulas, new stability formulas for geotextile tubes solutions have been established and presented below. These assumptions have been taken into consideration:
- The case of a stacked structure is considered (the case of single tube is also applicable); - The tubes which are in front of the structure and directly on contact with waves are considered to ply the same role as the armor stone of traditional solutions (tubes with grey color 1-1; 2-1; 3-1, 4-1). The average thickness of this layer is noted Dn50.
- The slope of the structure is noted α and is calculated as a function of dimensions of tubes as described below.
For the cross section structure presented in figure 1, it can be calculated that tanα =8H/(3W+B) for 4 stacked geotextile tubes lines.
In the case of a single geotextile tube, tanα ≈ 2H/B.
After figure 1, we have:
tanα D
l
2H B sinα H
l
H
H B2
D W. sinα W. H
H B4
D 2WH
√4H B
3.1. Modified Hudson formula (Amallas 2019a)
The first classical stability formula of Hudson have been established by the author in 1959 [6, 12, 13].
H ΔD
K cotα ⁄ 1.27
Hs: Significant wave height;
Δ : relative weight of the armour elements; Dn50: thickness of the armour elements;
KD: stability coieficient depending on the
elements.
For element with geotextile, Hudson preconise to use KD=1. In this situation the formula becomes
H ΔD
cotα ⁄ 1.27
H
Δ 1.25
WH
√4H B
B H
.
H
Δ. R % 1.25. f F
Where: f F
%.
.
.
And
W W/R %; H H/R %; B B/
R %;
The term . can be expressed as a function of the degree of filling FA.
According to the numerical approach presented by Amallas and Ajdor in references [1, 2, 11], for a certain degree of filling FA , W’, B’
and H’ have the same value regardless the circumference of geotextile tube L and are expressed only by the degree of filling FA. Then
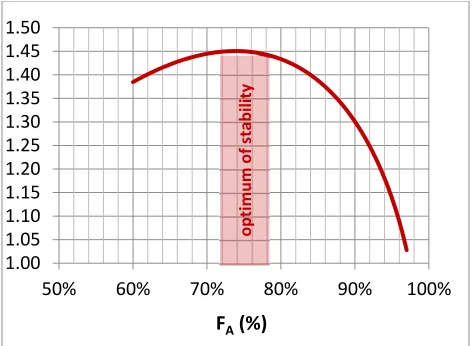
[image:3.612.326.563.400.573.2]the function f is shown in figure 2 below:
Figure 2: The function f as a function of FA
H
∆. R % 1.45 𝐟𝐨𝐫 𝟕𝟐% 𝐅𝐀 𝟕𝟖%
H
∆. R % 2.66F 4.04F 0.08 𝐟𝐨𝐫 𝐅𝐀
𝟕𝟐% H
∆. R % 11.63F 18.20F 5.67 𝐟𝐨𝐫 𝐅𝐀
𝟕𝟖%
These equations were extracted from graph above with a very good agreement with direct calculations from the numerical
1.00 1.05 1.10 1.15 1.20 1.25 1.30 1.35 1.40 1.45 1.50
50% 60% 70% 80% 90% 100%
FA(%)
optimum
of
3532 approaches presented in [1, 2, 11], the maximum error margin is -1.5%/+1.5% for FA between
50% and 97%.
3.2.Modified Van der Meer formula (Amallas 2019b)
The stability formula for traditional solutions have been established by the author in 1988 [6, 14, 15]:
6.2P .
√ .
ξ . , for 𝛏
𝐦 𝛏𝐜
1.0P .
√ .
√cotα. ξ , for
𝛏𝐦 𝛏𝐜
Where:
Hs: Significant wave height;
Δ : Relative weight of the armour elements; Dn50: Thickness of the armour elements;
Sd:Damage Level;
p : Notional permeability of the structure; N: Number of waves;
ξ : Breaker parameter or Iribarren Number using the average periode Tm;
ξ tanα
2π g .TH
ξ 6.2. p . √tanα .
ξ is the transition from plunging to surging waves.
After Van Der Meer, for the project using geotextile, the notional permeability can be taken equal to 0.1 [6]. Then for geotextile tubes, p=0.1.
It can be demonstrated that only the formula for surging waves can be valuable for structures made from geotextile tubes: ξ ξ .
As the elements of geotextile tubes are tabular, Van der Meer preconize to use the coefficient of 1.3 instead of 1.0 [6] in the formula for surging waves. Then the formula becomes:
H
ΔD 1.3P .
S √N
.
√cotα. ξ
H ∆ . 1.73T . S
√N
. 2WH
√4H B
. 2H
B .
H ∆ . R
%
. 1.73T .
S √N
. f′ F
Where:
f F 2W′H′
√4H B′
. 2H′
B′ .
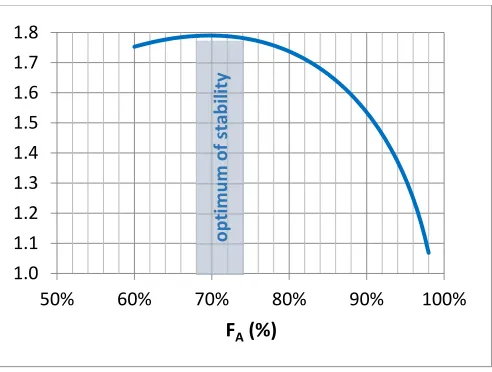
[image:4.612.319.529.91.229.2]According to the numerical approach presented by Amallas and Ajdor in reference [1, 2, 11], the function f’can be presented as in graph shown in figure 3 below:
Figure 3: The function f’ as a function of FA
For 𝟔𝟖% 𝐅𝐀 𝟕𝟓%: H ∆ . . R
%
. 1.79. K
For 𝐅𝐀 𝟔𝟖%:
H
∆ . . R
%
. K. 3.69F 5.18F 0.02
For 𝐅𝐀 𝟕𝟓%:
H
∆. . R
%
. K. 11.04F 16.41F 4.31
Where:
K 1.73T . S
√N
.
These equations were extracted from graph above with a very good agreement with direct calculations from the numerical approaches presented in [1, 2, 11], the maximum error margin is -1.5%/+1.5% for FA between
50% and 96% 1.0
1.1 1.2 1.3 1.4 1.5 1.6 1.7 1.8
50% 60% 70% 80% 90% 100%
FA(%)
optimum
[image:4.612.324.570.290.476.2]3533 4. DISCUSSION
4.1.Modified Hudson: Amallas 2019a
In the modified Hudson stability formulas exposed above, it is shown that the stability of geotextile tubes against wave attack depends on the degree of filling of the tubes; tubes which are filled at a degree between 72% and 78% are expected to be the most stable against wave attack.
These news stability formulas, present an innovation compared to the existing methods described above. This is shown in the explicit dependence of the stability of geotextile tubes with their degree of filling.
4.2.Modified Van Der Meer: Amallas 2019b
In addition to the explicit dependence of the stability of geotextile tubes against wave attack with their degree of filling FA, the
modified Van Der Meer stability formulas show also the dependence of the stability with the number of waves N and the average period Tm
and thus the duration of the storm. This is reported in the term K.
4.3.Sensitivity analysis of term K:
The damage level Sd is equal to the
number of elements that can be tolerated to move in the armor stone over the total elements per length meter. In the case of geotextile tubes, no damage is tolerated because if an element is moved from its location, then the structure will be destroyed. Van Der Meer preconize the value of 0.5 [6] for Sd, for the case of no damage is
tolerated. The term K is then written as below:
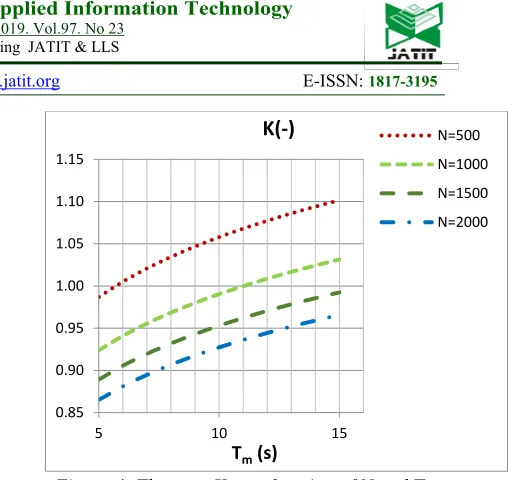
K 1.52T . N .
The term K gives an idea of the influence of the average period Tm and the
number of waves N on definitive dimensions of the calculated geotextile tube. For Tm between 7s
[image:5.612.301.557.38.278.2]and 15s (this corresponds to the most sea wave conditions in Morocco), K is between 0.9 and 1.1.See figure 4 below.
Figure 4: The term K as a function of N and Tm 4.4.Optimum degree of filling FA:
In relation to the stability of the geotextile tubes, shape and thus deformation play a key role. A flat tube (tube with low degree of filling) is less likely to roll or tilt than a round one, due to a reduced area interacting with horizontal wave forces and an increased width of the tube. The shear stress in the geotextile is also less in a flat tube. Working with tubes with lower degree of filling would increase the number of required tubes to reach the design height of the structure. Higher degree of filling increase the probability of sliding and rolling of the tube. For a higher degree of filling, a high pumping pressure is required to achieve the filling process and this will increase the tensile strength in geotextile that may causes the failure of geotextile tubes. Therefore an optimum degree of filling must be sought. The maximum practical degree of filling is almost always less than 80% [3].
The modified Hudson formulas presented above provide the calculation of a new number of stability
∆. %. This number is
∆ . . %
. for the modified Van Der Meer formulas. The existent number of stability are ∆.
established by pilarczyk 2000 and ∆.√ for the Van Steeg and Vastenburg 2010 formula. A high number of stability is desired in order to have a lower required circumference for the definitive geotextile to use (lower R100%). The modified
Hudson and Van Der Meer formula give the maximum value for the number of stability at a
0.85 0.90 0.95 1.00 1.05 1.10 1.15
5 10 15
Tm(s)
K(‐) N=500
N=1000
N=1500
3534 degree of filling between 70% and 75%, This degree of filling is probably the optimam degree of filling for geotextile tubes.
4.5.Comparison with the existing methods:
The number of stability ∆.
% is calculated for diverse degree of filling FA and for
the both established new stability formulas and compared with the most existing methods:
Pilarczyk 2000:
For Stacked tubes:
H
∆ 0.92
AW H
Then, the number of stability should satisfy this inequality ∆
% 0.92πF
For Single tube
H
∆ W 1
Then, the number of stability should satisfy this inequality
∆ % %
Van Steeg & Vastenburg 2010 H
∆ 0.65
f χ. √WH
Then, the number of stability should satisfy this inequality ∆
% 0.65 . √W′H′ The comparison is shown in figure 5 below:
Figure 5: Number Of Stability Comparison With Existing Methods
Table1: Number Of Stability For Different Degree Of Filling From 60% To 95%
Pilarczyk (single tube)
Van Steeg and Vastenburg (𝒇𝝌
𝟏)
Amallas 2019a (modified Hudson)
Amallas 2019b (modified Van Der Meer) FA
60% 2,72 0,98 1,38 1,75
65% 2,68 1,02 1,42 1,78
70% 2,63 1,06 1,45 1,79
75% 2,57 1,10 1,45 1,79
80% 2,51 1,13 1,43 1,74
85% 2,44 1,17 1,39 1,66
90% 2,35 1,20 1,30 1,53
95% 2,24 1,24 1,14 1,32
0.50 1.00 1.50 2.00 2.50 3.00
60% 70% 80% 90% 100%
Number of stability for different degree of filling
Pilarczyk
Van Steeg & Vastenburg
Amallas 2019b
3535 NB:
- For Van Steeg & Vastenburg formula, the term is considered to reach 1;
- For Van Deer Meer modified formula, the stability number presented is
∆ . . %
. , and the term K is considered to reach 1.
5. CONCLUSION
This paper presents two new formulas to studying stability of geotextile tubes against wave attack based on historical formulas of Hudson and Van Der Meer approved in many project around the world. Through this paper, the following conclusions can be reached:
- The new established number of stability highlights explicitly its dependence on the degree of filling of geotextile tubes, the average period and the duration of the storm. This expression of the number of stability is given for the first time in literature. It represents an innovation in the field.
- A high number of stability and thus an optimum of the geotextile circumference is found when the degree of filling is around 70%-75%. This value is obtained when the height of the tube H is approximately twice of its width B. This is an economic required geotextile material.
It is recommended to perform physical model tests in order to improve and refine the established formulas.
REFERENCES:
[1] Y.Amallas and Y.Ajdor (2018): New approach for predicting shape of geotextile tubes base on degree of filling FA. Journal of Theoretical and Applied Information Technology. ISSN: 1992-8654, E-ISSN: 1817-3195. 15th December 2018 -- Vol. 96. No. 23 – 2018. 7812-7821.
[2] Y.Amallas and Y.Ajdor (2019): Definitive resolution of the shape of geotextile tubes: numerical approach based on Pumping Pressure P0. International Review of Civil
Engineering (I.RE.C.E.), Vol. 10, No 2, 2019. 63-72.
[3] A.Bezuijen and E.W.Vastenburg (2013). Geosystems: design rules and applications.1st edition CRC Press/Belkama.
[4] Pilarczyk (2000): Geosynthetics and geosystems in hydraulic and coastal engineering. A.A. Balkema, Rotterdam, the Netherlands.
[5] Ir. P. Van Steeg, Ing. E.W. Vastenburg : Deltares, 2010. Large scale physical model tests on the stability of geotextile tubes, Deltares report 1200162-000, February 2010, Delft.
[6] CIRIA, CUR, CETMEF (2007) The Rock Manual. The use of rock in hydraulic engineering (2nd edition). C683, CIRIA, London 2007.
[7] P. Van Steeg, E. Vastenburg, A. Bezuijen, E. Zengerink and J. de Gijt. Large-scale physical model tests on sand-filled geotextile tubes and containers under wave attack. CSt2011p0021.
[8] Bezuijen A., K.W. Pilarczyk (2012). Gesynthetics in hydraulic and coastal engineering filters, revetments and sand filled structures . Proc. EuroGeo 5, Valencia, pp 65-80
[9] CUR, 2006. In Dutch: CUR 217: Ontwerpen met geotextiele zandelementen(CUR217: Design with geotextile encapsulated sand elements), Stichting CUR, Gouda.
[10] Y.Amallas and Y Ajdor (2018): Protection of Monika beach against coastal erosion by geotextile tubes. International Journal of Emerging Technology and Advanced Engineering. Volume 8, Issue 11, November 2018. pp 120-128.
[11] Y.Amallas and Y Ajdor (2019): Studying the shape of geotextile tube. ICAMOP journal, vol. 1, no. 1, 2019, p. 54-60.
[12] Shore Protection Manual U.S. Department of the Navy Waterways Experiment Station, volume 2. Government Printing O ce, Washington, 4 edition, 1984.
[13] Hudson. Laboratory investigation of rubble mound breakwaters. Journal of Waterway, Port, Coastal and Ocean Division, 85(3):93 121, 1959
[14] Van der Meer, J.W. (1987). Stability of breakwater armor layers - Design formulas. Elsevier. J. of Coastal Eng., 11, p 219 - 239. [15] Van der Meer, J.W. (1988b). Deterministic