Ahrend, R. and Tompson, William (2006) Realising the oil supply potential
of the CIS: the impact of institutions and policies.
OECD Economics
Department Working Papers (485), pp. 1-84.
Downloaded from:
Usage Guidelines:
Please refer to usage guidelines at or alternatively
Organisation de Coopération et de Développement Economiques
Organisation for Economic Co-operation and Development
___________________________________________________________________________________________ English - Or. English ECONOMICS DEPARTMENT
REALISING THE OIL SUPPLY POTENTIAL OF THE CIS: THE IMPACT OF INSTITUTIONS AND POLICIES
ECONOMICS DEPARTMENT WORKING PAPER No. 485
By Rudiger Ahrend and William Tompson
All Economics Department Working Papers are now available through OECD's Internet web site at http://www.oecd.org/eco.
Document complet disponible sur OLIS dans son format d'origine
ECO/WKP(2006)13
Un
cl
assi
fi
ed
Eng
lis
h - O
r. Eng
Abstract
Realising the Oil Supply Potential of the CIS: The Impact of Institutions and Policies
This paper provides an overview of the political economy of oil in the CIS. It briefly situates the region’s oil sector potential in the global context, before analysing the structural features of the oil sectors by country. It examines the ways in which CIS oil industries have been organised and governed since 1991, as well as questions of transport infrastructure and export routes, which are especially critical for Central Asia’s landlocked producers. The paper finally considers the causes and likely consequences of the recent shift towards greater state ownership and control in Russia and Kazakhstan, the region’s most important oil producers. The paper’s central argument is that these changes have increased the risk that the full hydrocarbon potential of the CIS may not be developed in a timely and economically efficient way.
JEL Classification: L71, O57, P28, Q41
Keywords: CIS; Russia; Kazakhstan; Azerbaijan; Uzbekistan; Turkmenistan; Caspian; energy; oil; pipelines; political economy; growth; corruption; state ownership; pipelines; privatisation; property rights
************** Résumé
Réaliser le potentiel pétrolier des pays de la CEI : l'impact des institutions et des politiques publiques
Cette étude présente un panorama de l’économie politique du secteur pétrolier dans les pays de la CEI. Après une brève description du potentiel de la région, vu dans un contexte global, une analyse des caractéristiques structurelles des secteurs pétroliers pays par pays est présentée. L’étude propose également un examen des modes d’organisation et de gestion des industries pétrolières depuis 1991, ainsi que des questions d’infrastructure de transport et des routes de transit pour l’exportation, qui sont particulièrement cruciales pour les producteurs enclavés d’Asie Centrale. Enfin, les causes et les conséquences probables du mouvement récent vers un contrôle croissant du secteur par l’état en Russie et au Kazakhstan, les deux plus importants producteurs de la région, sont analysées. La conclusion principale de l’étude est que ces changements ont accru le risque que le plein potentiel des pays de la CEI ne soit pas développé de manière opportune et économiquement efficiente.
JEL Classification: L71, O57, P28, Q41
Mots-clés : CEI ; Russie ; Kazakhstan ; Azerbaïdjan ; Ouzbékistan ; Turkménistan ; Caspienne ; énergie ; pétrole ; oléoducs ; économie politique ; croissance ; corruption ; entreprises d’état ; privatisation ; droits de propriété
Copyright OECD, 2006
TABLE OF CONTENTS
1. INTRODUCTION ... 5
2. THE GLOBAL CONTEXT... 6
3. THE ROLE OF THE CIS IN WORLD HYDROCARBONS SUPPLY... 10
Output recovery... 10
Oil reserves and long-term potential ... 13
The challenges ahead... 15
4. PATTERNS OF OWNERSHIP, CONTROL AND TAXATION... 18
Russian Federation ... 19
Azerbaijan and Kazakhstan... 27
Uzbekistan and Turkmenistan ... 32
5. RECENT SHIFTS: TOWARDS RUSSO-KAZAKH CONVERGENCE? ... 37
Russian Federation ... 37
Kazakhstan ... 46
Russia and Kazakhstan compared ... 51
6. CONCLUSION... 53
ANNEX 1. ESTIMATING RUSSIAN OIL RESERVES... 58
ANNEX 2. RUSSIAN OIL-SECTOR TAXATION... 60
ANNEX 3. EXPORT INFRASTRUCTURE... 64
Russia ... 65
The Caspian producers ... 68
ANNEX 4. TRANSFER PRICING ... 71
Russian Federation ... 71
Kazakhstan ... 73
ANNEX 5. SELECTED MAPS... 75
BIBLIOGRAPHY... 80
Boxes 1. What about demand in the CIS and the Baltic States?... 18
2. Foreign investors and Russian oil in the 1990s... 21
3. The new Kazakh tax framework ... 50
Tables 1. CIS oil sectors, 2004... 10
2. Russian oil-sector investment, output and exports... 12
Figures
1. The CIS contribution to production growth... 7
2. Production of crude oil and NGL... 11
3. The growth of United States and Chiese oil consumption and CIS net exports ... 12
4. Change in oil reserves... 14
5. Oil companies: relative performance ... 22
6. Crude oil and NGL production in Azerbaijan... 27
7. Production of crude oil and NGL in Kazakhstan... 30
8. Crude oil and NGL production in Turkmenistan and Uzbekistan ... 32
9. The tax burden on the oil industry at difference prices... 39
10. Russian oil extraction and crude oil exports ... 40
11. Upstream capital expenditure in the Russian oil sector ... 41
12. Long-term CIS oil production forecast, 2002-24, mbd... 54
A2.1. The impact of changes in the NDPI and Export Duties, 2004-2005... 60
REALISING THE OIL SUPPLY POTENTIAL OF THE CIS THE IMPACT OF INSTITUTIONS AND POLICIES
Rudiger Ahrend and William Tompson1
The expansion of the state’s share of the oil sector will constrain the development of this sector of the economy.
–Aleksei Kudrin, Minister of Finance of the Russian Federation2
1. Introduction
1. During 1998–2004, the Commonwealth of Independent States (CIS) accounted for 60% of
incremental global oil supply. Despite a marked slowdown in production growth, preliminary data suggest that it accounted for around one-third of incremental supply in 2005. The CIS is the most important – and fastest-growing – oil-producing region outside OPEC. This paper assesses the potential long-term role of the CIS in global oil supply. Its major focus is on the degree to which fiscal and regulatory frameworks, and the broader institutional environment will facilitate or hinder the development of the region’s oil resources. The main conclusions that emerge from this analysis may be summarised as follows:
• The CIS is set to remain both the largest oil-producing region outside OPEC and the largest source of incremental non-OPEC supply. Much of the former Soviet space is still underexplored, but there is reason to believe that its relative weight in world oil production is potentially even greater than current reserve estimates suggest. Whether or not this potential is realised, however, will depend on the establishment of appropriate fiscal, legal and regulatory regimes.
• Although the three largest producers in the region – Russia, Kazakhstan and Azerbaijan – adopted
different strategies for developing their oil resources in the 1990s, all three were broadly market-oriented and largely reliant on private-sector initiative. This contributed to a strong recovery of investment and output in all three states after the initial post-Soviet contraction. The state-controlled oil sectors of Turkmenistan and Uzbekistan, by contrast, experienced far less disruption during the
1. The authors are grateful for the valuable comments received on earlier drafts of this text from Val Koromzay, Andreas Wörgötter, Vincent Koen and Doug Sutherland in the OECD Economics Department, Isabel Murray and David Fyfe of the IEA, Vladimir Milov of the Institute for Energy Policy, Evsei Gurvich of the Economic Expert Group attached to the RF Ministry of Finance, and Professor Paul Stevens of the University of Dundee. They also thank the many Russian and western officials, experts and businessmen, too numerous to list here by name, who discussed CIS oil issues with them. Finally, special thanks go to Corinne Chanteloup of the OECD Economics Department for technical assistance. The opinions expressed in the paper are those of the authors and do not necessarily reflect the views of the OECD or its member states.
early post-Soviet period but have since run into growing difficulties in trying to sustain output. Turkmenistan, in particular, is nowhere near realising its considerable potential.
• In recent years, however, policies in Russia and Kazakhstan have moved in a much more dirigiste
direction. The state’s direct role in owning and managing oil-sector assets has grown, sometimes as a result of quite heavy-handed action. This raises questions about the extent to which the growth potential of their oil industries will be realised over the longer term, particularly as geopolitical considerations seem to be increasingly prominent in government decision-making.
• While there can be little doubt that the role of CIS producers in global oil supply will continue to grow over the long term, that growth is likely to be slower than it would otherwise have been as a result of recent policy changes. The role of sovereign monopolies in the sector has grown, while private companies have been asked to accept lower returns on investment even as the authorities have acted in ways that increase political risk. This cannot but have a negative impact on investment decisions.
2. The paper proceeds as follows. The analysis begins with a brief examination of the global context and a look at the region’s potential on the basis of its current production and estimated recoverable reserves. The succeeding sections focus on the institutional arrangements and policies that the various CIS producers have adopted since the Soviet collapse and on the results of these policies. The discussion then turns to recent shifts in the policies of the two largest producers, Russia and Kazakhstan. This is followed by a brief discussion of the implications of those shifts for the future. It is important to stress at the outset that the study focuses on the region’s supply potential. There are many important oil-related issues it does not address, including questions such as the management of oil revenues and the policies available for combatting ‘Dutch disease’ and other problems associated with the so-called ‘resource curse’.3 The paper
does cover transportation issues, but it focuses on policy processes in this field rather than trying to identify specific routes and projects that are needed.4
2. The global context
3. Any assessment of the long-run supply potential of oil producers in the CIS must be set in the
context of growing global dependence on OPEC over the long term. The IEA (2004) sees OPEC’s market share rising from somewhat under 40% in 2002 to 53% in 2030, slightly above the historical peak recorded in 1973. Total non-OPEC reserves are being depleted faster than those of OPEC, and the world’s oil reserves are more and more concentrated in a limited number of OPEC states, where investment is not allocated according to market forces.5 Increasingly, therefore, global oil supply will depend on what the
members of the cartel do. This is a matter of particular concern, given that recent forecasts anticipate long-run average rates of growth of OPEC output of 2.5–3.5% per annum,6 which are actually well above
long-run historic averages for OPEC production growth. If the cartel acts collectively, it may conclude that it
3. For detailed analyses of these issues, see Ahrend (2006); Gianella and Chanteloup (2006); World Bank (2005a); and World Bank (2005b).
4. See Annex 3 for a brief overview of the state of the region’s oil export infrastructure and the prospects for its future development.
5. Brook et al. (2004:13).
has no incentive to increase output so rapidly and that it would be better off growing market share more slowly and profiting from higher prices.7
4. The CIS is both the largest oil-producing region outside OPEC and, at present, the principal
source of incremental supply (Fig. 1). It is not destined to become in any sense a real rival or alternative to OPEC, but the prospect of rising dependence on OPEC – and, in particular, on Middle Eastern OPEC – makes the potential development of non-OPEC supply even more important, for at least three reasons: the general desirability of maintaining diverse supply channels; the potential for instability or threats to supply within much of the OPEC area; and the fact that what the cartel does as reliance on OPEC increases will depend in part on the elasticities of both non-OPEC supply and oil demand. The higher the long-run elasticities of both demand and non-OPEC supply, the greater will be the incentives for OPEC to increase production rather than to restrict output in an effort to sustain high prices.8 Higher elasticities would
increase the potential for non-OPEC producers to act, at the very least, as ‘“softeners” on cartel-like behaviour’.9
A. World crude oil and NGL production growth Cumulative, 1998-2004
[image:8.595.71.509.296.468.2]Source: IEA, Oil information 2005 database. Source: IEA, Oil information 2005 database. Millions of metric tons Figure 1. The CIS contribution to production growth
B. Non-OPEC crude oil and NGL production growth, 1998-2004
Russia 48%
OPEC 26%
Rest of the world 14% Other CIS
12%
-20 -10 0 10 20 30 40 50 60 70 80
1998 1999 2000 2001 2002 2003 2004
CIS
Other non-OPEC
5. The importance of non-OPEC supply is all the greater in view of the likelihood that recent sharp
increases in world oil prices will be at least partly sustained over the coming years. To be sure, there is continuing debate about the degree to which cyclical, as opposed to structural, factors have been driving recent price hikes, but there is good reason to expect continuing market tightness over the medium term.10
At the same time, spare production capacity has fallen to historically low levels following a decade of low
7. For a detailed analysis of the incentives facing OPEC and its possible responses, see Gately (2004). Rehrl
et al. (2005) also take the view that OPEC has no economic incentive to push its market share much above 50% unless demand becomes much more price elastic. One could argue that the cartel may have trouble maintaining discipline, but the growing concentration of reserves in a few states may result in a better-functioning cartel. Even if cartel discipline broke down, it is not clear why members would want to ramp up production very rapidly rather than adopting a more cautious approach and keeping prices higher. 8. The impact of higher elasticities of demand and non-OPEC supply on OPEC’s incentives would also be
shaped by the awareness that these elasticities appear to be significantly asymmetric, since periods of high prices induce investment in energy saving technology and/or new production capacity that will not be reversed as and when prices fall. Cf Brook et al. (2004) and Gately (2004), appendix A.
9. Brook et al. (2004:6).
oil prices and low investment. OPEC’s spare capacity appears to have fallen to below 1.5mbd by the end of 2004 (around 2% of demand), as compared with a peak of around 10mbd (15% of demand) in 1985 and ‘normal’ levels of 3–5mbd in more recent years. Aggregate OPEC production capacity in 2005, though well above the lows reached in the early 1990s, was still below 1978 levels.11 Expectations of long-term oil
prices are critical to assessing likely developments in the CIS and with respect to non-OPEC supply generally. As Brook et al. (2004:13) point out, the long-run non-OPEC price elasticity of supply depends in part on whether or not the price change is believed to be permanent.12
6. Given that demand growth is expected to continue, the most contingent element in the picture is
oil-sector investment, which will determine supply, and hence price (albeit with a lag). The IEA’s latest (2004) global reference scenario anticipates cumulative global investment of around $3trn in year-2000 US dollars (roughly $105bn per year) during 2003–30, with exploration and development accounting for around 70% of the total.13 Most of this will be needed simply to replace existing capacity and offset the
natural decline of currently producing fields; only about a quarter is likely to address rising demand.14 The
IEA estimates that developing Russia’s oil resources successfully will require around $12bn per annum during the period to 2030 – roughly the level actually recorded in 200415 – with the other Caspian littoral states needing roughly $3.7bn a year over the period.
7. Whether or not such investment is undertaken in an efficient and timely manner will depend to a
great extent on developments within CIS states, but their prospects must be viewed against the backdrop of a number of global factors that may tend to depress oil-sector investment generally. So far, there has been little sign of a strong investment response to recent price rises.16 Until recently, expectations of low oil
prices rested in large measure on the assumption that any significant, sustained rise would generate a strong supply response in the form of investment in new capacity, as well as a slowdown in demand growth, but there has so far been little sign of either. Of course, supply and demand typically respond to price changes with a lag – it can take years for consumers to switch technologies and/or fuels, and most supply-side investment is characterised by long gestation periods.
8. There seems, however, to be more at work than a lag between initial investment and marketable
output. Uncertainty about the sustainability of recent price rises clearly seems to form part of the explanation. Forecasting long-term oil prices is notoriously difficult and past price expectations have often proved to be far off the mark. The experience of past price collapses has doubtless had a restraining effect. Moreover, price volatility makes it harder to distinguish between temporary and permanent price
11. IMF (2005:9–10, 13). At the same time, global demand rose by 2.7mbd in 2004 – the largest single-year demand increase since 1976. In 2005, demand growth eased somewhat, falling back to around 1.6%, the average recorded for 1994–2003 inclusive (Yergin 2006).
12. Brook et al. (2004) also observe that the elasticity of non-OPEC supply may be non-linear. A certain level, the oil price would be high enough to stimulate investment in the production of unconventional oil and/or particularly difficult or high-cost locations.
13. This estimate is based on an assessment of investment needs using the methodology set out in IEA (2003). 14. IEA (2004:121) makes the important point that global investment needs will be more sensitive to changes
in decline rates than to changes in oil demand.
15 Landes et al. (2005:61). Capital expenditure in the Russian oil sector (including upstream, refining and transport) is estimated at a record $12.5bn in 2004, more than double the level of 2000.
movements. It thus contributes to volatility of investment returns, which increases the required expected return on capital and complicates investment planning.17 International oil companies in recent years have
thus tended to base long-term plans on conservative long-run oil-price assumptions – in many cases, in the $20–25/bbl range even in late 2004/early 2005.18 There is some evidence that planning prices have started
to rise, at least for purchases of existing reserves,19 and upstream spending is accelerating. However,
anticipated market volatility and uncertainty about longer-term price trends seems still to be restraining energy investment, raising the possibility of a ‘volatility trap’.
9. The backdrop to all these concerns, of course, is the market power of OPEC and, in particular, of Saudi Arabia, its ‘swing producer’. This power is likely to make for a continuing conservative investment approach on the part of non-OPEC companies. With little spare capacity but low development costs, Saudi Arabia could increase capacity fairly quickly if it chose to do so.20 Ultimately, major oil companies’
reliance on relatively conservative assumptions about long-term average oil prices may reflect this. Non-OPEC producers, who generally face higher costs, may feel constrained to base investment decisions on a long-term price forecast that is at the lower end of what they believe Saudi Arabia and OPEC regard as their long-run target price range. Projects based on higher price forecasts could do the other producers considerable damage in the event that the cartel opted (for commercial or political reasons) to ramp up production and increase market share. However, the investment discipline exerted by OPEC’s power may also benefit the oil majors in the form of current windfall profits caused by their failure to invest more in the 1990s. The bias towards investment conservatism arising from OPEC’s market power thus needs to be recognised.
10. These considerations may matter more in the CIS than in some other regions, because CIS oil
production and transport costs are considerably higher than those facing OPEC and some non-OPEC producers. The huge sunk costs involved in developing CIS petroleum resources, as well as the political and other risks that the region presents, mean that investors need to be confident that long-term average prices really will be high enough to warrant such investment. Yet the inherent uncertainty of price dynamics in oil markets makes it difficult to be sure of this. What is crucial to bear in mind during the discussion that follows is that CIS governments can do much to affect the long-run price that investors reckon they need in order to make large, long-term commitments: fiscal conditions, regulations and other measures that influence production and transport costs directly affect the returns to oil production, while
17. While the return on investment for downstream electricity and gas companies has been relatively stable, oil and upstream gas companies, especially exploration and development companies and oilfield equipment and service companies, have experienced relatively volatile returns.
18. Stevens (2004) and Osmundsen et al. (2005) argue that value-based management theories and pressure to focus on short-term returns to capital reinforce this conservatism. Faced with very high prices, companies have tended to raise dividends and engage in share buy-backs rather than increasing investment. See also Kar-Gupta (2004) on how investment announcements by oil companies can lead to lower stock prices, owing to investors’ preference for buy-back programmes and other mechanisms for channelling profits to shareholders.
19. Chevron publicly lifted its planning price to the mid-20s at the end of 2004, and its bid for Unocal in early 2005 implied a rise to perhaps $30-35. Financial Times, 5 April 2005. BP has also indicated that it expects prices to remain at around $30 or more for a long time, though it has not made any explicit statement about the planning price used to assess investment projects.
actions that increase or reduce risk for investors will also tend to raise or lower the expected rate of return required to justify investment.21
3. The role of the CIS in world hydrocarbons supply
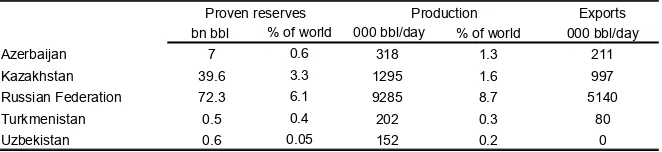
11. The CIS, while in no sense a long-term alternative to OPEC, is the biggest producing region in
the world outside OPEC and is likely to remain the most important source of non-OPEC supply for many years. Russia and Kazakhstan are particularly important, accounting together for over 90% of both proven reserves and crude production in the CIS (Table 1). Before considering the policy and institutional issues that will determine whether or not CIS oil resources are developed in a timely, economically efficient manner, it is necessary to examine the region’s recent performance and longer-term potential.
bn bbl % of world 000 bbl/day
Azerbaijan 7 0.6 318
Kazakhstan 39.6 3.3 1295
Russian Federation 72.3 6.1 9285
Turkmenistan 0.5 0.4 202
Uzbekistan 0.6 0.05 152 0.2 0
Source: BP, USEIA, OECD calculations
8.7 5140
0.3 80
1.3 211
1.6 997
Proven reserves Production Exports
[image:11.595.132.463.271.347.2]% of world 000 bbl/day Table 1. CIS oil sectors, 2004
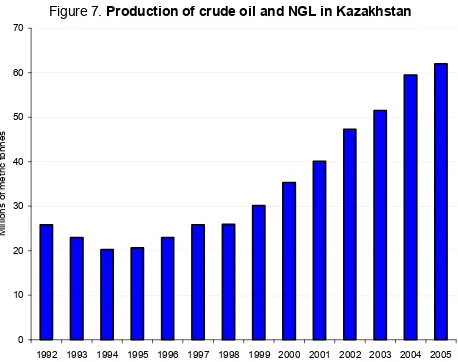
Output recovery
12. The rapid recovery in CIS oil output in recent years, driven chiefly by the turnaround in Russian production, has been one of the most important developments affecting world oil markets (Fig. 2). From a peak of almost 12.7mbd in 1987,22 Soviet oil output fell by 17% during the final years of the Soviet period,
a decline which accelerated sharply after the Soviet collapse, bottoming out at just under 7.2mbd. In the mid-1990s, however, a recovery began in Kazakhstan, followed by Russia, Turkmenistan and Azerbaijan.23
By 2004, CIS output had reached 11.4mbd – still below the Soviet-era peak recorded in 1987 but up nearly 60% on the low of 1996. Russia alone accounted for about three-quarters of this increase (almost 3.2mbd), although Kazakhstan recorded the most impressive growth rates, roughly tripling production in the ten years to 2004. The rapid expansion of Caspian output was not unexpected, in view of the on-going development of substantial new fields by foreign consortia, but the Russian recovery was a tremendous surprise to most observers, who consistently under-predicted CIS, and particularly Russian, output growth during 1996–2004.24
21. In respect of Russia, in particular, Dienes (2004) argues that it is institutions and politics, rather than geology and technology, that will really determine Russia’s future oil-production profile.
22. Including both crude oil and natural gas liquids.
23. The exception to this trend was Uzbekistan, which managed to sustain production growth through the 1990s, with output nearly tripling to 191kbd in 1998–99 before falling just over 20% over the subsequent five years. However, in addition to being a minor producer, Uzbekistan was a significant oil consumer. Oil exports were limited, as rising output was needed to cover domestic consumption.
24. IEA (2004:525) notes that from 1995 through 2002, each of its successive global projections raised
Source: IEA, Oil information 2005 database. Data for 2005 are preliminary. Figure 2. Production of crude oil and NGL
Millions metric tons
250 350 450 550
1992 1993 1994 1995 1996 1997 1998 1999 2000 2001 2002 2003 2004 2005
Russia Kazakhstan
Azerbaijan Turkmenistan
Uzbekistan Former USSR
13. The recovery of CIS oil production was as important as it was unexpected for global oil markets, especially once oil demand began to recover and prices to rise after 1998. During the six years to end-2004, CIS producers accounted for just over 60% of the increase in world output and 82% of the increase in non-OPEC output (Fig. 1). The CIS share of global production climbed by almost half over the period, from 10.0 to 14.4%, while the former Soviet Union’s (FSU) share of world exports rose from 8.9 to 13.4%.25 This contribution was critical at a time of rapid demand growth. Increases in CIS output during
1998–2004 came close to matching the combined consumption growth of the United States and China (roughly 4.2mbd), by far the two largest sources of demand growth over the period (Fig. 3). The IEA (2004), moreover, expects the non-OPEC share of world supply to continue growing to the end of the present decade, albeit with Kazakhstan and Azerbaijan accounting for an increasing proportion of incremental CIS supply. In both republics, projects now well under way should assure continued robust output growth through 2010.
25. Unfortunately, the available data on net exports are for the region of the former Soviet Union as a whole, not just the CIS, as the available data series do not separate out the Baltic states – their consumption is counted as part of the FSU total, not in net exports. National export data for the CIS oil producers is
Source: BP, Statistical review of world energy, 2005.
Figure 3. The growth of United States and Chinese oil consumption and CIS net exports
Million tonnes
-10 0 10 20 30 40 50 60 70 80
1998 1999 2000 2001 2002 2003 2004
Chinese consumption United States consumption Russian Federation net exports CIS net exports
14. In Russia, by contrast, there are expectations of much slower output growth. The growth of
Russian oil production since 1996 has resulted chiefly from rapid increases in output from already producing fields, made possible largely by the application of new technologies and, in many cases, the employment of western oil service companies. Russia has thus constituted a temporary exception to the rule that oil supply tends to be relatively inelastic in the short run: while the output recovery actually preceded the rise in prices, strongly increasing oil prices enabled Russian producers to increase upstream capital expenditure very rapidly, with most of this increase directed towards increasing production from existing fields (Table 2).26 Clearly, rapid growth cannot continue indefinitely on this basis: it represents a transitional, recovery phase. While there is probably scope for a few more years of reasonably good growth on the basis of further production increases from existing fields,27 sustained growth over the long term will depend increasingly on the development of new fields, both in West Siberia, where Russian production is now concentrated and where a number of sizable fields remain to be developed, and in less developed regions in the north and east of the country, as well as around the Caspian. These are proceeding relatively slowly: the Institute for Energy Policy estimated in mid-2005 that new fields would add only about 800kbd to Russian production over the period to 2009 (Milov, 2005). Dienes (2004) and Gaddy (2004) both anticipate that Russian oil production will shortly reach a peak, followed by a possibly steep decline, in part because the recent production surge has accelerated the depletion of existing fields, while far too little has been done to develop new ones. They believe that it is already too late to bring enough new production on-stream over the next decade to offset the decline in production from mature fields.
26. Estimates of capital expenditure are based on company data, which may differ from official statistics provided by the Federal Service for State Statistics (Rosstat) or the Ministry of Industry and Energy. However, all such financial data on the Russian oil sector should be viewed with caution, owing window-dressing in company accounts, problems with different accounting standards and other difficulties; in general, data on physical volumes of production, exports, etc, are more reliable.
1999 2000 2001 2002 2003 2004
Upstream capital spending 65 148 215 167 194 206
Crude and condensate production 101 107 115 125 139 151
Crude oil exports to non-CIS markets 98 118 125 139 156 183
[image:14.595.108.480.132.206.2]Source : Ministry of Energy, InfoTEK, Rennaissance Capital estimates, RIATEC, OECD calculations.
Table 2. Russian oil-sector investment, output and exports
1998=100
Oil reserves and long-term potential
15. The CIS appears to set to remain the most important oil-producing region outside the Middle East for some time to come. To be sure, assessments of its potential vary widely, depending on methods and definitions. There are considerable differences in estimates of the total volume of petroleum physically in place. Judgements about how much of this can be produced economically depend on assumptions about technological development, oil price trends and other variables (Annex 1). BP (2005) estimates CIS proven reserves28 at just under 121bn bbl, up 28.5% over five years. Russia accounts for 60% of this total, with
72.3bn, followed by Kazakhstan with 39.6bn.29 This leaves the CIS with 10.2% of world reserves and
40.5% of non-OPEC reserves, compared with a 61.7% share of world reserves for the Middle East as a whole, led by Saudi Arabia’s 22.1%. Moreover, the CIS has, in recent years, been the only major region to record strong reserves growth, although this partly offsets very slow growth during the late 1980s and early 1990s (Fig. 4).
28. ‘Those quantities that geological and engineering information indicates with reasonable certainty can be recovered in the future from known reservoirs under existing economic and operating conditions’.
Source: BP Statistical Review of World Energy 2005, OECD calculations. Figure 4. Change in oil reserves
-10% -5% 0% 5% 10% 15%
1985 1986 1987 1988 1989 1990 1991 1992 1993 1994 1995 1996 1997 1998 1999 2000 2001 2002 2003 2004
% chan
ge, 5ym
a
World reserves change 5yma OPEC reserves change 5yma Other non-OPEC reserves change 5yma FSU reserves change 5yma
16. There is good reason to believe that the CIS share of both reserves and output could rise further. Much of the CIS, including some geologically promising regions of Russia and Kazakhstan, is still under-explored, and relatively little exploration is taking place at present.30 On the basis of data for 1996, the US
Geological Survey (USGS) estimated that the former Soviet Union held just under 17% of as-yet undiscovered, technically recoverable oil in the world. This is based on the mean probability for the USGS estimates, which cover a range of probabilities, from 5% to 95%. Significantly, the estimated potential FSU share is substantially larger than its actual 2004 share across the whole range of estimates for different probabilities. The USGS figures have been subjected to some sharp criticism,31 but they remain the most
comprehensive and authoritative estimates of undiscovered recoverable reserves in the world. Moreover, criticism has been focused on the possible upward bias of the overall estimates, rather than their distribution. If the critics are right, there may be a substantially lower total volume of undiscovered oil than the USGS data suggest, but it is still likely that the potential CIS share is substantially larger than its current relative weight in proven reserves.32
17. This conclusion is also supported by other recent estimates. De Golyer and MacNaughton suggest
that the recoverable reserves of Russia alone could amount to about 150–200bn bbl and an assessment by
30. The question of exploration is discussed below and in Annex 1.
31. See, e.g., Greene et al. (2003); Aleklett (2004); Ferguson (2005). The probability estimates refer literally to the probability that as-yet undiscovered recoverable oil reserves are present. The highest figures are thus for the 5% figure, covering reserves that probably are not there to be found, while the much smaller 95% figure estimates quantities that are reckoned almost certain to be there. Sceptics argue that the actual figures are probably rather lower than the Survey’s ‘mean probability’ estimates, somewhere between its 5 and 50% estimates.
IHS Energy (formerly Petroconsultants) put Russia’s resource potential at 140bn bbl at end-2001.33 There
are also wide variations in assessments for Kazakhstan and Azerbaijan.34 World Bank (2005b:3) cites
estimates as high as 53.9bn barrels for the former, compared with BP’s figure of 39.6bn. According to Energy and Natural Resources Minister Vladimir Shkolnik, a seismic survey of the North Caspian conducted in 1994–96 identified 23 areas with large or medium-sized structures likely to hold oil in the Kazakh sector of the sea. It would be unrealistic to expect that the North Caspian will yield any further discoveries on the scale of the giant Kashagan field, discovered in 2000. However, if only half of these prospects prove to be productive, they could add a further 5–6bn barrels. Together with enhanced recovery
from existing fields, this could raise Kazakh reserves to the 50–60bn barrel range.35 Estimates for
Azerbaijan are much lower, but estimates of proven reserves run as high as 13bn barrels, and the government itself has claimed 17.7bn, albeit on the basis of the old Soviet system for classifying reserves.
The challenges ahead
18. It can by no means be taken for granted that the potential just outlined will be developed in a
timely, economically efficient way. On the contrary, many observers, including IEA (2004), anticipate that CIS output will stagnate or decline after 2010, owing chiefly to developments in Russia.36 Whether or not existing hydrocarbon resources are developed will depend critically on the institutional environment and on the policies pursued by CIS governments. While the impact of geology, geography and international price movements can hardly be ignored, there is much that policy-makers can do that could raise or lower the long-term elasticity of CIS supply. Indeed, fiscal, regulatory and institutional frameworks may actually matter rather more in the coming decades than they have hitherto – not only in the CIS but in most of the oil-producing world. As noted above, market volatility, capital discipline and an awareness of OPEC’s market power all constitute incentives for major oil companies to be more conservative in their planning and investment decisions. In such circumstances, fiscal and regulatory policies that unduly increase the risks facing investors add to the disincentives to invest, pushing up the expected rate of return required to justify investment.37 It is expected, moreover, that new oil finds will generally be smaller than in the past
and that an increasing proportion of output will come from offshore or other difficult-to-develop fields, involving higher production costs and much more extensive up-front investment in infrastructure and equipment.38 Project economics may thus be more sensitive to institutional and policy variables, as there is
33. Bush (2004). DeGolyer and MacNaughton predict that by 2012 Western Siberia will be able to increase oil production from the current slightly less than 6 million barrels per day to 10 million barrels per day and to retain this level for at least a decade.
34. Caspian reserves have long been a matter of debate: IEA (1998:32) notes that estimates of proven oil reserves in Central Asia and Transcaucasia then ranged between 15 and 40bn bbl, with a further 70–150bn bbl considered possible.
35. See Kochhar et al. (2005:23), table 3; and World Bank (2005b:3), table 5.
36. The Russian Ministry of Industry and Energy is similarly pessimistic, anticipating cumulative crude production growth of just 7.9–9.7% over 2004–08. See also Hill (2004), who argues that Russian oil production is in danger of repeating a historic cycle of underinvestment leading to difficulties sustaining production growth before renewed investment generates a revival. USEIA (2005) is much more optimistic, anticipating continued, albeit slowing, growth of both Caspian and Russian production through 2025. 37. In effect, governments may seek to capture a larger share of oil rents (and thus to reduce investors’ returns)
likely to be less margin for error.39 This could, of course, constitute an important source of pressure for
reform over the long run. However, it raises the risk of long delays in developing new deposits, as governments may be reluctant to accept the reforms that are needed to attract investment, especially with respect to operational control.
19. To these problems, which are common to oil producers around the world, must be added the
particular difficulties that CIS producers face in getting their output to market. These arise as a result of two factors. The first is geography. Most CIS production takes place well inland in Eurasia, often in very difficult geological and climatic conditions. The Caspian basin producers (except Russia) are landlocked, and even Russian production is generally a fairly long way from the sea. The country relies on a network of long overland pipelines and has relatively limited access to open water. Russia’s main maritime export routes, via Novorossiisk on the Black Sea and Primorsk on the Baltic, both suffer from severe winter weather and sit astride routes that are increasingly problematic on account of congestion – the Turkish and Danish straits respectively.40 The second problem is that the bulk of the export infrastructure was inherited
from the Soviet Union. The pipeline network, in particular, was designed primarily for domestic distribution and with the needs of a centrally planned economy in mind. While there has been considerable investment in maintaining and expanding export infrastructure, much remains to be done if infrastructure constraints are not to become an impediment to future growth in oil exports from the region. Infrastructure policies will thus be critical to realising the region’s long-term hydrocarbons potential. (See Annex 3 for a detailed look at export infrastructure problems.)
20. A related problem for Caspian producers will be a final resolution of the status of the Caspian
Sea itself, which has been contested since the collapse of the USSR at the end of 1991. Russia and Iran, harking back to the Caspian Sea conventions signed by the Soviet Union and Iran, initially insisted that the sea was an inland body of water (a lake) and must therefore be exploited exclusively through a condominium of all five states.41 Azerbaijan and Kazakhstan insisted that the Caspian was a sea, which
should be divided into separate territorial waters. Turkmenistan’s position shifted during the course of the 1990s and was not always entirely consistent. This did not prevent a number of bilateral deals among Caspian littoral states, nor did it stop development of the Caspian’s hydrocarbon reserves – even Russia
came gradually to accept de facto that the Caspian should be treated as a sea. In May 2003, Russia,
Azerbaijan and Kazakhstan formalised this understanding in a trilateral agreement on sub-surface boundaries and collective administration of the sea’s waters. They divided up the northern 64% percent of the Sea using a median line principle.42 This opened up opportunities to develop the northern part of the
sea, despite the refusal of Turkmenistan or Iran to sign the agreement.43 However, offshore development of
other sectors will have to await a more comprehensive settlement. At present, entire fields remain untapped due to the lack of clarity about ownership. Moreover, trans-Caspian pipelines are unlikely to be constructed
39. In the long run, this could actually contribute to improvements in institutions and policies, as governments may find that they cannot secure the investment and technology needed to tackle such projects without offering better conditions to investors.
40. Of course, Russia also has considerable offshore oil resources, some of which are already being developed. Projects on the shelf are not subject to the same difficulties with respect to transport, but they present considerable technical difficulties of their own.
41. This would have given Russia and Iran, with scant offshore hydrocarbon deposits of their own, an effective veto over the exploitation of the others’ offshore fields.
42. The agreement allocated 27% of the seabed to Kazakhstan, 19% to Russia and 18% to Azerbaijan.
Box 1. What about demand in the CIS and the Baltic States?
Of course, the CIS’s role as a net supplier of petroleum to the rest of the world depends on domestic demand trends as well as what happens on the supply side.1 Most observers expect that overall FSU energy demand growth should remain relatively subdued for some time to come. The CIS economies, in particular, are extremely energy-intensive. In Russia, energy consumption per dollar of GDP in 2003 was estimated to be 2.3 times the world average and 3.1 times the European average (calculated on the basis of purchasing power parity).2 The situation of other states
in the region is not dissimilar. To some extent, such high ratios of energy consumption to output are a product of factors such as geography, climate, the structure of industrial production inherited from Soviet central planning and the energy inefficiency of the industrial plant and infrastructure created during the Soviet period. These factors were compounded by the sharp fall in GDP during the 1990s – output fell far faster than energy consumption, so the energy intensity of GDP rose. Consequently, the growth of recent years has tended to reduce the energy intensity of GDP.
There is undoubtedly considerable scope for further substantial reductions in the energy intensity of production in the post-Soviet states, because progress in improving energy efficiency in most of the region has been relatively slow. Formal policies aimed at increasing energy efficiency in both consumer and producer states in the region have generally achieved little, owing to lack of both public and private finance, and weak incentives. Energy prices have generally remained at artificially low levels, and billing arrangements often provide for little consumer control or incentive for efficiency. Competition in electricity and heat sectors is either non-existent or has only recently begun to develop. However, all these factors are changing. Price developments are particularly important: energy prices within Russia have been rising relatively fast in recent years, as have those charged by Russia to other CIS countries and the Baltic states. Without economically meaningful energy prices, the incentives to increase efficiency will be too weak. The Russian government estimates that the country could reduce energy consumption per unit of output by almost half from current levels,3 and many of its CIS neighbours could do likewise. However, the implications of this trend towards greater efficiency for crude oil demand are unclear: crude consumption may rise relatively rapidly compared to other fuels, owing to changes in consumption patterns, including a rapid expansion of automobile ownership.
Wood McKenzie (2005) estimates that FSU oil demand will increase from 3.6mbd in 2003 to 4.1mbd in 2006. This means that growing demand in the region will, on the Wood McKenzie estimates, consume about one-quarter of the production increase over the period. The longer-term outlook is less clear. IEA (2004) has Russian domestic oil demand rising at the same rate as output (1.9% pa) for 2002–10, but demand thereafter grows slightly faster than output. The IEA reckons that that Russia’s net exports will peak around 2010, with consumption growth in excess of incremental production after that. USEIA’s (2005) long-term forecasts for the entire FSU region show demand growth accelerating sharply, to around 2–3% per annum after 2010, even as the region’s production growth slows. From around 2015, the USEIA sees production growth falling well below the rate of demand growth. However, incremental production will continue to be larger than incremental demand in volume terms, because the growth will be from a higher base. Thus, FSU supply to the rest of the world would, in the USEIA’ s base case, continue to increase through the end of the forecast period (2030), albeit by only about 70–100kbd per year after 2015.
__________
1. Demand, like net exports, is discussed in terms of the FSU (CIS + Baltic States), owing to the fact that the available data and projections cover the Baltic states together with the CIS countries.
2. ‘Energeticheskaya strategiya’, (2003:21). See also the even more pessimistic estimates in ISDEI (2003). 3. ‘Energeticheskaya strategiya’, (2003:21).
4. Patterns of ownership, control and taxation
21. In the years following the collapse of the Soviet Union, the petroleum producers among its
the modalities of foreign involvement varied widely.44 There were and are, of course, a number of common
features of the investment environment in all the CIS producers. These include a generally weak institutional framework, pervasive corruption, opaque and often changeable policy-making on the part of the authorities, and relatively high levels of political and economic uncertainty. To be sure, such problems are hardly unique to the CIS. Much of the world’s oil production originates in countries afflicted by similar problems. However, some western oil executives with experience elsewhere in the world privately report finding the CIS a particularly difficult place to operate, particularly with respect to corruption. There is some evidence, moreover, that these sentiments are widely shared: in recent years, former Soviet republics have consistently ranked below most other major oil exporters in Transparency International’s Corruption Perceptions Index.45 In addition, the legacies of the Soviet past – including both physical infrastructure and
institutions – and the problems of post-communist transition confront local and foreign oil companies with a unique set of challenges. Nevertheless, an awareness of the different paths taken by CIS producers is critical to understanding their development over the past decade and the challenges they now face. The following sections review the development of oil policies from the fall of the USSR until 2003. This discussion is followed by an examination of more recent shifts in oil policy in Russia and Kazakhstan.
Russian Federation
22. Perhaps the most unusual path was that taken by Russia: by the late 1990s, the Russian oil
industry was overwhelmingly in the hands of private Russian owners. This made Russia almost unique not only in the CIS but among major oil exporters around the world. State ownership is the global norm and Russia was by far the largest petroleum exporter whose sector was not dominated by a state company or companies (though in many countries state-owned petroleum companies operate as partners of private foreign companies).46 While the state continued to play an important role in the sector and even retained
ownership of some oil companies, the industry was dominated by privately owned domestic companies. The authorities created a number of vertically integrated companies (VICs) by presidential decree in the early 1990s and subsequently privatised them, often via highly questionable processes.47 The largest part of
oil-sector assets left state hands via the notorious loans-for-shares process of 1995–97, when the state transferred control over some of the country’s most valuable enterprises to politically well connected domestic business interests at extremely low prices.
23. Some oil companies were privatised into the hands of insider managers who were oil industry
professionals (so-called neftyaniki or oilmen), while others were acquired by politically well connected financial groups (the so-called finansisty), usually after those same groups had secured the allegiance of insider managers within the companies in question.48 The distinction between the finansisty and the
neftyaniki turns out to have been an important one, as the strategies pursued by the companies in the decade since privatisation have tended to reflect to some extent the different orientations of the two types of owner.49 The initial wave of insider-oriented privatisation was followed by a process of consolidation.
44. On the reasons for these divergent choices, see Jones Luong and Weinthal (2001) and Jones Luong (2004). 45. The major exceptions are Angola, Indonesia (now, in any case, a net oil importer) and Nigeria (which
consistently occupies second-to-last place in the index).
46. Russia’s gas sector, still dominated by a state-controlled, vertically integrated monopoly, is in this respect much closer to the norm worldwide.
47. For a detailed look at the privatisation of the Russian oil sector, see Lane (1999).
48. See Tompson (2002); in this respect, the loans-for-shares transactions resembled the insider-orientation of most Russian privatisation.
The larger VICs, which were privatised relatively early, bought up additional oil-sector assets as they were privatised and also swallowed up some of their smaller rivals – often employing methods as controversial as those that characterised the loans-for-shares sales. This left the industry dominated by a handful of the larger privatised VICs; by 2004, the top four private companies accounted for over 60% of output and almost 58% of exports (Table 3).50
Company Output (mt)1 Non-CIS exports
(mt)2
Refining (mt)
Yukos 85.7 31.3 31.9
Lukoil 84.1 29.3 35.5
TNK-BP 70.3 36.3 21.6
Surgutneftegaz 59.6 22.4 15.9
Sibneft 34 13.1 14.3
Tatneft 25.1 9.8 6.7
Slavneft 22 3.9 12.4
Rosneft 21.6 8.2 9.5
Bashneft3 12.1 – 18.3
Gazprom 12 0.4 6.4
Others (including JVs) 32.5 51.92 40.8
Total 485.8 206.6 195.0
[image:21.595.145.452.182.330.2]2 Data on exports by company includes only shipments carried by Transneft and exports from proprietary terminals. Rail, river and other bypassing deliveries are included in ‘others’.
Table 3. Major Russian oil producers, 2004
Source: InfoTEK, Ministry of Energy and Industry, Renaissance Capital.
1 Includes crude oil and condensate.
3 Data on Ufa-based refineries
24. While the VICs were privatised relatively rapidly and allowed to pursue their own development
strategies, the state kept a tight grip on the sector’s infrastructure, particularly the oil pipeline monopolist, Transneft. Since export infrastructure was and remains a scarce commodity, this constituted an important check on the power of the oil companies. Moreover, since all producers were dependent on the trunk pipeline network inherited from the Soviet system, there were strong arguments for operating it as a publicly owned natural monopoly. It would have made little sense to privatise Transneft in the 1990s, as a whole or following some sort of break-up. Nevertheless, Transneft’s position proved to be problematic in certain respects. Producers of better quality crude suffered losses as a result of Transneft’s failure to operate a quality bank, and the imposition of special charges to finance specific projects like the Chechnya bypass and the Baltic Pipeline System meant that oil producers were being made to pay for the construction of infrastructure they might never need or use. Moreover, although Transneft is, in principle, simply a regulated fee-for-service carrier, it has sometimes served as a regulatory instrument enabling the state to maintain a firmer grip on the Russian oil sector and to exploit its position as a key transit state for other CIS producers. As will be seen, the problems with Transneft’s role have grown more acute as oil output and exports have risen and the development of new transport infrastructure has become an ever more urgent concern.
25. A number of arrangements for rationing export pipeline capacity were employed during the years
following the Soviet collapse and many others were debated, some of them quite complex,51 but the system
has in recent years rested on the principle of ‘exports proportional to output’. Export volumes thus depend on production volumes for the previous quarter, albeit with some exceptions. Most large Russian oil
50. IEA (2004:307) notes that the tax system tends to favour larger companies, a factor that may have facilitated this consolidation process. The large VICs’ appetite for acquisitions was also aided in many cases by the weak institutional environment, which enabled them to manipulate privatisation processes, bankruptcy proceedings, etc.
companies seem reluctant to contemplate any move away from the proportionality formula, which, though subject to various exceptions and sometimes ad hoc adjustments, is generally regarded as fair, transparent and predictable.
Box 2. Foreign investors and Russian oil in the 1990s
Foreign access to privatisation deals in the 1990s was almost entirely blocked. This was not as much of a constraint on foreign penetration as it might appear, as most foreign oil companies initially tended to be more interested in entering Russia via joint ventures (JVs) or production-sharing agreements (PSAs) rather than by purchasing equity in Russian oil companies. Their appetite for Russian oil companies’ equity developed later.1
Foreign activity in the sector thus remained limited and was concentrated in a few large projects such as those on and around the island of Sakhalin, developed on the basis of production-sharing agreements (PSAs) negotiated in the early 1990s. Not coincidentally, such projects were usually in new and difficult oil regions, where foreign expertise and technology were badly needed and where there were no entrenched Russian incumbents to resist perceived foreign encroachment. Hopes for other foreign-financed projects to develop new fields on the basis of PSAs failed to materialise. Although a framework law on PSAs was adopted in 1995, it had little impact owing to the authorities’ failure to complete the legal framework needed for PSAs to function effectively.2 The procedures for negotiating and concluding PSAs were cumbersome in the extreme, the relevant tax code chapter was stalled for years, and much of the legislation that was passed clearly contradicted other legislation.
Much work on perfecting the legislative framework for PSAs was undertaken in 2001–02, but opponents of PSAs stepped up their lobbying, and in early 2003, the government decided that PSAs would be employed only in a small number of exceptional cases. The licence to exploit a field must first be put up at auction or tendered in some other way on the basis of the normal tax and royalty regime. Only if no bidders are found on such terms will the state consider concluding a PSA.
To be sure, it was never intended that PSAs would form the basis for the fiscal regime in the oil sector. They were seen as a transitional arrangement to facilitate investment while the country developed its tax code and regulatory framework. In the event, however, the authorities in the 1990s neither completed the PSA regime nor created a stable, efficient taxes and royalties regime.
________________
1. The most prominent exception to this rule was BP, which purchased a 10% stake in Sidanko for $500m in 1997. The Sidanko deal was followed by the financial collapse of 1998 and a successful attempt by TNK to take control of two key Sidanko subsidiaries, Kondpetroleum and Chernogorneft. The legal and political battles that ensued proved extremely costly to BP and illustrated many of the reasons why Russia was a dangerous place to do business, from the weakness of the rule of law to the readiness of the political authorities to meddle in commercial disputes. Nevertheless, BP persevered with its involvement in Russia, eventually reaching a settlement with TNK and subsequently taking a 50% stake in that company.
2. To date, only three PSAs have been concluded, two of which were authorised by presidential decree prior to the adoption of the 1995 law. These include Sakhalin 1 and 2, offshore in the Far East, concluded in the early 1990s, and Kharyaga, in the Yamalo-Nenets Autonomous Okrug, signed in 1995. The three projects account for just 1.3% of proven oil reserves and 0.7% of proven reserves of natural gas. By contrast, most of Kazakhstan’s oil resources are being developed under PSAs, with the Kashagan project alone accounting for perhaps a fifth of the country’s proven reserves.
26. While the formal tax burden on the sector in the 1990s was rather heavy – if all taxes were paid, the average producer in the 1990s often faced tax bills in excess of his operating margin, rendering extraction unprofitable52 – the effective tax burden appears to have been substantially lighter, owing to the
use of transfer pricing and other mechanisms to evade taxation.53 Thus, Vasil’eva and Gurvich (2005) find
52. See IEA (2002a:79–80) for details. Although effective tax rates were lower than they appeared at first sight in the 1990s, the formal tax system nevertheless constituted a significant problem, owing largely to its profit-insensitivity. This is addressed below.
that the total effective tax burden on the fuel sector in 2000 amounted to just 31.8% of the sector’s value added. However, the effective burden on individual producers varied widely, owing to distortions in the tax system itself. The corresponding figure for non-fuel industry was 43.7%, while that for transport and communications was just under 41%. Tax changes introduced during 2000–03 served to correct the situation somewhat, as the effective tax burden on the fuel sector rose by an estimated 7% of value added while the burden on non-fuel industry fell by almost 8.5%.54 Nevertheless, the sector remained highly
profitable and the effective tax burden on the industry in 2003, estimated at 38.9% of value added, was not far out of line with the average for non-fuel industry (35.3%). Since then, the tax burden on oil producers has increased markedly as a result of formal increases in the main oil-sector taxes, much tougher tax enforcement in the wake of the Yukos case and the mechanical effect of oil price rises on the rates of the major oil taxes. As oil prices have risen, the state, as the ultimate owner of Russia’s oil reserves, has become ever more determined to capture the rents arising from high prices. The state has every right to want to secure these rents, but the means it has employed have done considerable damage to the industry in the short run, as well as posing problems for its longer-term development. As will be seen, the crucial problem is not simply the overall level of the tax burden, but the profit-insensitivity of the system and the distortions this creates.
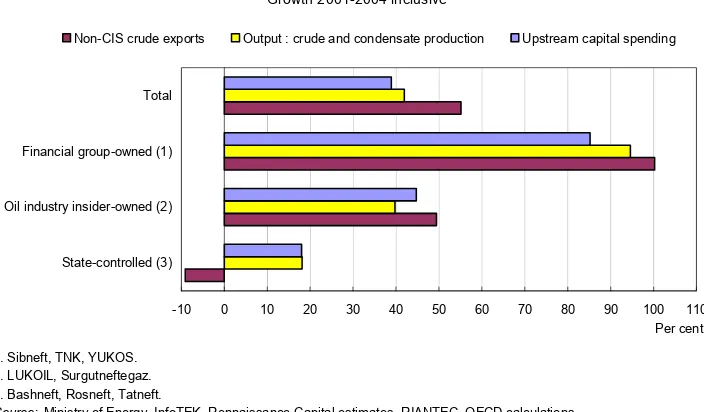
27. The combination of private ownership and low (effective) taxation proved extremely effective in
generating a rapid recovery of output. Production began to recover, albeit slowly, around the time that the new owners took control of the privatised VICs and began to restructure them. Output growth accelerated sharply after the 1998 financial crisis, as the recovery in oil prices, coupled with the perception that property rights had become sufficiently secure, contributed to a strong recovery in investment, output and exports (Fig. 5). Oil-sector investment jumped from roughly 25% of industrial investment before the crisis to around 35% in 2004. Strikingly, the investment revival began with companies controlled by the state or by the neftyaniki: by 2000, their investment was already 70% above 1998 levels.55 By contrast, oil
companies owned by the major financial groups, whose owners’ property rights were perceived as less secure, were investing only marginally more than in 1998. In 2001, however, as perceptions of the security of property rights further improved, the latter group of companies began rapidly increasing investment, soon reaching levels comparable with the former group. This investment led to a sharp increase in oil production and exports in the following years. Output growth, however, was uneven. During 1998–2004,
neftyanik- and finansist-controlled companies increased output by roughly 75% and 56% respectively, with
the output of the three largest finansist-owned companies up by 132%. State-controlled companies
increased output only marginally. The picture with respect to exports is even more extreme. While the non-CIS exports of state-controlled companies fell, non-non-CIS exports were up 49% in the neftyanik-controlled companies and 105% in the finansist-controlled companies (almost tripling in the three largest).56
54. General taxes, like VAT, were cut, while taxes specifically targeted at the fuel sector were raised. This process continued in 2004–05.
55. This assessment is consistent with the available data sources; however, the caveats provided in note 26 above, concerning the reliability of investment data, still apply.
56. Clearly, there may be an element of selection bias at work here, at least with respect to the production and export data: the privatisations of the 1990s did leave the state with many of the sector’s less attractive assets. However, this is unlikely to be the whole story, not least because it would not explain their failure to invest or to take greater advantage of opportunities for enhancing recovery from mature fields with the help of oil services companies. Moreover, the differences in the performance of finansist- and
1. Sibneft, TNK, YUKOS. 2. LUKOIL, Surgutneftegaz. 3. Bashneft, Rosneft, Tatneft.
[image:24.595.118.470.114.320.2]Source: Ministry of Energy, InfoTEK, Rennaissance Capital estimates, RIANTEC, OECD calculations.
Figure 5. Oil companies: relative performance Growth 2001-2004 inclusive
-10 0 10 20 30 40 50 60 70 80 90 100 110
State-controlled (3) Oil industry insider-owned (2) Financial group-owned (1) Total
Per cent Non-CIS crude exports Output : crude and condensate production Upstream capital spending
28. The obviously flawed nature of oil privatisation notwithstanding, the oil industry that emerged
after 1998 proved very dynamic. It was, indeed, the most important single driver of Russian growth during 1998–2004.57 It is important to note that oil production began to recover even before oil prices started to
pick up in 1999. The decisive factor appears to have been privatisation – clarification of ownership helped take oil producing enterprises ‘out of limbo’, and output grew fairly steadily after 1998 regardless of the oil price. Production growth even accelerated in 2001, despite a drop in prices that year. Clearly, rising oil prices gave the sector a tremendous opportunity, but they do not appear to have triggered the recovery. Nor, more recently, have record oil prices been sufficient to enable rapid growth rates to be sustained in the face of adverse developments with respect to state policy towards the sector.
29. The stark contrast in the relative performance of private and state-owned companies suggests that these undoubtedly impressive results owe a great deal to the decision to privatise – an impression that is reinforced by the contrast between Russia’s oil industry and its gas sector. Dominated by the state-controlled, vertically integrated monopoly OAO Gazprom, the gas industry is arguably Russia’s least-reformed major sector and undoubtedly one of its least efficient.58 By 2003, its unit labour costs were more
than double the levels of 1997: in a sector where wages were already four times the all-industry average
before the crisis, they rose much faster than for non-gas industry afterwards, despite a drop of around 20% in labour productivity – a truly spectacular underperformance. While industrial output rose by almost 40% in 2000–04 and crude oil output rose by 50%, gas production more or less stagnated. The Economic Expert Group attached to the Ministry of Finance estimates that the gas industry’s overall contribution to GDP
growth during 1999–2004 was actually slightly negative.59 The gas sector’s poor performance is an
extreme example, but not an isolated one: output and productivity in Russia have generally grown faster in
57. See OECD (2004), Chapter 1 and Ahrend (2006). 58. See Ahrend and Tompson (2004) for details.
sectors that were relatively free of state ownership and interference. Moreover, in sectors where private and state-controlled companies operate side by side, private companies have generally been more efficient.60
30. Nevertheless, the oil sector’s successes should not obscure the very real problems created by the policies of the 1990s. Both the perceived insecurity of property rights and the nature of the tax regime served to discourage long-term investment, as did the overall instability of the regulatory and fiscal framework. While investment did recover strongly after 1998, most oil sector investment has been aimed at increasing current production rather than developing new fields. It is not at all clear that the existing tax regime will be attractive when it comes to making large, up-front investments in the development of new fields. There are, indeed, good reasons to believe that it will not (Annex 2). Of course, the recent focus on investment in existing fields is hardly surprising in response to a rapidly rising spot price: the priority for companies has been to pump oil and get it to market while prices remain high. That said, investment patterns do suggest that doubts about the security of property rights are also having a distorting effect on capital expenditure. Companies controlled by the finansisty, whose property rights have tended to be seen as less secure than those of the neftyaniki, have also been significantly less inclined than the neftyanik -controlled companies to undertake long-term investment.61 They have focused much more on maximising current production and exports – precisely the behaviour one would expect of agents whose property rights were relatively insecure.62 This has prompted critics to claim that the finansisty have been extracting (and exporting) too much oil at the expense of long-term development. The question of over-extraction is hotly contested – engineers and oil-services companies working with the finansist-controlled companies insist that West Siberia’s recoverable reserves are far greater than previously realised and that, with the aid of
new technology, they have improved reservoir management. Either way, there is no doubt that these
companies have been less inclined than their rivals to invest in projects with long payback times.63
31. Short time horizons have also been one of the major factors behind the low level of exploration
activity. Three other factors are also at work. The first is that the companies and the state now assess reserves differently (Annex 1). By international standards, Russian oil companies are very well endowed with reserves and have done very well at growing them in recent years. Most of them thus feel no urgent pressure to undertake a great deal of new exploration. The state, by contrast, relies on a different set of reserves definitions and is chiefly concerned with the discovery of new resources in the ground, which have fallen far short of production-replacement levels.64 The second factor at work is the regulatory
framework, which fails to create any real incentives for companies to explore: there is still no guarantee that a company making a commercially significant discovery will have the right to develop the deposit – or
60. See OECD (2004:42–4 and 125–7).
61. See OECD (2004:42–4); Dienes (2004); and Gaddy and Ickes (2005). In hindsight, the former owners of Yukos, at least, appear to have been well advised to focus on investments with short payback periods. 62. Dienes (2004) attributes the finansist-controlled companies’ focus on current production to their
determination to maximise their market capitalisation. However, Gaddy (2004:349–50) rightly observes that oil companies’ stock market valuations in the West are not by any means a function of current production alone – indeed, reserves data are so important that companies have been known to fudge them in order to please the market. The short-term focus of the finansisty is easier to understand as a function of insecure property rights than as a response to capitalist incentives.
63. See Gaddy and Ickes (2005:13–14). In general, if an individual’s claim to the future return of a resource stock he currently controls is insecure, he has an incentive to maximise his immediate gains by extracting more in the short term than an optimal long-term extraction path would warrant.