IJPSR (2012), Vol. 3, Issue 05 (Research Article)
Received on 09 January, 2012; received in revised form 13 April, 2012; accepted 28 April, 2012
ANALYTICAL METHOD DEVELOPMENT AND VALIDATION FOR THE ESTIMATION OF CANDESARTAN BY DERIVATIVE SPECTROSCOPY (FIRST ORDER AND SECOND ORDER)
Gunjan Kalyani*, Vishal S. Deshmukh, Yogesh Vaishanv and Pranita Kashyap Shri Rawatpura Sarkar Institute of Pharmacy, Kumhari, Durg, Chhattisgarh, India
ABSTRACT
Candesartan cilexetil, a prodrug is a racemic mixture containing one chiral center at the cyclohexyloxy-carbonyloxy- ethyl ester group. It is soluble in dimethyl formamide, acetone, methanol, 0.1 N sodium hydroxide solution and insoluble in water. Objective of the present study is to develop a simple, sensitive, accurate, precise and rapid derivative spectrophotometric method for the estimation of candesartan in pure form. For the estimation of candesartan, solvent system employed was absolute methanol and wavelength of detection (λdet) was 268.8 nm for first order derivative spectroscopy. The linearity was obtained in the range 10 – 20µg/ml. The limit of detection is 0.5µg/ml and limit of quantification was fund to be 1.63µg/ml. For the estimation of candesartan, solvent system employed was absolute methanol and wavelength of detection (λdet) was 284.3 nm for second order derivative spectroscopy. The linearity was obtained in the range 40 – 160 µg/ml. The limit of detection is 6.7 µg/ml and limit of quantification was fund to be 20.4 µg/ml. Obtained results showed that there is minimum intra day and inter day variation. Both the developed methods were validated and recovery studies were also carried out. Sample recovery using the above methods was in good agreement with their respective labeled claims, thus suggesting the validity of the method and non-interference of formulation excipients in the estimation. First and second order derivative spectroscopy methods are simple, rapid and reproducible and further it can be used for the analysis.
INTRODUCTION: Candesartan cilexetil (prodrug is a racemic mixture containing one chiral center at the cyclohexyloxy-carbonyloxy- ethyl ester group. Angiotensin II receptor blockers (ARBs) are a new class of therapeutic agents for hypertension. The ARBs have a more direct mechanism of action than other drugs affecting the angiotensin converting enzyme inhibitors 1.
Candesartan is a potent, highly selective ARB that is devoid of agonist activity. It is administered orally as
Candesartan cilexetil, which is rapidly and completely hydrolyzed to Candesartan, the active moiety, during absorption from the gastrointestinal tract.
Candesartan cilexitil is white to off white powder. It is soluble in dimethyl formamide, acetone, methanol, 0.1 N sodium hydroxide solution and insoluble in water2. Keywords:
Candesartan, UV method development, UV derivative spectroscopy,
First order, Second order, Validation studies
Correspondence to Author:
Gunjan Kalyani
FIG. 1: STRUCTURE OF CANDESARTAN CILEXETIL
Mechanism of action 1: Candesartan cilexetil is a prodrug that has little pharmacological activity until it is hydrolyzed to candesartan during absorption. Candesartan competes with angiotensin II for binding at the AT1 receptor subtype. The drug blocks the vasoconstrictor and aldosterone-secreting effects of angiotensin II by selectively blocking the binding of angiotensin II to the AT1 receptor in many tissues, such as vascular smooth muscle and the adrenal gland9. Candesartan, ARB, is used alone or with other antihypertensive agents to treat hypertension. The action is different from ACE inhibitors, which block the conversion of angiotensin I to angiotensin II, meaning that the production of angiotensin II is not completely inhibited, as the hormone can be formed via other enzymes. Also, unlike ACE inhibitors, candesartan and other ARBs do not interfere with response to bradykinins and substance P, which allows for the absence of adverse effects that are present in ACE inhibitors (e.g., dry cough).
Literature review suggested several analytical methods that have been reported for the estimation of Candesartan in bulk or pharmaceutical formulations include High Performance Liquid Chromatography, and UV-Visible Spectrophotometry. Literature review also suggested that there is no First Order Derivative Spectroscopic method. The objective of the work was to develop simple, accurate, precise and economic First order derivative Spectroscopic method to estimate the candesartan in bulk. The method should be simple, accurate, precise, reproducible and statistically valid.
UV spectrophotometry is generally preferred especially by small-scale industries as the cost of the equipment is less and the maintenance problems are minimal. The method of analysis is based on measuring the absorption of a monochromatic light by colorless compounds in the near ultraviolet path of spectrum
(190-380nm). The fundamental principle of operation of spectrophotometer covering UV region consists in that light of definite interval of wavelength passes through a cell with solvent and falls on to the photoelectric cell that transforms the radiant energy into electrical energy.
Thus, the objectives of project:
I. To develop a simple, precise, accurate method, less time consuming & economical derivative spectroscopic method.
II. Under derivative spectroscopy, the development of First and Second Order derivative Method.
III. Validation of developed method using common parameters:
a) Linearity b) Precision c) Accuracy d) Sensitivity
e) Limit of Detection (LOD) f) Limit of Quantification (LOQ)
MATERIALS AND METHODS:
Year of experimentation: 2011
Site of experimentation: Shri Rawatpura Sarkar Institute of Pharmacy, Kumhari, Durg, Chhattisgarh.
Drug: The standard sample of CANDESARTAN was obtained as gift sample from Dr. Reddy’s Laboratory Pvt. Ltd., Hyderabad, A.P., India. The candesartan tablets were procured from local market, brand name CANDESAR (8 mg), manufactured by RANBAXY Laboratories, India.
Instrument specifications: UV Spectrophotometer, Shimadzu, model 1800.
For First order Derivative Spectroscopy
Preparation of stock solution: The stock solution of candesartan is prepared by dissolving 100 mg of drug in 100 ml methanol in volumetric flask with continuous shaking. 1 ml of sample was withdrawn and diluted to 100 ml methanol to get 10 μg/ml of solution. The solution was than scanned in UV range between 200-400nm UV-VIS Spectrophotometer, Shimadzu, Japan to determine the absorption maxima of the drug against blank as methanol.
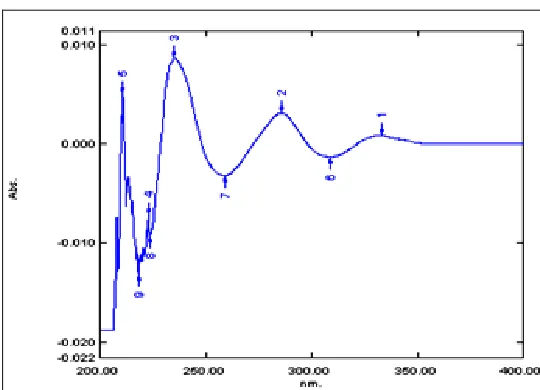
Wavelength scanning and determination of Absorption Maximum: From the stock solution of Candesartan, known concentration of 10μg/ml is prepared by suitable dilution with methanol. Wavelength scanned for the maximum absorption of drug solution using UV-Visible spectrophotometer within the wavelength region of 200–400 nm against blank methanol. Convert the normal mode obtained spectra to first order derivative. The wavelength that shows the peak with a highest absorbance is considered as absorbance maximum of the drug. The result is presented in fig. 2.
FIG. 2: WAVELENGTH SCANNING AND DETERMINATION OF ABSORPTION MAXIMUM
Linearity studies for Candesartan Analytical Method:
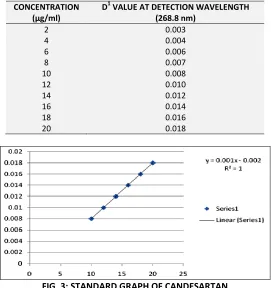
[image:3.612.315.586.54.342.2]Stock solution was subsequently diluted with methanol to get 2μg/ml, 4μg/ml, 6μg/ml, 8μg/ml, 10μg/ml, 12μg/ml 14μg/ml, 16μg/ml, 18μg/ml 20μg/ml, 22μg/ml 24μg/ml, 26μg/ml 28μg/ml, 30μg/ml. Convert the normal mode obtained spectra to first order derivative. The results are tabulated and the linearity curve was constructed by plotting concentration Vs. D1 value. The result is presented in table 1 and fig. 3.
TABLE 1: LINEARITY OF CANDESARTAN FOR FIRST ORDER
CONCENTRATION (µg/ml)
D1 VALUE AT DETECTION WAVELENGTH (268.8 nm)
2 0.003
4 0.004
6 0.006
8 0.007
10 0.008
12 0.010
14 0.012
16 0.014
18 0.016
20 0.018
FIG. 3: STANDARD GRAPH OF CANDESARTAN X – Axis: Concentration; Y- Axis: D1 value
Precision: The precision of method was ascertained; the percent relative standard deviation were calculated and presented.
Inter day and intraday studies for Candesartan Analytical Method: The prepared stock solution was subsequently diluted to get 2μg/ml, 4μg/ml, 6μg/ml 8μg/ml, and 10μg/ml. The resulting solutions absorbance was measured at detection wavelength of 268.8 nm using double beam UV spectrophotometer against blank of methanol. The findings was made at different time intervals in a day times in a day and performed continuously for six days. Convert the normal mode obtained spectra to first order derivative. The results obtained were tabulated and studied for inter day and intraday variation (table 2(a) and (b)).
[image:3.612.27.301.393.575.2]TABLE 2 (A) INTRADAY PRECISION FOR FIRST ORDER
S.NO CONC. (µg/ml)
D1 VALUE AT DETECTION WAVELENGTH (268.8 nm) TIME (MINS) I II III MEAN
1 18 1:30 PM 0.019 0.020 0.019 0.0196 2 18 1:45 PM 0.021 0.022 0.022 0.0213 3 18 2:00 PM 0.022 0.022 0.022 0.022 4 18 2:30 PM 0.021 0.021 0.021 0.021 5 18 3:30 PM 0.021 0.021 0.021 0.021 6 18 4:30 PM 0.021 0.021 0.021 0.021
MEAN = 0.021
SD = 0.000191
% RSD = 0.90
TABLE 2 (B) INTER DAY PRECISION FOR FIRST ORDER
S. NO CONC. (µg/ml) DAYS & DATE D1 at 268.8 nm
1 18 28.11.2011 0.019
2 18 29.11.2011 0.021
3 18 30.11.2011 0.022
4 18 1.12.2011 0.021
5 18 2.12.2011 0.021
6 18 3.12.2011 0.021
MEAN = 0.021
SD = 0.00028
% RSD = 1.33
TABLE 3 ACCURACY STUDIES FOR FIRST ORDER
TEST (µg/ml) STANDARD (µg/ml) D1 VALUE AT 268.8 nm CONC. (µg/ml) AMOUNT OF TEST RECOVERED (µg/ml) % RECOVERY
5 10 0.013 15 5 100
10 10 0.018 20 10 100
15 10 0.023 25 15 100
For Second order derivative spectroscopy
Preparation of Stock Solution: The stock solution of candesartan is prepared by dissolving 100 mg of drug in 100 ml methanol in volumetric flask with continuous shaking. 4 ml of sample was withdrawn and diluted to 100 ml methanol to get 40 μg/ml of solution. The solution was than scanned in UV range between 200-400 nm UV-VIS Spectrophotometer, Shimadzu, Japan to determine the absorption maxima of the drug against blank as methanol.
Wavelength scanning and determination of Absorption Maximum: From the stock solution of Candesartan, known concentration of 40μg/ml is prepared by suitable dilution with methanol. Wavelength scanned for the maximum absorption of drug solution using UV-Visible spectrophotometer within the wavelength region of 200–400 nm against blank methanol. Convert the normal mode obtained spectra to second order derivative. The wavelength that shows the peak with a highest absorbance is considered as absorbance maximum of the drug. The result is presented in fig. 4.
Linearity studies for Candesartan Analytical Method:
Stock solution was subsequently diluted with methanol to get 20μg/ml, 40μg/ml, 60μg/ml, 80μg/ml, 100μg/ml, 120μg/ml 140μg/ml, 160μg/ml, 180μg/ml 200μg/ml, 220μg/ml 240μg/ml. Convert the normal mode obtained spectra to second order derivative. The results are tabulated and the linearity curve was
constructed by plotting concentration Vs. D2 value. The result is presented in table 4 and fig. 5.
FIG. 4: WAVELENGTH SCANNING AND DETERMINATION OF ABSORPTION MAXIMUM
TABLE 4: LINEARITY OF CANDESARTAN FOR SECOND ORDER
CONCENTRATION (µg/ml)
D2 VALUE AT DETECTION WAVELENGTH (284.3 nm)
40 0.003
60 0.004
80 0.005
100 0.007
120 0.008
140 0.009
160 0.010
[image:4.612.314.584.324.519.2]FIG. 5: STANDARD GRAPH OF CANDESARTAN
Regression equation; y = 0.0001x + 0.003; R2 = 0.989; X – Axis: Concentration; Y- Axis: D2 value
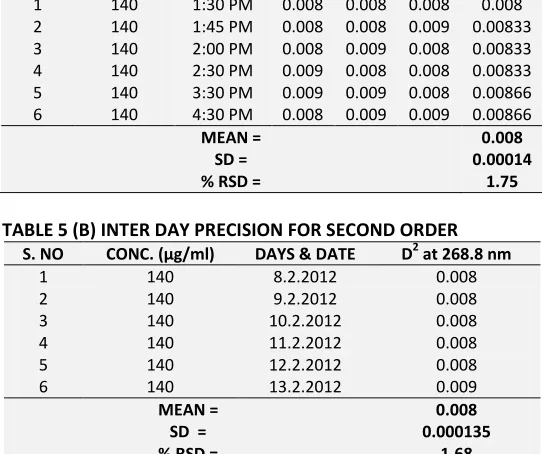
Inter day and intraday studies for Candesartan Analytical Method: The prepared stock solution was subsequently diluted to get 120 μg/ml. The resulting solution absorbance was measured at detection wavelength of 284.3 nm using double beam UV spectrophotometer against blank of methanol. The findings was made at different time intervals in day times in a day and performed continuously for six days. Convert the normal mode obtained spectra to second order derivative. The results obtained were tabulated and studied for inter day and intraday variation. The results are tabulated in table 5(a) and 5(b).
TABLE 5 (A) INTRADAY PRECISION FOR SECOND ORDER
S. NO CONC. D2 VALUE AT DETECTION WAVELENGTH
(µg/ml) (284.3 nm)
TIME
(MINS) I II III MEAN
1 140 1:30 PM 0.008 0.008 0.008 0.008 2 140 1:45 PM 0.008 0.008 0.009 0.00833 3 140 2:00 PM 0.008 0.009 0.008 0.00833 4 140 2:30 PM 0.009 0.008 0.008 0.00833 5 140 3:30 PM 0.009 0.009 0.008 0.00866 6 140 4:30 PM 0.008 0.009 0.009 0.00866
MEAN = 0.008
SD = 0.00014
% RSD = 1.75
TABLE 5 (B) INTER DAY PRECISION FOR SECOND ORDER
S. NO CONC. (µg/ml) DAYS & DATE D2 at 268.8 nm
1 140 8.2.2012 0.008
2 140 9.2.2012 0.008
3 140 10.2.2012 0.008
4 140 11.2.2012 0.008
5 140 12.2.2012 0.008
6 140 13.2.2012 0.009
MEAN = 0.008
SD = 0.000135
% RSD = 1.68
Accuracy studies: The accuracy/recovery studies were carried out by adding a known amount of drug from the pre-analyzed tablet powder and percentage recoveries were calculated. Convert the normal mode obtained spectra to second order derivative. The reproducibility of estimation was determined by performing the tablet drug content of different samples. The results of accuracy studies were expressed in %. The result is presented in table 6.
TABLE 6: ACCURACY STUDIES FOR SECOND ORDER
TEST (µg/ml) STANDARD (µg/ml) D2 VALUE AT 284.3 nm CONC. (µg/ml) AMOUNT OF TEST RECOVERED (µg/ml) % RECOVERY
5 60 0.004 65 5 100
10 60 0.005 70 10 100
15 60 0.006 75 15 100
RESULTS AND DISCUSSION: Candesartan Cilexetil is a novel, potent, highly selective non peptide angiotensin II type 1 (AT1) receptor blocker which is administered orally as Candesartan cilexetil, which is rapidly and completely hydrolyzed to Candesartan, the active moiety, during absorption from the gastrointestinal tract. The physico-chemical characteristic study of Candesartan like melting point is 165°C nearer to the literature value 168°C (www.drugbank.com. 2011). In previous literature Ganesh akula et.al developed the RP - HPLC method for determination of Candesartan in bulk sample and tablet dosage form. Subba Rao et al., developed and validated stability-indicating LC method for Candesartan and characterization of its degradation
products. The literature survey ascertains that HPLC analytical method is developed for Candesartan, which is cost effective.
[image:5.612.26.301.44.218.2] [image:5.612.314.585.80.307.2]μg/ml. Linearity study indicates the curve is linear in the range of 2 to 10 μg/ml. The linear regression equation is Y = 0.001*X – 0.002 with correlation coefficient (R2) = 1.
Different measured D2 values at detection wavelength 284.3 nm is plotted as the curve as D2 value vs. concentration. Candesartan obeys the beer’s law in the concentration range 40 to 160 μg/ml. The linear regression equation is y = 0.0001x + 0.003 with correlation coefficient (R2) = 0.989.
The developed method is validated for repeatability, reproducible and the accuracy and precision. In the inter day and intraday study of standard graph, the %SD is less than 2% indicating the developed method is reproducible. The different levels of standard concentration solutions are measured for D1 and D2 value and actual concentration is calculated. The results showed that the amount recovered is 100% indicating the first order derivative spectroscopic method is accurate and precise.
CONCLUSION: The developed analytical method for Candesartan by using first order derivative spectroscopy is found to simple, rapid and selective and the amount of drug recovered will be same as the label claimed and precise. It can be conveniently employed for the routine analysis and quantification of Candesartan.
REFERENCES:
1. Ganesh Akula, Kandikonda Saikrishna, RP- HPLC method development and validation of candesartan cilexetil in bulk and their pharmaceutical dosage forms, IJPSR, 2010; Vol. 1 (12): 191-196.
2. Rall, T.W: “Goodman and Gilman’s the pharmacological basics of Therapeutics”, Pergamon Press, New York, Eighth edition 1990.
3. Williams, A.D: Foye’s Principles of Medicinal Chemistry, Fifth edition 2002.
4. http://www.drugbank.ca/drugs/DB01222 accessed on 16/11/2011.
5. http://www.rxlist.com/rhinocort-aqua-drug.htm accessed on 16/11/2011.
6. Patel Jignesh et al. Q-Analysis spectrometric method for determination of candesartan cilexetil and hydrochlorothiazide in tablet dosage form. J chem. Pharm Res; 2010; 2(3): 10-14. 7. Chadburn, B. P. Proceedings Analytical Division Chemical
Society, 1982, 19, 42s.
8. European Brewery Convention, Analytica 4th ed Method 7.4.1., 1987, p. E123.
9. Fell, A. F. Proceedings Analytical Division Chemical Society, 1978, 15, 260.
10. Fell, A. F. U.V. Spectrum Croup Bulletin, 1979, 7, 5.
11. Fell, A. F. Proceedings Analytical Division Chemistry Society, 1980, 17, 512.
12. Budavari. S: The Merck Index, An Encyclopedia of Chemicals, Drugs and Biologicals, White House Station, N. J., Thirteenth edition. 2001.
13. Reynolds, J.E.F and Prasad B.A., IN; Martinadale, the Complete Drug Reference, the Pharmaceutical Press, London, 33rd Edn, 2002, 853.
14. Pfister, M et al: Pharmacokinetics and haemodynamics of Candesartan cilexetil in hypertensive patients on regular haemodynamics; British Journal of Clinical Pharmacology 1999, 47:645-651.
15. Sever, P., Menard, J., Eds: Angiotensin II antagonism refined: Candesartan cilexetil, Journal of Human Hypertens; 1997, 11(Suppl 2): S 1- 95.