Full Length Research Article
STEADY FLOW SIMULATION IN ANAMBE RIVER BASIN USING HEC-RAS
1*
Vieux Boukhaly Traore,
2Soussou Sambou,
3Hyacinthe Sambou and
4Amadou Tahirou Diaw
1,2
Department of Physics, Laboratory of Hydraulics and Fluid Mechanics (LHMF), BP 5005, Dakar-Fann, Senegal
3
Institute of Environmental Sciences, Faculty of Science and Technology, University Cheikh Anta Diop of Dakar,
BP 5005, Dakar-Fann, Senegal
4
Department of Geography, Laboratory and Research in Geomatics (LERG), BP 5005 Dakar-Fann, Senegal
ARTICLE INFO ABSTRACT
In many developing countries, food safety became a top priority for authorities and water resources managers. It is directly related to human’s life and economic development. Due to this necessity, the government of Senegal has selected the valley of Anambe of 16000 ha, to develop irrigated agriculture through rice cultivation. Two dams (Niandouba and Confluent) have been built to reinforce water availability due to climate change and variability effect on the rainfall. For a better management of this hydraulic system, the knowledge of flow dynamic is required. In this paper, we have used Hec-ras model to describe the hydraulic behavior of this system. The river reach selected, is located between the confluence dam and Kounkane threshold. From an image LANDSTAT of this area, we have divided the river reach into 24 cross sections perpendicular to flow direction and numbered from 1 to 24. ArcGIS software is used to extract bathymetry for each cross section. This allows creating the river geometry with Hec-ras. Four stream flows have successively fixed as upstream boundaries. For each stream flow, Hec-ras calculate the flow characteristics. The high and low flow characteristics areas have been located. The most of these flow parameters decreases from upstream to downstream.
Copyright © 2015 Vieux Boukhaly Traore et al. This is an open access article distributed under the Creative Commons Attribution License, which permits unrestricted use, distribution, and reproduction in any medium, provided the original work is properly cited.
INTRODUCTION
Understanding of the flow dynamics in a river system is an important step towards the satisfaction of the water needs. This understanding must include an appropriate modeling to monitor the spatial evolution of the flow characteristics (Traore et al., 2013). The use of hydraulics models as decision support, has become essential to better describe and knowledge the flow characteristics, particularly the water surface profiles (Seago and Mckenzie, 2008; Karim, 2009). However, the choice must be made by identifying a parsimonious model structure which provides good predictive power and represents the real behavior of the hydraulic system (Xavier et al., 2010; Bordbar et al., 2013). This representation passes by the estimation of the most important hydraulic parameters of flow such as water surface, Froude number, water flow velocity, slope… (Sanjay et al., 2014; Hunter et al., 2007). In this paper, we focus on the Anambe river basin located in the southern part of Senegal. Due to the climate change and variability whose effects are the decrease of the
*Corresponding author: Vieux Boukhaly Traore
Department of Physics, Laboratory of Hydraulics and Fluid Mechanics (LHMF), BP 5005, Dakar-Fann, Senegal
precipitations, this river has been selected by the government to develop irrigated agriculture in the research of food safety which is the first necessity for human’s life and development. Thus, with a flood plain of 16000 ha and favorable climatic conditions have made, this region into an agricultural hub. Two dams (Niandouba and Confluent) have then been built to reinforce water availability. This hydraulic system aims at water allocation for irrigated perimeters of the Anambe area through Waïma storage lake. An efficient management of this river system for water allocation and for hydraulic structures implementation such as pumping stations needs a tool for hydraulic system analysis based on water surface profile and water depths calculation. A better understanding of the hydraulic behavior of this basin is required. This research investigates and analyses the dynamic of the flows of Anambe river basin for an application to the irrigation of lands suitable for rice cultivation. Hec-ras model based on hydraulic routing is selected to describe the hydraulic behavior of this river basin by performing steady flow calculations in order to generate water surface profiles for different discharges. This software is widely recommended in analysis of hydraulic systems because it provides useful information for water management and planning (Tayefi et al., 2007; Jensen et al., 2004; Brych et al., 2002; Santos et al., 2012).
ISSN: 2230-9926
International Journal of Development Research
Vol. 5, Issue, 07, pp. 4968-4979, July, 2015
DEVELOPMENT RESEARCH
Article History: Received 14th April, 2015
Received in revised form 29th May, 2015
Accepted 19th June, 2015
Published online 30th July, 2015
Key words: Hec-ras model, Hydraulic Simulation, Water flow parameters, Anambe river basin,
This model is very little demanding in data, it is very easy to provide results (Pappenberger, 2005; Mohammed et al., 2006). Its application on the basin of Kayanga gives satisfactory results. It allows identifying the high and low flow characteristics areas such as water surface profiles, water surface elevation, flow velocity, top width, slopes, surface, volume, energy grade line elevation, wetted perimeter,… and the large and narrow width areas have been located .It also allows view the hydraulic parameters including water surface profiles evolution along the river reach. These results also indicate that Hec-ras model is suitable for investigation and simulation of hydraulic flows in irrigation network of Anambe river.
MATERIALS AND METHODS
Study Area
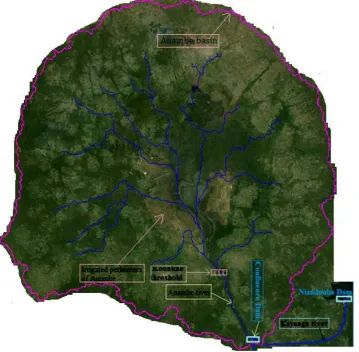
The Anambe Basin (12 ° 30 'and 13 ° 10' north, 14 ° 08 'and 14 ° 20' west), is located in high Casamance between the departments of Kolda and Velingara (OMVG, 2008). It is a tributary of the Kayanga river which rises in Guinea and drains a watershed of 1100 km2 (Dacosta and Gomez, 1998). The Anambe basin (Fig 1) has an almost circular shape with a stalk that connects the Kayanga (Soumare, 1999). It is the domain Sudanese climate with a rainy season from June to October and a dry season from November to May. The annual rainfall in the basin varies slightly from north to south (Dacosta, 1989). The average annual rainfall is 1040 mm at the Kounkane station.
Temperatures reach their peak in May before the rains and decrease during the winter; a new maximum occurs in November and a cool season from December to February. The relative humidity reaches its maximum in September and the minimum in January. The winds are generally moderate and evapotranspiration is estimated at 1800 mm / year (Dacosta et al., 2002).
Hydrology of Anambe
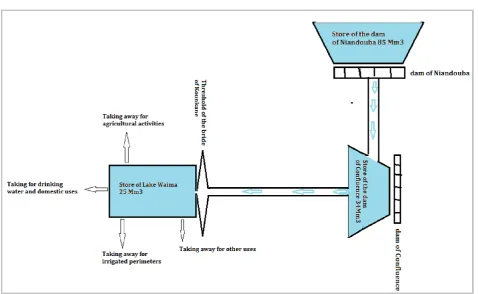
[image:2.595.121.481.415.767.2]The Anambe water resources consist rainfall and runoff inputs of Kayanga River diverted by the Confluent dam for filling the bowl of Anambe. The one and the other depend on the climate regime characterized by alternating dry season and a rainy season. The framework of the activities on this basin is built around activities related to water such as agriculture which is dominated by rice cultivation (Diouf, 1999). The water management in the basin Anambe is based on the principle of mobilizing of the water resources of Anambe-Kayanga system and their use for irrigation of land suitable for rice cultivation (Coly et al., 2002). The key feature of the hydro system is constituted by the reservoir of confluence dam which receives water from the dam Niandouba by gravity and fills the lake Waïma. It also receives tributaries runoff. This operation is theoretically valid during the rainy season or during periods of high water. In low water, some of the water is trapped in the lake by the Waïma threshold of Kounkane Bridge. This store is used for hydro-agricultural activities in the Anambe flood plain of against season (Dacosta et al., 2002). We present in below the diagram of the general device of the Kayanga-Anambe system (Fig 2).
Hec-ras Numerical Modeling
HEC-RAS (Hydrologic Engineering Center River Analysis System) is numerical software for flow river hydraulics calculations (Darshan, 2014). It was developed by the Hydrologic Engineering Center, a research group for the U.S. Army Corp of Engineers (Robert et al., 2012). This software contains three hydraulic components for flow analysis: (1) steady flow water surface profile computations; (2) unsteady flow simulation; and (3) movable boundary sediment transport computations (Hasani, 2013). A key element is that all the three components will use a common geometric data representation and common geometric and hydraulic computation routines (Amir et al, 2012). It is widely used in one-dimensional flow characteristics calculations including water surface profiles, energy grade line, water depth, velocity, wetted perimeter,… in case of steady and unsteady river flow regimes (Henry and Walton, 2008; Robert et al., 2012). These computations are essential in the analysis of various problems, including the determination of the effect of hydraulic structures on the upstream and downstream channels; the estimation of flood plain; the analysis of the capacity of river for irrigation; the monitoring of the depth at any point in river; the choice of implantations sites of hydraulic structures (such as dams, pumping stations,) ; the corrections of the rivers in order to avoid a possible overflow in the event of rising. These various applications deserve to give to the flow main parameters calculations a great interest (Karney et al., 2010; Ali et al., 2011). In this work, the steady flow component of Hec-ras was used to perform flow parameters (such as water surface profiles, water surface elevation, energy grade line elevation, water flow velocity,..) of the Anambe River in order to analyze this hydraulic system. The basic data requirements for simulation are included:
geometric data, river system schematic, cross section geometry, reach lengths, Manning’s roughness coefficient, contraction and expansion coefficients, steady flow data, boundary condition, flow regime (Harman et al., 2008).
Basic equations of Hec-ras
[image:3.595.61.540.50.344.2]In HEC-RAS steady state simulation, water surface elevation and energy grade line of two adjacent cross sections are calculated by applying the standard step iterative method to one-dimensional energy equation (Goodell and Warren, 2006). This equation is shown in (1) for two adjacent cross-sections (Nemati et al., 2011; Dragan et al., 2014). (Fig 3) illustrates the main computing process based on solution of energy equation (Maghsoud et al., 2012).
Figure 3. Energy equation between two spots (adapted of Maghsoud et al., 2012)
2 2
2 2 1 1
2 2 1 1
2
2
eV
V
Z
Y
Z
Y
h
g
g
[image:3.595.311.559.561.699.2]
(1)Where: Z1, Z2 are elevations of the main channel inverts in m;
Y1, Y2 are depths of water at cross sections in (m); V1, V2
averages velocities (total discharge/total flow area) in m/s; α , α = velocity weighting coefficients; g is gravitational acceleration in m/s2 ; he is energy head loss in (m).
The energy head loss (he) estimation is given by the Manning’s equation (2) which is considered to be empirical (Mazhar et al., 2010)
2 2
2 2 1 1
2
2
e f
V
V
h
LS
C
g
g
(2)Where: L is discharge weighted reach length in m; S is
representative friction slope between two adjacent sections; C is contraction or expansion loss coefficient. The
representative friction slope using the average conveyance equation and the distance weighted reach length are defined in (3) and (4), respectively (Dragan et al., 2014).
2 1 2 1 2 f
Q
Q
S
K
K
(3)lob lob ch ch rob rob
lob ch rob
L Q
L Q
L Q
L
Q
Q
Q
(4)Where K is conveyance, Llob , Lch , and Lrob are cross-section
reach lengths for flow in the left over-bank, main channel, and right over-bank, respectively, and Qlob , Qch , and Qrob are
arithmetic average of the flows between sections for the left over-bank, main channel, and right over-bank, respectively. The Conveyance is calculated for each subdivision using Equations (5) and (6) (Dragan et al., 2014).
1 2
f
Q
KS
(5)2 3
1.486
K
AR
n
(6)Where: K is conveyance for the subdivision; n is Manning’s roughness coefficient for the subdivision; A is flow area for the subdivision; R is hydraulic radius for each subdivision. Solving these equations requires knowledge of the geometry of the stream, its roughness characteristics, the flow rate and boundary conditions.
Boundary Conditions
The steady one-dimensional flow model can calculate subcritical, supercritical and mixed flow regime water surface profiles (Karney et al., 2010; Sunil et al., 2014). For subcritical flow, one condition is needed at the downstream boundary, and the computation starts from the downstream boundary and progresses to the upstream. Supercritical flow requires only one upstream condition; water profile is computed from upstream boundary to downstream boundary. When flow regime is mixed, both downstream and upstream boundary conditions are required (Karim, 2009; Beltaos and
Patrick, 2013). There are three kinds of boundary conditions (critical depth, normal flow depth, or a given depth downstream of the channel), but only one is needed (Alemseged and Rientjes, 2005). In the Anambe system, the river flow is subcritical. Depth at Kounkane is fixed as the downstream boundary conditions.
River Geometry creating process
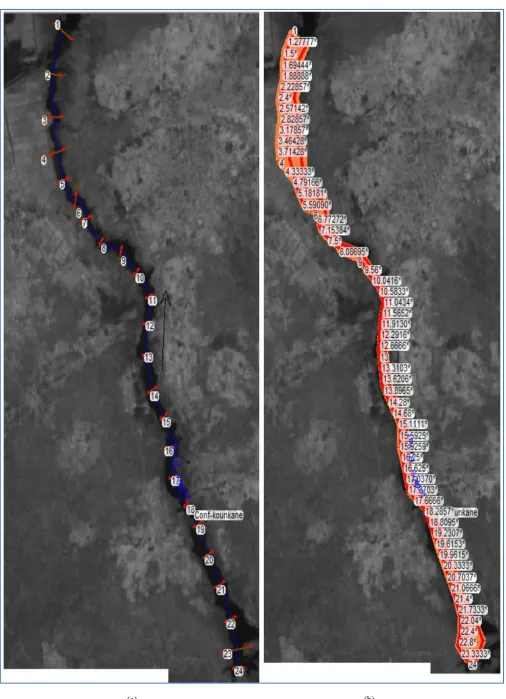
From an image LANDSAT of the Anambe river basin, we have divided the river reach into 24 cross-sections perpendicular to flow direction from confluence Dam to Kounkane threshold. They have been numbered from 1 corresponding to Kounkane cross section (downstream) to 24 corresponding to confluence Dam cross section (upstream). ArcGis have been used to extract bathymetry and generate the distance between two adjacent cross sections. To increase the stability of calculation and have a step of space even finer, we have added by interpolation additional cross sections between two existing consecutive cross sections. Coefficient values of Manning roughness are fixed to 0.06 for left overbank, 0035 for main channel and to 0.05 for right over bank. The contraction coefficient is fixed to 0.1 while the coefficient of expansion is fixed to 0.3. Application of Hec-ras has allowed creating River cross-section cut lines (Fig 4).
Steady flow Calculations
After creating river geometry, the next step is to specify the discharges values, flow regime and boundary conditions to perform the calculations. In this paper, the flow is subcritical, and the known downstream depth equal to 2.2 m is then used as a boundary condition. Four steady flow discharges (50m3/s, 100m3/s, 200m3/s and 400m3/s) have been fixed at upstream corresponding to confluence dam outlet. For a given discharge, the water surface profiles, and the main hydraulic parameters have been computed.
RESULTS AND DISCUSSION
Cross section plots
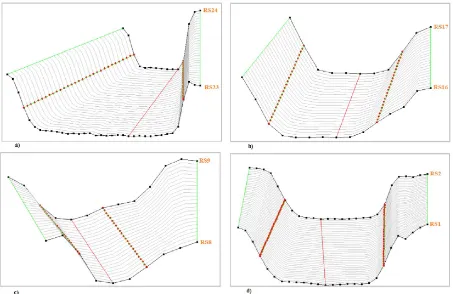
We present in (Fig 5) cross sections plots at river station 24, 16, 8 and 1; in (Fig 6) interpolated cross sections plots between river station 24 and 23, 17 and16, 9and 8,2 and 1. These cross sections have not the same width because of significant changes in the topography of the bed in Kayanga River. It’s been observed in these examples that the cross sections 8 and 16 are narrow, and cross sections 1 and 24 are larger. This is due to the significant change in the topography of Anambe river bed.
Energy grade line elevation
(a) (b)
Figure 5. Cross-section plots in HEC-RAS Model: a) at River Station 24; b) at River Station 16; c) at River Station 8; d) at River Station 1
[image:6.595.72.525.458.752.2]Water Surface Elevation
(Fig 8) shows water surface elevation for the different discharges fixed at the upstream. It increases with discharges. For given discharge, water surface is constant from cross section 24 to cross section 8 due to a very low value of the free
[image:7.595.75.524.51.346.2]surface slope and it decreases quickly from cross section 8 to cross section 1 due to a high value of the free surface slope. Water surface elevation is sensitive to deformation of bottom slope of the Anambe River.
Figure 7. Energy grade line profiles
[image:7.595.70.526.98.667.2]Water Surface profiles
We present in (Fig 9) water surface profiles for the different stream flows fixed at the upstream. The free surface slope increases with discharges. For given discharge, water surface
[image:8.595.90.514.65.624.2] [image:8.595.87.514.337.683.2]profile remains constant between cross sections 24 and 8; it decreases quickly from cross section 8 to cross section 1.We conclude that the free surface slope is important between cross sections 24 and 8 but it is very close to zero between cross sections 8 and 1. These results show that the Anambe area is
Figure 9. Distribution of Water surface profiles
bottom slope of the river.
Velocities Profiles
(Fig 10) shows flow velocity profiles for various discharges specified at the upstream. It’s been observed that velocity increases with slopes for given stream flow. Low slopes correspond to low velocities (from upstream to cross section 8). In these cross sections, stream power, total shear are practically null.
section slope, stream power and shear are more important but flow area is smaller. Thus, the variations of flow velocity are due to the significant changes in the topography of the river bed and the roughness coefficient effect.
Total Wetted perimeter
[image:9.595.87.512.184.764.2]We present in (Fig 11) wetted perimeter profiles for the different stream flows fixed at the upstream. It is been observed that wetted perimeter increases with discharge.
Figure 11. Wetted perimeters distributions
From cross section 22 to downstream, wetted perimeters have practically the same level. In these cross sections, flow area and specif force are lower. The highest wetted perimeter is observed at cross sections 23 corresponding to outlet of confluence dam. It is also observed that low wetted perimeter corresponds to narrow section and high wetted perimeter corresponds to larger section.
Thus, the water level profile in cross sections changes according to the top width and consequently leads to the decrease in river capacity.
Total Surface Area
[image:10.595.85.512.48.654.2]We present the (Fig 12) the surface area profiles for different discharges. It is been observed that total surface area increases
[image:10.595.89.515.54.343.2]Figure 13. Total volume profiles
gradually from upstream to downstream. The reduction of the surface areas is due to the soil texture through its permeability, evaporation and to the roughness coefficient effect. This can affect the dynamics of the flow to the downstream of the river.
Volume distribution
(Fig 13) shows the total volume profiles for various discharges. It is been observed that the total volume increases with discharge. For given stream flow, the volume decreases slowly from upstream to downstream. This reduction can be due to the soil texture through its permeability, evaporation and roughness coefficient effect. This can negatively impact on the availability of water to downstream for agricultural needs.
Froude number
(Fig 14) shows the dimensionless Froude number evolution along the reach for various discharges. It is been observed that it increases with discharge. For each stream flow, Froude number is less than 1 at all cross sections except cross section 8 where it is equal to1. This indicates that the flow regime is critical in cross section 8 and subcritical in the other cross sections corresponding to the real case of the study river.
Conclusion
Food security is a necessary step for stability in developing countries. This important role has recently made him a focus of authorities and decision makers. This paper analyzes the dynamic of the flow in Anambe river basin The flood plain of this river is selected by the Government of Senegal to develop irrigated rice cultivation in the fight against hunger. Hec-ras model was used to calculate the main flow characteristics along the study reach to better understand the hydraulic behavior of this river. This allows identifying the high and low flow characteristics areas such as flow velocity, depths, slopes, surface, volume and their spatial evolution along the river reach. The large and narrow width areas have been identified. The analysis of the results show that the most of hydraulic parameters decreases from upstream to downstream. These results give a basis for reflection for decision makers to better understand the Anambe system and optimize water resources management o for an application to the irrigation. However, it is important to recognize the limitations of the 1D Hec-ras model. In this approach, the flow is supposed to be channeled while the natural flow is 3D. Complementary research using 3D approach, are required to better characterize the flow in this river basin.
Acknowledgment
We would like to thank Mr. Mamadou Lamine GASSAMA (Hydrologist, Integrated Water Resources Management specialist) for providing the necessary information allowing characterizing the Kayanga-Anambe river system and required data our disposal within the framework of this study.
REFERENCES
Alemseged, T. H. and Rientjes, T. H. M. 2005. Uncertainty issues in hydrodynamic flood modeling. Enschede, the Netherlands pp1-6.
for calculating backwater curves in a low slope trapezoidal channel. Science Lib Editions Mersenne, Vol 3, No. 110304 ISSN 2111-4706
Amir, H. H. and Ehsan, Z. 2012. Evaluation of HEC-RAS Ability in Erosion and Sediment Transport Forecasting. World Applied Sciences Journal 17 (11): 1490-1497, 2012 ISSN 1818-495 © IDOSI publications.
Beltaos, S. and Tang, P. 2013. Applying HEC-RAS to simulate river ice jams: snags and practical hints CGU HS Committee on River Ice Processes and the Environment. 17th Workshop on River Ice Edmonton, Alberta, July 21 - 24, 2013 pp1-16
Bordbar, A., Mousavi, H., Masjedi, A. and Heidarnejad, M. 2013. Simulation of the Non-permanent Flow Advance Rate in the Rivers Using HEC-RAS and MIKE11 Models. International Journal of Agriculture and Crop Sciences. IJACS/2013/5-8/906-910. ISSN 2227-670X ©2013 IJACS Journal
Brych, K., Dittrt, F. and Elias, V. 2002. Development of flood boundary maps of urban areas using HEC-RAS software. Proceedings of the Fourth international FRIEND Conference held at Cape Town. South Africa. March 2002. IAHS Publ. no. 274. 237-242
Coly, A., Soumare, P.O., and Dacosta, H. 2002. Deficit, adequacy of the water offer and demand and dynamics of the basin of Anambe. Proceedings of the Fourth International FRIEND Conference held ill Cape Town. South Africa. March 2002). IAHS Publ. no. 274. 2002. pp.345-353.
Dacosta, H. 1989. Precipitation and runoff in the basin of Casamance. 3rd cycle thesis, Geography, Univ. Dakar, 274p.
Dacosta, H. and Gomez, R. 1998. Wetland Inventory basins Casamance and Kayanga. Report Wetlands National Network of Senegal (RNZHS). International Union for Conservation of Nature (IUCN).
Dacosta, H., Coly, A. and Soumare, P. O. 2002. Adequacy of the water offer and demand. Hydrological dynamics of Anambe (senegal). Integrated management of tropical floodplains; 396-410
Darshan, J. M., Manthan, R. and Maulik, J. 2014. Application of 1-D hec-ras model in design of channels. International Journal of Innovative Research in Advanced Engineering (IJIRAE) ISSN: 2349-2163.Volume 1 Issue 7, pp 103/107. Diouf, A. 1999. Contribution to the diagnosis and analysis of
the factors and constraints of irrigated rice development in Anambé basin: example of the rural community of Mampatim. TER Geography section. UFRL / SH, UGB, Saint-Louis (Senegal), 119p.
Dragan, V. K., Ivana, B. I. and Dejan M. C. and Gordana O. M. 2014. The initial analysis of the river Ibar temperature downstream of the lake gazivode. Thermal science, vol. 18, suppl. 1, pp. S73- s80
Goodell, C. and Warren, C. 2006. Flood Inundation Mapping using HEC-RAS. WEST Consultants, 2601 25th St SE, Suite 450, Salem, OR 97302. obras y proyectos, edicion n2, primavera, 18-23
Hasani, H. 2013. Determination of flood plain zoning in zarigol river using the hydraulic model of hec-ras. International Research Journal of Applied and Basic Sciences. www.irjabs.com ISSN 2251-838X / Vol, 5 (3): 399-403 Science Explorer Publications.
Henry, H. H. and Walton, R. 2008. Advanced Guidance on Use of Steady HEC-RAS. World Environmental and Water Resources Congress pp. 1-10. doi: 10.1061/40976(316)201 Hunter, N.M., Bates, P.D., Horritt, M.S. and Wilson, M.D.
2007. Simple Spatially-Distributed Models for Predicting Flood Inundation. A Review. Geomorphology, 90.3-4 : 208-225.
Jensen, M., Ian, T., and Johannes, D. 2004. Using hec-ras to model canal systems. Water Rights and Related Water Supply Issues. 607-616
Karim, S. 2009. Flood forecasting based on geographical information system. African Journal of Agricultural Research Vol. 4 (10), pp. 950-956
Karney, B.W., Malekpour A., and Salehi, H. 2010. An exploratory approach to teaching gradually varied flow. Journal of Hydro-environment Research 4 -175-180. Maghsoud, A., Alireza, P. and Majid, R. 2012. Study and
simulation of hydraulic and structural changes result of changing of section from soil to concrete. International Journal of Advanced Technology & Engineering Research (IJATER) ISSN No: 2250-3536 Volume 2, Issue 4, pp231-234
Mazhar H., and Muhammad A. M. 2010. Channelization of natural nullahs in himalayans for flood control using hec ras. 72nd Annual Session of Pakistan Engineering Congress. paper no. 748 .pp335-354.
Mohammed, T.A., Said, S., Bardaie, M.Z., and Basri, S. 2006. One-Dimensional Simulation of Flood Levels in a Tropical River System Using HEC-2 Model. Joint International Conference on Computing and Decision Making in Civil and Building Engineering, June 14 – 16: Montreal, Canada.
Nemati, K. M., Shahnazari, A., Fazoula, R., Aghajanee, M. G., and Perraton E. 2011. Effects of Caspian Sea water level fluctuations on existing drains. Caspian J. Env. Sci., Vol. 9 No.2 pp. 169~180
OMVG. 2008. Project integrated management of water resources in the watershed of the river Kayanga-geba. Assessment Report, African Water Facility, 1-16
Pappenberger F., Beven K.J., Horritt M., and Blazkova S. 2005. Uncertainty in the calibration of effective roughness parameters in HEC-RAS using inundation and downstream level observations”, Journal of Hydrology, 302(1-4): 46-69
Robert W.C.J., Karen F., and William J. 2012. Auto-Integrating Multiple HEC-RAS Flood-line Models into Catchment-wide SWMM Flood Forecasting Models. AWRA Hydrology & Watershed Management Technical Committee. Vol. 10, No. 1 pp1-15.
Sanjay A. B., Nayan S., Ahmad Z., and Ishwer D. G. 2014. Numerical Simulation-Optimization for Channelization of River Kosi. International Journal of Scientific Engineering and Technology (ISSN: 2277-1581) Volume No.3 Issue No.9, pp: 1149-1155 1
Santos, P.P., Tavares, A.O. and Andrade, A.I.A.S.S. 2012. Hydraulic modelling of the flood prone area in a basin with a historical report of urban inundation: the arunca river case (central portugal). Advances in Safety, Reliability and Risk Management – Bérenguer, Grall & Guedes Soares (eds) © 2012 Taylor & Francis Group, London, ISBN 978-0-415-68379. P2936-2944.
Seago, C. and Mckenzie, R. 2008. An overview of water resources systems modeling in South Africa”, International Assocition of Hydrological Sciences, IAHS Publ. 323;pp 57-66.
Soumare, P.O. 1999. Water and Environment in Anambe basin. Analysis of the impacts of water use and contribution to sustainable water resources management. Mem. Master Geography, Gaston Berger University, Saint-Louis (Senegal), 186 p
Sunil, K., Sayali, K., Vrushali, B., and Akshada, W. 2014. Flood modeling of river godavari using hec-ras. International Journal of Research in Engineering and Technology eISSN: 2319-1163 | pISSN: 2321-7308, Volume: 03 Special Issue: 09 NCETCE-2014
Tayefi, V., Lane, S.N., Hardy, R.J., and Yu, D. A. 2007. Comparison of one- and two-dimensional approaches to modeling flood inundation over complex upland floodplains. Hydrologic Processes 21(2007): 3190 – 3202. Traore, V. B., Sambou, S., Diatta, C., Fall, S., Tamba, S.,
Dieme, Y. (2013. Calculation of backwater curves in hydraulic axes of the Senegal River Delta: Case of Krankaye channel. 5th International Conference, Water Resources and Sustainable Development. February 24th & 25th, 2013/Algiers. 601-605
Xavier, L., Jean, B. P. and Vincent, G. 2010. Simplified nonlinear modeling of river flow routing. Advance Water ressources (33) 1015-1023