© 2017, IRJET | Impact Factor value: 5.181 | ISO 9001:2008 Certified Journal
| Page 686
MPSKM ALGORITHM TO CLUSTER UNEVEN DIMENSIONAL TIME SERIES
SUBSPACE DATA
S. Gokila
1, Dr. K. AanandaKumar
2, Dr. A. Bharathi
31
Research Scholar, Bharathiar University, India,
2
Asst. Professor (SG), Department of Computer Science and Engineering,
Bannari Amman Institute of Technology, India,
3
Professor, Department of Information Technology,
Bannari Amman Institute of Technology, India, [email protected]
---***---Abstract: The objective of the proposed algorithm is to select
the attribute’s rank index based on the involvements of the same in data set; identifying the global and local outline of entire data set. Because the attributes in data set, number of cluster and outline object are major intervention decide the accuracy of each clusters. The attribute ranking of proposed method automate the number of clusters and the center of the cluster. The uniqueness of the algorithm is exhibited in maintaining complete set of attributes without eliminating the low ranked attribute which are required for predictive analysis and in grouping the outline data set as clusters. The dynamited and improved version of MPSKM algorithm reduces the Sum of Square Error and number of iteration in
cluster formation. The work shows the significant reduction in
number of iteration in cluster formation and identifying the outline in data set based on rank index technique. The algorithm very well suited for the data set required periodical analysis and influences of attribute varies in each period of subset. The algorithm applied and tested on four years of Weather data set.
Keywords: Data Mining, Outline, Extreme, Automated Mean, Projected Space, Weather Season
1.
INTRODUCTION
Data mining process is dominated decision support process on the business application according to the available data and the prediction approach. Clustering is one of the major areas in data mining to group similar pattern under one label. The data are formed under specific group based on the similarity among those object. There are many methodologies proposed to find the similarity among the objects. This labeling is called as unsupervised mining. The key notes decides the accuracy of cluster are attributes involved, number of clusters decided and the similarity threshold fixed.
Outlines are the object that dissimilar from other data points among data set. It is an important task of finding such outliner in many application like, stock market, fraud detection and weather forecasting. In clustering outliners are considered as separate group of data to retain the sensitivity of other groups. The proposed method handles attribute selection, inclusion of all the attributes based on rank index, number of cluster and dissimilarity thresholds. The attributes are selected based on the projected space algorithms, number of clusters are decided based on the proximity of data in the state space.
1.1
Attribute Ranking
Clusters of same data set may differ in dimension. One cluster may have an object with similar data in some dimension. Other cluster may have object with similar data with other set of dimension. But there is need of comparing these differential clusters[15]. Some of the projected space clustering filter less important dimension from the chosen set of attributes[3, 17]. Treat that as less in cluster formation and eliminate those dimensions. The clustering done with the remaining data set. The dimension removed as may influence as predicator in classification in some domain like weather and stock market[1, 8].
© 2017, IRJET | Impact Factor value: 5.181 | ISO 9001:2008 Certified Journal
| Page 687
based attributes and rejects the low rank attributes and this works only for categorical data set alone[10]. The method proposed in this paper find the attributes by comparing pair of ratio among attributes and form a rank matrix, from which attributes are ranked. These variable selection allows to add the new variable and also decides the number of clusters.
1.2 Outline Detection
An outlier is an observation that deviates from other observations as to arouse suspicions that it was generated by a different mechanism and is also defined as a noisy observation that does not fit to the assumed model that generated the data[6, 17]. It is an important task of finding such outliner in many applications like, stock market, fraud detection and weather forecasting. There are many approaches in finding outline: Mahalanobis distance, depth-based approaches, deviation-depth-based approaches, distance-based approaches, density-distance-based approaches and clustering-based[12]. All these approaches are based nature on the user input. Outliers can be categorized as global and local outliers. Global outliers are completely isolated and grouped into separate cluster. Local outline create inconsistency with neighbor objects. The present work identifies the outline object and forms that as separate cluster which supports for high accuracy in other clusters.
1.3 Clustering
Cluster analysis is to explore the structure of data. Core Cluster analysis is a clustering. Clustering analysis in a data is an unknown label class (unsupervised)[5, 9]. So it is learned by observation not learned by example[11]. Clustering divide the data set into classes using the principle of “Maximum intra class similarity and Minimum inter class similarity”.
It doesn’t have any assumption about the category of data. The basic clustering techniques are Hierarchical, Partitioned, Density based, Grid based and Model based clustering[7]. Some sort of measure that can determine whether two objects are similar or dissimilar is required to add them into particular class. The distance measuring type varies for different attribute type. Clustering can also be used to detect outline in data which may occur due to human error or some abnormal events occurred while creating data set[9, 11]. Cluster work well on scalable, heterogeneous and high dimensional data set. In all the clustering algorithms user defined parameters are given as input to find either similarity, dissimilarity among clusters
and for root attribute of cluster and for maximum or minimum number of clusters.
2.
METHODS AND MODEL
The MPSKM model suggested here work well on domains examination result analysis, stock value analysis which are the fields required seasonal study or some periodical analysis. The Model derives 1 to N seasons of data. The MPSKM model starts with cluster formation of each slice of data based on the patterns exist, from which the extreme event fall on separated cluster. In traditional clustering algorithm the prefixed set of clusters include the extreme event of data which affect the statistical values (mean, centroid, etc.) of the cluster. The notation used in algorithm are described in [Table 1 ]
Clusters of same data set may differ in dimension. One cluster may have an object with similar data in some dimension. Other cluster may have object with similar data with other set of dimension. First phase of proposed model starts with find a attribute which close related to cluster for N slice(s) of data. Along the attribute finding the number of cluster K of N set also predicted.
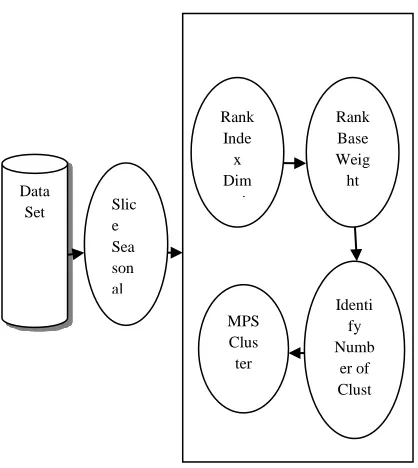
The algorithm finds the rank matrix for D(D-1)/n pair of domain based on sum of square error values. With the same it decides the optimum number of K cluster and initial center point M of K clusters. The dimension of data set are transformed based on the RM order of respective D. The algorithm steps are represented in [Fig : 1].
Table 1 : Algorithms notation
Notation Description
D No of Dimension (Attribute)
RM Rank Matrix
S Standard Deviation
H Euclidean Error of D
n Number of objects
N Number of slices of data
K Number of Clusters
Ckn Set of clusters of N Mk Midpoint of Ck
The proposed version finds the K using rank index based on the probability distribution of D={d1,d2....di}
© 2017, IRJET | Impact Factor value: 5.181 | ISO 9001:2008 Certified Journal
| Page 688
3. Number of cluster of Nth Slice K= Count(hj+1> hj + Sj)
4. Sort the RM based on the H
5. Rank D= {d1, d2, d3, … dj} X Max(RM) 6. Choose Mk the midpoints of K Clusters. 7. Use the objective function ∑ ∑
assign Xj into closest Ck 8. Refine Mk for all Ck cluster.
[image:3.612.50.259.216.450.2]9. Repeat 7 and 8 until no more changes in Mk.
Figure 1 : MPSKM work flow
The rank index formation makes the clustering effective by deciding the number of cluster, importance of each attribute in cluster and also outline identification. The rank matrix formed using f(D) in which the entire attribute are studied using proximity of values individually by the probability mapping Eqn (1).
p( hj+ di (xi,mid (Di))) Eqn (1)
The ordered probability decides the rank of attribute. The higher order probability attributes are the base to decide K and also the Ci. TheMin(RM) find the outline in lower end and also the labels the attribute which is the root cause of the event. All these preliminary works considerably reduces the cluster refinement. The objects allocation to the clusters are decided at the earliest. The proposed method is the latest version of MPSCM which induce the soft cluster formation with individual attribute threshold based on the K
equal to dimension in state space[14]. The number of clusters are limited using the Eqn (2).
hj+1 > hj + Sj Eqn (2)
3.
RESULT ANALYSIS
3.1. Data Set
The Performance of MPSKM evaluated by applying on weather date set. Four years (2010,2011,2012 and 2013) of weather date in 11.0o latitude and 76.9o longitude is taken for analysis. Indian weather are classified into four seasons each one belongs to separate sub space of data and in each slice of data importance of same set of attribute varies. In summer season Temperature attribute are considered along with the wind, at the same time the variation in rain indicates the extreme event. So the weather domain has been chosen to study the performance of MPSKM algorithm. This kind of study is required because the Indian weather seasons are classified into four and each of the seasons the importance of attribute varies[13,16]. The dimension of data set includes TemperatureMin, TemperatureMax, Rain, Humidity, Wind Speed, Radiation, and Evaporation (D=7). All the attributes are of numerical type. Number of objects in each data set are 1460(n).
3.2 Generating Rank Index
The attributes in the data set carry different level of importance when the same data set fragmented into various parts. This is applicable when the fragments are of unequal in size. So it is important to identify the level of involvement of attributes in each set separately. The same set of work is the projection on the dimensions. Some of the projection algorithms excludes the low level of attributes in the final stage of preprocessing. The low rated attributes many also contains the sensitive data and supports to identify the outline are extreme data set. The MPSKM identifies the ranking and it converges the attributes with consistent weight based on the level of importance. The algorithm runs the T-State K-Mean on D dimensional data set. It generates the D(D-1)/2 pair wise matrix to generate the rank matrix.
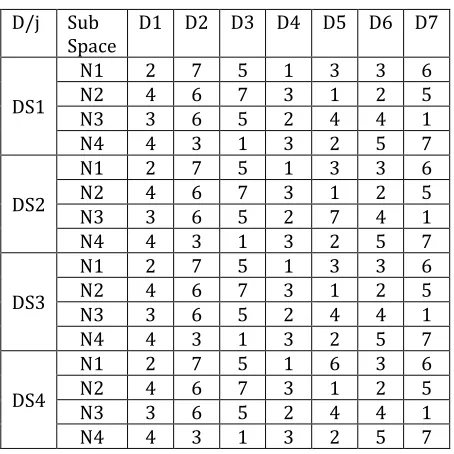
Result of which find the minimum sum of square error in heuristic fusion using the level Eqn 2.This limitation equation identify the number of clusters. The ratio of difference between the each pair of sum of square and the total sum of square of the data base sorts the entire domain propositional the error rate. The RM for experimental data set is in the Table 2.
Data
Set Slic
e Sea son al
Rank Base Weig ht
Identi fy Numb
er of Clust ers MPS
Clus ter Rank Inde
© 2017, IRJET | Impact Factor value: 5.181 | ISO 9001:2008 Certified Journal
| Page 689
Table 2: RM of four years data set.
D/j Sub
Space D1 D2 D3 D4 D5 D6 D7
DS1
N1 2 7 5 1 3 3 6
N2 4 6 7 3 1 2 5
N3 3 6 5 2 4 4 1
N4 4 3 1 3 2 5 7
DS2
N1 2 7 5 1 3 3 6
N2 4 6 7 3 1 2 5
N3 3 6 5 2 7 4 1
N4 4 3 1 3 2 5 7
DS3
N1 2 7 5 1 3 3 6
N2 4 6 7 3 1 2 5
N3 3 6 5 2 4 4 1
N4 4 3 1 3 2 5 7
DS4
N1 2 7 5 1 6 3 6
N2 4 6 7 3 1 2 5
N3 3 6 5 2 4 4 1
N4 4 3 1 3 2 5 7
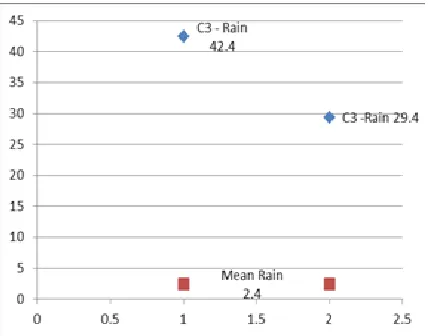
The RM states the different levels of involvement of same attribute in different sub space. The variation in the attribute occurs because of the extreme in particular sub space. In the attributes (D5,D6) occurs DS1(N1) ≈ DS4(N1) due to the extreme in DS4 that show in Fig 4. Weight application on the rank matrix done as W(RM) = Maxj (RMj)*∂. Scaling transformation are applied on the actual data set using is weighted matrix. Along with the RM the K value of each N1 to N4 also identified.
3.3 Cluster Validity
The model implemented in RStudio the open source data analysis tool. All the four sets of data are preprocessed and synthesized and formatted as CSV file after receiving it from different sources. Based on the nature of domain model receives input from the user to slice the data into N number of parts. Here the data taken for study is Indian weather data, as Indian weather is naturally of four seasons each data set are sliced into 4 groups and given as input to the model[13]. In the analysis each year of state space are referred as DS1, DS2, DS3, DS4. The sub space {N1, N2,N3,N4} ⊆ DS1 the state space. For each slice N1,N2,N3 and N4 model predicts the number of clusters and the importance of attributes based on the rank index matrix. It gives different ranks for the same attribute in each slice of data based on the nature of value, variation of value and outline event caused.
Each slice produces different set of cluster which is decided by the model based on the number pair of Euclidian error and mean value balance in each attribute. The data set taken for the study projected with 6 attributes, all are with different importance in each slice, for example the temperature in summer definitely high when compare to summer season, so the cluster of such data have to be taken place within the data of same season and the importance of such attribute are decided using rank matrix and the same allied as |w1,w2….wj|{d1,d2…dj} .
[image:4.612.53.280.120.347.2]Even with in the season the range of each attribute vary, that the distance calculation with centroid using traditional method may leady the cluster quality to low. So the distance measured among relevant attribute yield considerable quality improvement in cluster. The number of clusters of each slice in object predicted in rank index formation that reduces the clustering iteration and the same improves the sum of square error within each clusters. The outcome of MPSKM algorithm compared with previous version of algorithm that K-Mean algorithm. The compression results represented in [Table 3, 4, 5, 6].
Table 3 : MPSKM – K Mean in DS1
MPSKM K- Mean
Data
Set N Ck No Iteration of SEE No Iteration of SEE
DS1
N1 4 4 92.3 7 95.4
N2 5 4 92 6 93.5
N3 4 4 93.4 5 95.2
N4 6 5 91.8 6 92.7
Table 4 : MPSKM – K Mean in DS2
MPSKM K- Mean
Data
Set N Ck No Iteration of SEE No Iteration of SEE
DS2
N1 5 4 91.7 7 93.4
N2 6 4 92.1 6 93.6
N3 4 3 91.2 5 92.5
N4 5 4 90.2 6 91.7
[image:4.612.328.564.390.485.2]© 2017, IRJET | Impact Factor value: 5.181 | ISO 9001:2008 Certified Journal
| Page 690
Table 5 : MPSKM – K Mean in DS3
MPSKM K- Mean
Data
Set N Ck No Iteration of SEE No Iteration of SEE
DS3
N1 5 3 90.2 7 91.7
N2 5 4 91.1 6 92.2
N3 6 4 92.4 7 93.1
N4 4 4 90.5 5 91
The rank based attributes of the model the SSE of final formation of cluster doesn’t have more deviation from the SSE of cluster formed in initial clustering iteration and at the same SSE is less when compare to the SSE of K-Mean Mean algorithm.
Table 6 : MPSKM – K Mean in DS4
MPSKM K- Mean
Data
Set N Ck No Iteration of SEE No Iteration of SEE
DS4
N1 5 4 91.2 7 92.5
N2 4 4 91 5 91.4
N3 5 4 91.5 6 93.4
N4 6 5 91 6 92.1
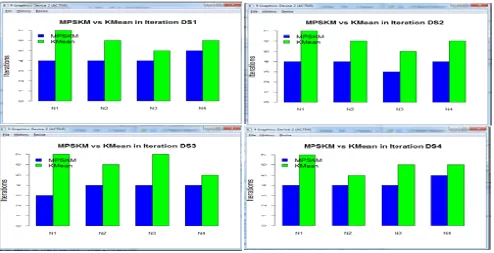
Due to the existance of outline the k-mean show the more iteration for cluster refinement the same has been reduced in MPSKM as it notifies the outline. The clusters formed in proposed model highlight the outline objects with respect to the attribute changes. Those clusters are shown in [Fig 3 and Fig 4]. Extreme occurrences of object in each slice of data are clustered separately. DS1 slice of 2013 data with extreme rainfall object and wind object are ensemble clearly. These two extremes are of different attributes that are clustered in C13 and C14 for Rain and Wind respectively. N4 slice of same year data consist two extreme objects for Rainfall. That are ensemble in single cluster C43.
Figure 2: Cluster Iteration Comparision of MPSKM and K-Mean
Compare to the traditional K Means algorithm, the MPSKM performs better in reduction of clustering iterations which is obviously proportional to run time of algorithm .
[image:5.612.64.558.370.623.2]© 2017, IRJET | Impact Factor value: 5.181 | ISO 9001:2008 Certified Journal
| Page 691
Figure 3: N1 – DS4 outline Pattern
The less computational complexity relate with the iteration of cluster in which the object reallocation considerably minimum compare to K-mean. Iteration and Sum of square error comparison are show in [Fig 2]. So the number of scan in state space considerably minimized.
Figure 4: N4 – DS4 outline Pattern
4.
CONCLUSION
The major challenge of unsupervised clustering are deciding new latent variable that is possible by ensemble of closed data, Deciding possible values in latent variable and outline data. The closeness of data point get deviated with the existence of outline data. In proposed method the event based actual outline are grouped under new label along with the relevant attribute. The MPSKM model solve handles unequal attribute and to identify the extreme
(low/ high) event and deciding the number of K value to group the date point with closest center. Proposed method finds the K value simultaneously with the rank matrix. The rank matrix transforms the original data point with the weight to increase the cluster accuracy. All of these reduce the number of iteration in finalizing the data point allocation and sum of square error among the clusters. The method achieves the soft clustering where the data point belongs to the exact label with reasonable attributes changes. The enhancement of the work direct to the pattern on weather data after identifying the outline and rank based on MPSKM algorithm. It supports to study the data set in different sub space along with various involvement of the attributes.
REFERENCES
[1] Amardeep Kaur, AmitavaDatta, 2015 , A novel algorithm for fast and scalable subspace clustering of high-dimensional data, Journal of Big Data, 2(17), pp. 1-24.
[2] Barbara D, Li Y, Couto J, 2002 ,COOLCAT: an entropy-based algorithm for categorical clustering, Proceedings of the 11th ACM international conference on information and knowledge management (CIKM’02), 1, pp. 582–589.
[3] Cesario E, Manco G, Ortale R, 2007 Top-down parameter-free clustering of high-dimensional categorical Data, Knowledge and Data Engineering, IEEE Transactions, 19(12), pp. 1607–1624.
[4] Guha S, Rastogi R, Shim K, 20000 ROCK: a robust clustering algorithm for categorical attributes, Inf Syst, 25(5) , pp. 345–366 .
[5] Hautamaki V. Cherednichenko, S., Karkkainen, I., Kinnunen, T. and Franti, P. , 2005, Improving K-Means by Outlier Removal, LNCS Springer, Berlin / Heidelberg, pp. 978–987.
[6] Jayakumar, G. S. and Thomas, B. J, 2013, A new procedure of clustering based on multivariate outlier detection, Journal of Data Science, 11(1) , pp. 69–84.
[image:6.612.63.278.388.556.2]© 2017, IRJET | Impact Factor value: 5.181 | ISO 9001:2008 Certified Journal
| Page 692
[8] KavitaThawkar,SnehalGolait,RushiLongadge, 2014, A Framework for an Outlier Pattern Detection in Weather Forecasting, IJCSMC, 3(5) , pp. 348 – 358.
[9] K . P. Soman , ShyamDiwakar, V. Ajay, 2014, Insight into Data Mining Theory and Practice, PHI Learning , Delhi.
[10]M. Bouguessa, 2015, Clustering categorical data in projected spaces, Data Mining and Knowledge Discovery, 29(1), pp. 3–38.
[11] Mohammed J Zaki, Wagner Meira JR, 2014, Data Mining and Analysis Fundamental Concepts and Algorithms, Cambridge University Press, New York, First Edition.
[12] Qingying Yu, Yonglong Luo, Chuanming Chen and Weixin Bian, 2016 Neighborhood relevant outlier detection approach based on information entropy, Intelligent Data Analysis, 20(1) , pp 1247–1265.
[13] S. D. Attri and Ajit Tyagi, 2010, Climate profile of india, Met Monograph No. Environment
Meteorology, (Environment Monitoring and
Research Centre, India Meteorological Department, Delhi.
[14] S. Gokila 15, K. Anandakumar, A.Bharathi, 2015 Modified Projected Space Clustering Model on Weather Data to Predict Climate of Next Season, Indian Journal of Science and Technology, 8(14). Pp 1- 5
[15] Sung -Soo Kim,2015, Variable Selection and Outlier Detection for Automated K-means Clustering, Communications for Statistical Applications and Methods, 22( 1), pp. 55–67.
[16] T V Rajinikanth, V V SSS Balaram and N.Rajasekhar, 2012 Analysis Of Indian Weather Data Sets Using Data Mining Techniques, DhinaharanNagamalai et al. (Eds): ACITY, WiMoN, CSIA, AIAA, DPPR, NECO, InWeS, 1 (1) , pp. 89–94 .