© 2017, IRJET | Impact Factor value: 5.181 | ISO 9001:2008 Certified Journal | Page 3378
Study of EOG signal generation, Analyses, and acquisition system
A. B. Kanwade
1, Rajat V. Gone
2, Snehal J. Ahire
3, Ashay R. Borkar
4Department of Electronics and telecommunication Engineering
Sinhgad Institute of technology and science, Narhe, pune-41
---***---Abstract - Electrooculogram (EOG) is a signal generated by
iris movement of the eye in positive and negative direction. Spikes are generated due to movement of the eye. This paper has designed EOG acquisition hardware and eye movement analysis software for real-time data. Noise affecting the EOG signal and its removal techniques are also studied. Left and right eye movements are detected as negative and positive spike respectively, with accuracy 76%, sensitivity 88%, and specificity 50%. Further analysis in Matlab can be done as future work to detect a different type of eye movement.Key Words: EOG, HPF, LPF, AMP, CRO
1. INTRODUCTION
Electrooculogram (EOG) is a diagnostic tool that measures, record; monitor the electrical activity of the eye motion in exquisite detail. An EOG is generated due to the iris (eyeball) of the eye which induces some voltage drop which can be detected using electrodes and then it is amplified thousand times then this signal can be analyzed DSO or CRO. EOG signal is generated by eye movement. In eye movement, the potential across eyeball that is in between Retina and cornea is present which a source of EOG signal is refer figure 1 for details of eye muscles. EOG signal is a real time bi-potential signal.
Fig -1: Type of Eye muscles [1]
EOG signal which has a baseline called as isoelectric line. EOG signal tracing of waveform consists of two types of spikes that are positive and negative spike which are generated due to eye movement. EOG signally is non-periodic it is based on eye movement and Fourier transform can also be used to represent EOG signal it is a mixture of two triangular and sinusoidal signal. Paralytic patients need another person help for moving around so to help them moving and enjoy the feeling of moving by them self is possible by EOG signal and different Human interaction devices can be made by
using EOG signal processing technique such as using eye movement as a mouse and to move this to communicate. Which feel that patients a feeling of independent to do their task. The signal obtained for eye movement is of very low strength & contaminated with noise. The instrumentation amplifier and the non-inverting amplifier are used to increase the power of the signal. The different types of noise present in the signal are:
DC Electrode offsets potential. 50Hz AC induced interface.
The electrode picks up muscular noise.
EOG signal is a simple voltmeter which consists of the different electrode connected across the eye which senses the electrical signal of small value[0.001 to 0.003 V] and of the frequency of [0.05Hz to 80Hz].
Fig -2: block diagram of EOG first phase amplifier [2]
[image:1.595.314.562.420.535.2]© 2017, IRJET | Impact Factor value: 5.181 | ISO 9001:2008 Certified Journal | Page 3379
2. METHODOLOGY
The block diagram of purpose system is shown below:
Fig -3: Block Diagram of EOG acquisition circuit.
To generate EOG signal following amplifiers and filters are used
2.1 Instrumentation amplifier 2.2 Non-inverting amplifier 2.3 Low pass filter
2.4 High pass filter 2.5 Notch filter
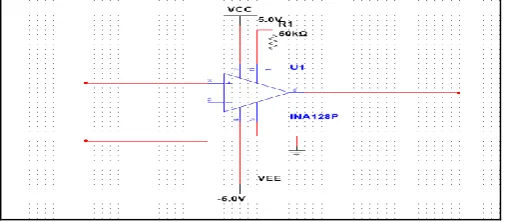
2.1 Instrumentation Amplifier
This is intended for low-level signal amplification where low noise, low thermal and time drifts, high input impedance an accurate close loop gain are required. Besides, high CMRR and high slew rate are desirable for superior performance. The two signals entering the differential amplifier are subtracted to cancel the common noise present in the signal. Because of instrumentation amplifier common noise gets cancel with the advantage of strengthening the signal. EOG signally is of the very low voltage of some millivolts. We have used instrumentation amplifier to strengthen this low power signal and obtain a required output.
Fig - 4: Instrumentation amplifier (INA 128P) of EOG acquisition circuit.
2.2
Non-Inverting Amplifier
The non-inverting amplifier is used to get the maximum gain and strengthen EOG signal. Using a non-inverting amplifier we get the same signal with same phase and
frequency at output side the only change is the amplitude of the signal which is more as compared to the original signal.
Fig -5: NON-Inverting amplifier (LM324N) of EOG acquisition circuit.
2.3
Low Pass Filter
A low pass filter is a filter that passes signals with a frequency lower than a certain cutoff frequency and attenuates signals with frequencies higher than the cutoff frequency
.
Fig -6: Low pass filter of EOG acquisition circuit.
2.4
High Pass Filter
[image:2.595.309.562.137.264.2] [image:2.595.41.279.148.245.2] [image:2.595.309.563.400.535.2] [image:2.595.36.289.554.665.2]© 2017, IRJET | Impact Factor value: 5.181 | ISO 9001:2008 Certified Journal | Page 3380
Fig -7: High pass filter of EOG acquisition circuit.
2.5
Notch Filter
A notch filter is used to remove a particular frequency, having a notch where signals are rejected. The EOG signal after passing through filter it has some noise called as power line interface noise, so to remove this noise we have to use a notch filter which can notch a 50Hz signal. It is composed of one low pass filter to blocks, and one high pass filter. Output of notch filter is pure EOG signal.
Fig -8: Notch filter (LM324N) of EOG acquisition circuit.
3. RESULT
According to the eye movement, EOG signal is generated and captured by the electrode and passed to filters and amplifiers. We have tested our circuit on multisim software and we have obtained excellent result as shown below.
First we tested the low pass filter, we got a cutoff frequency of 186 Hz, when the signal is less than 186Hz frequency that are passed and other than this signal are attenuated.
Fig -9: Low pass filter AC response
[image:3.595.301.560.57.219.2]The high pass filter is designed and tested got a cutoff frequency of 0.165Hz. In this we have signal less than 0.165 Hz are attenuated and remaining signal are allowed to pass.
Fig -10: high pass filter AC response
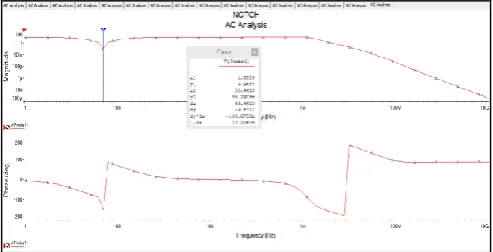
A notch filter is designed and tested for 50 Hz. In which the notch is seen at 50Hz where signal of 50Hz are not allowed to pass and another signal than 50Hz are passed to further circuit. In India the frequency used for power supply is 230v and 50Hz hence to remove the power supply noise we used notch filter for that frequency. Similarly in USA the frequency used for power supply is 240v and 60Hz.
Fig -11: Notch filter response
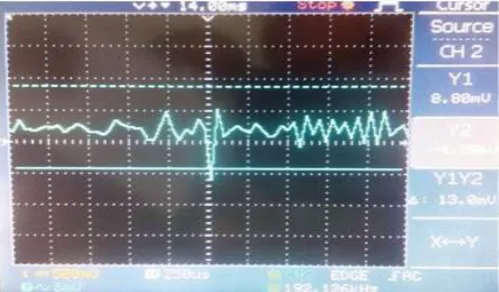
At output signal of EOG acquisition circuit captured on DSO is shown in below figure.
[image:3.595.35.288.100.212.2] [image:3.595.308.563.286.413.2] [image:3.595.39.287.371.489.2] [image:3.595.308.555.531.657.2]© 2017, IRJET | Impact Factor value: 5.181 | ISO 9001:2008 Certified Journal | Page 3381
Fig -12: Normal EOG waveform
To detect the spike of positive and negative signal threshold value is selected. In Figure 13 shows EOG signal for movement of eye ball to right direction. In this signal we can observe that signal amplitude is above the threshold value of signal.
Fig -13: EOG signal for Right side movement of Eye
In below Figure 13 shows that when we move eye to left direction the signal goes downward side, that is below the negative threshold value.
Fig -14: EOG signal for Left side movement of Eye
To calculate the various parameter of circuit we have tested the circuit by the below method. We have predicted the operation and we compared with actual output we got.
Right side and we predicted that right motor will work but there were condition where instead of right motor left motor start rotating. Where some time we saw that none of the motor was rotating.
We compare the result and find out TP (true positive), TN (true negative), FP (false positive), and FN (false negative) values in confusion matrix. Important parameters like accuracy, sensitivity and specificity are calculated.
[image:4.595.38.289.345.485.2]Out of 50 readings 30 times of motor has moved with direction of eye movement, 8 times motor has moved to right for left movement of eye. There was no movement of motors for no eye movement 8 times and 4 times there was movement for no movement in eyes.
Table -1: Confusion Matrix
N=50 Predicted=
NO
Predicted=
YES
Actual=NO TP=30 TN=08
Actual=YES FP=08 FN=04
Accuracy=TP+TN/TP+TN+FP+FN*100
=30+08/50
=76%
Sensitivity=TP/TP+FN*100
=30/30+4
=88%
Specificity=TN/FP+TN*100
=8/16
=50%
4. CONCLUSION
EOG is a secondary and most important part of human beings. EOG signal acquisition is done successfully using amplifier and filters. Eye movements are detected with an accuracy of 76%, and sensitivity of 88%, and specificity of 50%. Accuracy can be further increased by analyzing the EMG signals in softwares like Matlab or Scilab.
[image:4.595.38.288.562.708.2]© 2017, IRJET | Impact Factor value: 5.181 | ISO 9001:2008 Certified Journal | Page 3382 generation of EOG signal, significance is explained. Accuracy
is the number of all correct predictions divided by the total number of the dataset. Sensitivity is the number of correct positive predictions divided by the total number of positives, also known as recall or true positive rate. Specificity is the number of correct negative predictions divided by the total number of negatives. The advantages of EOG system are: in the detection and measurement of eye movement. Also EOG can be employed in modelling ophthalmic instruments which are capable of accompanying in disease diagnosis as well as for therapeutic purposes. The limitations of EOG system are: EOG signal amplitude is of microvolt range and highly susceptible to noise. Also EOG signals are very much sensitive and therefore fluctuate with head movements.
REFERENCES
[1]E.Gopinath “controlling a human computer interface (HCI) using EOG signal” International Journal Of Computing Communication And Information System, Vol. 6 , No.1,pp55-59, Jan- March 2014
[2]S.R.choudhury, S.venkataramanan, Harshal .B Name, J.S.Sahambhi “design and development of a novel EOG Biopotential Amplifier ” IJBEM, VOL 7, NO 1,pp.271-274, 2005
[3]Veena J Ukken, S.Vaishnodevi, S. Manthankumar “EOG based prostatic hand control ”international journal of innovative Research in Science, Vol. 4,Issue 5,pp.3693-3698, May 2015
[4]Hiroki Tamura, Masaki Miyashita, Koichi Tanno, Yasushi Fuse “ Mouse cursor control system using EOG signal ” World Automation Congress, 2010.
[5]Rushin Thakkar, Dr Rahul Kher “Implementation of EOG based human computer interface system” International Journal for Technology and Research in Engineering, Vol 2. Issue 11,pp.2503-2506, July 2015.
[6]Siriwadee Aungsakun, Angkoon Phinyomark, Pornchai Phukpattaranont and Chusak Limsakul “Development of robust electrooculography (EOG)-based human-computer interface controlled by eight-directional eye movements” International Journal of Physical Sciences Vol. 7(14), pp. 2196 - 2208, 30 March, 2012
[7]Saakshi Singh Dhankar, Dr. Manoj Soni “Development Of An Eog Based Human Machine Interface To Control A 3r Robot”IJARIIE-ISSN (O)-2395-4396, Vol-2, pp. 237-243, Issue-4 2016
[8]Vandhana, Prabhu. S “A Novel Efficient Human Computer Interface Using an Electrooculogram” IJRET, Volume: 03, pp. 799-803, Issue: 04 | Apr-2014
[9]Ms. Kanwade A. B., Prof. Dr. Patil S. P., Prof. Dr. Bormane D.S. “Wireless ECG Monitoring System” International Journal Of Information Technology And Knowledge Management, pp.27-30, 2010.
![Fig -1: Type of Eye muscles [1]](https://thumb-us.123doks.com/thumbv2/123dok_us/8168850.808133/1.595.314.562.420.535/fig-type-of-eye-muscles.webp)