© 2017, IRJET | Impact Factor value: 5.181 | ISO 9001:2008 Certified Journal | Page 185
CHANNELIZING TRAFFIC FLOW BY REDUCING DELAY AT
INTERSECTION
Ankit Khare
11
M.E Student,
Civil Engineering Department S.A.T.I Vidisha (M.P)
ABSTRACT:
During the last decade, the risk ofindustrialization has increased in large cities, As a result of urbanization of the country the urban population has to travel long distance Minimize intersections to manage travel demand within the minimum possible time. Resistance to traffic flow so that travel time can be reduced. Current requirement Metropolitan cities have to absorb the amount of traffic moving, but within the same physical Efforts at the crossroads throughout the day, worldwide efforts are being extended protecting the environment to save the Earth. An attempt has been made to study this letter. Various intersections, so as to reduce the intersections and consequent delays Improvement of level service Traffic signal can be synchronized so that a vehicle can start to travel at the end of the road and at the pre-determined speed, the other can go without Red light. The current traffic is estimated in each intersection and after that the design signal to improve service level on intersections and reduce delays, customized hints has been given Synchronize and estimate profits.
For review of safety on signal-controlled junctions and mid block crossing for the purpose of informing the National Highway Authority (NHAI) Signal design and all aspects of the strategy include a large number of studies on all aspects of Signal control reviewed, the most common theme running red light and countdown Timer.
Key Words: Traffic signal, industrialization, reduce delays, intersections.
1. INTRODUCTION
Traffic signals can define traffic as a power-driven signal display used to regulate. In Broader meaning, traffic signals include controls for crossroads, beaconing lanes, lanes Directional signs, and ramp metering signals when traffic signs are installed and Properly operated, they can provide specific benefits in traffic control and security. Signal installation, however, also has certain disadvantages which may or may not be applicable to The objectives of a particular location traffic sign are many, as they do less Frequency of some types of accidents, increase in the ability to handle traffic The intersections, where the intersections bring a lot of economy on manual controls but Alternative work of the right of the road is necessary and in the end, to encourage the driver's
confidence By specifying correctly, on the other hand, signal installation increases on intersections Crossing total delays and fuel consumption and especially during the performance index Off peak time. The purpose of the current thesis is to define the rate of proper traffic flow for the optimum Signal time design At crossroads where there is a large number of crossings and right turn traffic. There may not be systematic movements in the form of the possibility of many accidents. First practice To prevent traffic through traffic police, alternate hints have been shown to prevent Cross on the roads, so that once the traffic stream of traffic flow separates, Isolation. Traffic Signal Control Tools, which can alternatively direct traffic to Stop and use red and green traffic light signals automatically.
2. OBJECT
The aim is to design signal so that the traffic should be generalized and reduce the delay by coordination of the designed signals
Specific objective are
Criteria for installing or removal of traffic. Signals design with webster method. Traffic signal phase timing and safety. . Reduce delays on traffic signals. Make the traffic flow smooth.
3. PURPOSE OF TRAFFIC SIGNALS
Traffic signals are utilized to assign vehicular and pedestrian right of way they are utilized to advance the deliberate development of vehicular and pedestrian traffic and to anticipate excessive delay to trafficsignals ought not to be introduced unless one of the warrant determined by the manual on uniform traffic control devices (MUTCD) has been fulfilled the fulfillment of a warrant is not in itself legitimization for a signal A traffic design investigation must be lead to decide if the traffic signal ought to be introduced the establishment of traffic signals requires sound designing judgment, and must adjust the following, sometimes clashing, and goals:
Moving traffic in a efficient manner;
© 2017, IRJET | Impact Factor value: 5.181 | ISO 9001:2008 Certified Journal | Page 186
Reducing Crash-Creating Clashes; And
Maximizing limit with regards to every crossing point.
4. DEFINITIONS AND NOTATIONS
Various definitions and documentations should be comprehended in signal outline they are discussed below.
Cycle:
cycle is a complete rotation of all the indications provided.
Cycle length:
cycle length is the time in secondthat it takes a signal to finish one full cycle of indication. It indicates the time between the starting of Green Signal for one approach till the next time the green signal starts. It is signified by C.
Interval:
thus it demonstrates that changestarting with one phase then on to the next. There are two shot of intervals- change interval and clearance interval. Change interval is additionally called the yellow time demonstrates the interval between the green and red signal signs for an approach. clearance interval is additionally called on Red is incorporated after each yellow interval demonstrating a period among which every single phase indicate red and is utilized for tidying up the vehicles in the convergence.
Green interval:
It is the green sign for a specific development or set of development and is meant by GI. This is the real term the green light of a traffic signal is turned on.
Red interval:
It is the red sign for a specific development or set of development furthermore, is signified by RI. This is the genuine span the red light of a traffic signal is turned on.
Phase:
A stage is the green interval in addition to the change and clearance interval that take after it. Along these lines, among green interval, non clashing developments are relegated into each stage. it enables an arrangements of development to stream and securely end the stream before the period of another set of development begin.
Lost time:
It shows the time among which the crossing point is not effectively used for any development. When the signal for an approach turn from red to Green, the driver of vehicle
which is in the front of the line will set aside some opportunity to see the signal (typically called as
Response time) and some time will be lost here before he moves.5.
SIGNAL DESIGN PROCEDURE
The signal design procedure involved six major steps. They include the:
(a) Phase plan,
(b) Demonstration of golden time and clearance time, (c) Demonstration of cycle length,
(d) Apportioning of green time, (e) Pedestrian crossing necessities, and
(f) The execution assessment of the above plan.
The goal of phase design is to isolate the clashing development in a crossing point into different phases, with the goal that developments in a phase ought to have no conflicts. On the off-chance that every one of the developments is to be isolated without any conflicts, at that point an expensive number of phases are required. In such a circumstances the goal is to design phase with least conflicts or with less serious conflicts. There is no exact philosophy for the design of the phase. This is the regularly guided by the geometry of the crossing point. Stream designs particularly the turning developments the relative extents of a stream. Along these lines, an experimentation strategy is regularly embraced. Be that as it may, phase design is critical since it influences the further design steps. Further, it is less demanding to change the process during the green time when streaming design changes, where as an exceptional change in the stream example may cause significant disarray to the drivers. To show different phase design choices, consider a four leg crossing point with through traffic and right turns. The left turn is overlooked. The main issue is to choose what number of phases is required. It is conceivable to have two, three, four or many numbers of phases.
5.1 Two Phase Signals
© 2017, IRJET | Impact Factor value: 5.181 | ISO 9001:2008 Certified Journal | Page 187
Phase1 Phase2
5.2 Three Phase Signals
Three phase signals are adopted for a three legged intersection, where there are two conflicting movements which are right turns for both the roads and two non conflicting movements which are through movements. The phase plan for this kind of signals is shown in the following figure. From fig. , phase 1 (p1) is provided by only allowing the non conflicting traffic 1, phase 2 (p2) and phase 3 (p3) are provided by allowing the conflicting traffic 3 and 4 respectively.
5.3 Four Phase Signals
There are at least three possible phasing options.. Where, flow from each approach is put into a single phase avoiding all conflicts. This type of phase plan is ideally suited in urban areas where the turning movements are comparable with through movements and when through traffic and turning traffic need to share same lane. This phase plan could be very inefficient when turning movements are relatively low.. The non-conflicting right turn flows 7 and 8 are grouped into a third phase. Similarly flows 5 and 6 are grouped into fourth phase. This type of phasing is very efficient when the intersection geometry permits to have at least one lane for each movement, and the through traffic volume is significantly high. This is rarely used in
practice. There are five phase signals, six phase signals etc. They are normally provided if the intersection control is adaptive, that is, the signal phases and timing adapt to the real time traffic conditions.
6.
METHODOLOGY
The principle of the following four method of signal design is briefly given under this chapter. The first two methods are approximate design procedure. Webster method of signal design is a rational approach with the objective to minimize the overall delay of all vehicles entering the intersection. in addition the senior design method as per the guidelines of the IRC is also given. For the purpose of simplicity to phase traffic signals with no turning moment as illustrated hair the methods may be suitably extended for multiphase operations on also.
1. Trial cycle method 2. Approximate method 3. IRC method
4. Webster method
6.1 IRC Method
A. The pedestrian green time required for the major and minor roads are calculated based on walking speed of 1.2 m/sec. and initial walking time of 7.0 secs. These are the minimum green time required for the vehicular traffic on the minor and major roads respectively.
B. The green time required for the vehicular traffic on the major road is increased in the proportion to the traffic on the two approach roads.
C. The cycle time is calculated after allowing amber time of 2.0 sacs each.
© 2017, IRJET | Impact Factor value: 5.181 | ISO 9001:2008 Certified Journal | Page 188
required for the vehicular traffic on any of the approachesis limited to 16 sacs.
E. The optimum signal cycle time is calculated using Webster’s formula. The lost time is computed from the amber time; wintergreen time and the initial delay of 3.0 sacs. For the first vehicle, on each leg.
6.2 Webster Method
The signal design procedure involves six major steps. They include the
(1) Phase design.
(2) Determination of amber time and clearance time. (3) Determination of cycle length.
(4) Apportioning of green time
7.
CYCLE
TIME
Cycle time is the time taken by a signal to complete one full cycle of iterations, i.e. one complete rotation through all signal indications. It is denoted by C. In Webster Method corresponding to least total delay to the vehicles at signalized intersection has been worked out. This is rational approach. The field work consists of finding (i) Saturation flow S per unit time on each approach of the intersection and (ii) the normal flow „q‟ on each approach during the design approach. The standard values for saturation flow, S according to Webster are given as in the below table.
Table- Saturation flow for widths 3 to 5.5 meters y1= q1 and y2= q2
s1 s2
CO=1.5L+5
1-Y
Where L = total lost time per cycle, seconds
L = 2n+R
n = number of phases, R = all red time Y = y1+y2 𝐺1= y1(Co-L)
Y G2= y1(Co-L)
Y
Similarly the procedure is followed when there are more number of signal phases.
8. TRAFFIC COUNT METHOD
There are mainly two methods are used for conducting traffic volume count
1.Manual 2.Automatic
Manual count is generally used to gather the information about the type of vehicle, turning movement, direction of travel, and number of vehicles
Automatic count is used to gather information about vehicle hourly movement, daily and seasonal variations growth trends and annual traffic estimates.
8.1 Data Collection
[image:4.595.37.286.478.572.2]We have collected data using manual count method for the week days in Month of July at Jyoti Cineplex square Bhopal and vyapam square Bhopal counted the traffic volume approaching from the four approaches and their respective movement in different directions. The traffic movement of different class of vehicle is noted down in the table prepared for it.
Twelve observers were stand on the four approaches of two Roads and counted manually the approaching vehicles from each direction and noted the number of different class of vehicles passing the intersection in the pre prepared table.
The traffic data collected is later converted into a common factor called Passenger Car Unit (PCU).
The maximum values of PCU from seven days traffic
volume is considered for the calculation of total
traffic
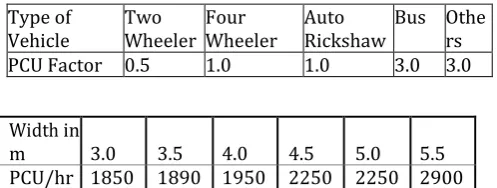
and the capacity of rotary. These PCU values then plotted on a graph between the time interval and PCU’s value and the peak period is known by the maximum ordinate of PCU valuesTable- Tentative PCU factors Suggested By IRC-SP 41 Type of
Vehicle Two Wheeler Four Wheeler Auto Rickshaw Bus Others PCU Factor 0.5 1.0 1.0 3.0 3.0
Width in
m 3.0 3.5 4.0 4.5 5.0 5.5 PCU/hr 1850 1890 1950 2250 2250 2900
Width W cm 3 3.5 4 4.5 5 5.5 Saturation flow
© 2017, IRJET | Impact Factor value: 5.181 | ISO 9001:2008 Certified Journal | Page 189
9. DESIGN OF TRAFFIC SIGNAL
Design of Board Office Traffic Signal by Webster
Method
Road A- from DB Mall Road B- from Jyoti Square Peek hour PCU for road A = 875.5 Peek hour PCU for road B =1026 Width of road A = 14 M
Width of road B = 14 M
5.2 Design of two phase control signal Pedestrian crossing speed = 1.2 m/s
Pedestrian crossing time for road A =
= 12 sec
Pedestrian crossing time for road B =
= 12 sec
From IRC:93-1985:
The total lost time per cycle is equal to total amber time per cycle i.e. 1.5 sec. amber time for first vehicle in phase 1 plus 3 sec. reaction time for first vehicle in phase 2 equal to total 4 sec.
Saturation flow = 525 X W PCU per hour Where,
W = width of the approach measured from kerb to the inside of the central median or mentioned centre line of the approach.
The width from 5.5 to 18m for lesser width the values may be obtained from the table given below.
Table -Saturation flow of traffic
Width of road = 7 m
Saturation flow = 525 x per meter width Saturation flow =525 x 7 =3675
Y = y1 + y2
y1 = 875.5/3675 = 0.238
y2 =1026/3675= 0.279
Y = 0.238+ 0.279 Y = 0.517
Here is a Webster’s formula. Where,
C
o– optimum cycle length in seconds
L
-
Total lost time per cycle.
Y – volume/saturation flow for critical approach in
each phase.
Optimum cycle time length
C
o=1.5x16+5 = 60
1-.517
L= 2n +R = (2x 2)+12 = 16 sec
Optimum cycle length =60 sec
Green time for road A,
G
1 =y
1( C
o–L )
Y
G
1= 0.238 (60-16)
0.517
G1= 20.20sec =21sec
Green time for road B, G2 = y2 ( Co –L )
Y
G2 = 0.279 (60-16)
0.517 G2 =23.70sec =24sec
All red time is 12 sec and amber time is 3 sec Hence total time is 21 +24 +12+3+3= 63 sec
ROAD A
ROAD B
ROAD GREEN AMBER RED CYCLE(sec.) Road A
Road B 21 36 3 3 39 24 63 63
24
SEC
SEC
3
39 SEC
21
© 2017, IRJET | Impact Factor value: 5.181 | ISO 9001:2008 Certified Journal | Page 190
10. CONCLUSIONS
1. In this thesis, Economic Design Traffic Volume Processes Signal design is examined in the conditions of saturated flow Specific intervals are selected to establish the regional work and as a result Analysis. A Traffic Count survey was done for 15 hours continuously in normal operating conditions
2. Traffic fluctuation was achieved and peak volume and average. The quantity of the peak was determined
3. By designing the signal the flow become channelized and the delay is Also be reduced.
4. The signal will get efficient timing so that it will provide a smooth flow of vehicle and the conjunction will be reduced.
5. If the traffic flow will channelized there will be a chance of over speeding.
6. This study use to reduce delay at intersections
.
11. REFERENCES
Highway Engineering- S. K. Khanna & C. E. G Justo, Nemchand & Bros., 7th Edition.
Traffic Engineering & Transportation Planning-
L.K Kadiyali- Khanna Publications.
IRC Code: IRC: 93-1985.
Ministry Of Road Transport and Highways (MORTH).