© 2017, IRJET | Impact Factor value: 6.171 | ISO 9001:2008 Certified Journal
| Page 1500
HIGH DIMENSIONALITY STRUCTURES SELECTION FOR EFFICIENT
ECONOMIC BIGDATA USING K-MEANS ALGORITHM
*1
Mrs. Saraswathi .S,
*
2Mrs. Anette Regina I.,
*1
M.Phil Research Scholar, Department of computer Science Muthurangam Government Arts College
(Autonomous), Vellore, Tamil Nadu, India.
*2
Associate Professor, Department of Computer Science Muthurangam Government Arts College (Autonomous),
Vellore, Tamilnadu, India.
---***---Abstract:
Huge amount of data gets collected every dayand there is also a need of technology to handle enormous amount of economic data. Hence there are various and huge number of opportunities for economic analysis. Low quality, high-dimensionality and great volume pose great challenges on efficient analysis of economic big data. To overcome these challenges here presents a new structure for efficient analysis of high-dimensional economic big data based on innovative distributed feature selection to STC and K-means Clustering Algorithm. The unprecedented data volumes require an effective data analysis and prediction platform to achieve fast response and real-time classification for Big Data. The presented framework combines the methods of economic feature selection and econometric model construction to discover the hidden patterns for economic development. Economic Big Data Analysis When embracing large varieties of economic factors, these methods tend to yield unsatisfactory performance. To address the challenges, the functionality rests on three pillars: (i) novel data pre-processing techniques to prepare high-quality economic dataset used for evaluation process. (ii) An innovative distributed feature
identification solution to locate important and
representative economic indicators from multidimensional data sets, and (iii) New econometric models to capture the hidden patterns for K-means economic development. The experimental results on the economic data collected in Newsgroups, Reuters and Keep Media proposed framework and methods have superior performance in analyzing enormous economic data.
Keywords: Novel Data Analysis, Distributed economic Data, HDFS, SAP High Quality, Big data
I. INTRODUCTION
The compute resources (e.g., CPU cores) are abstracted into map and reduce slots, which are basic compute units and statically configured by administrator in advance. A MapReduce job execution has two unique features: 1) the slot allocation constraint assumption that map slots can only be allocated to map tasks and reduce slots can only be allocated to reduce tasks, and 2) the
general execution constraint that map tasks are executed before reduce tasks. Due to these features, we have two observations: (I). there are significantly different performance and system utilization for a MapReduce workload under different slot configurations, and (II). even under the optimal map/reduce slot configuration, there can be many idle reduce (or map) slots while map (or reduce) slots are not enough during the computation, which adversely affects the system utilization and performance. Speculative execution is an important technique that can overcome the problem of slow-running task’s influence on a single job’s execution time by running a backup task on another machine. However, it comes at the cost of cluster efficiency for the whole jobs due to its resource competition with other running tasks. We propose a dynamic scheduling and slot allocation policy for speculative task. It balances the tradeoff between a single job’s execution time and a batch of jobs’ execution time by determining dynamically when it is time to schedule and allocate slots for speculative tasks.
We propose a scheduler named Pre Scheduler that can improve the data locality while not hurt the fairness. It considers the case of a node where there are currently local map tasks of jobs and idle slots available, but no allowable idle map slots (e.g., due to the load balancing constrain) to be allocated. It pre-allocates idle slots of the node to jobs to maximize the data locality and guarantee fairness. Since Delay scheduling and Pre-scheduling works in different scenarios, our DLMS incorporates both approaches, making them work cooperatively to maximize the data locality.
1.1 Big data
© 2017, IRJET | Impact Factor value: 6.171 | ISO 9001:2008 Certified Journal
| Page 1501
amounts of data might well be classified as a big dataproblem.
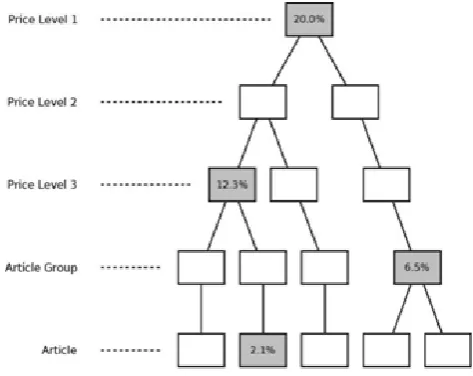
In PCT, the big data challenge arises from the huge amounts of data needed in order to run simulations for large customers. In some cases more than fifty thousand historical order rows may have to be handled, with multiple possible conditions and discount rates applied to every single one of them[2]. While the data set itself is not extremely large by today's standards, the complex operations and calculations which have to be performed on each one of them adds new dimensions to the simulation procedure. Discounts are for example inherited through a large tree structure containing tens of thousands of nodes and the results must be presented to the user within a reasonable amount of time[4][5].
1.2 Goals and limitations
Initially optimize the existing discount simulation algorithm in order to reduce its running time. The discount simulation's purpose is to apply given discounts to articles and article categories, in order to evaluate whether they will generate an acceptable profit for the selected customer.
Second to create a model with associated algorithms for a scaling extension of the system's simulation functionality. The purpose of this extension is to make it possible to apply different discount rates depending on the volume of individual orders. This will encourage customers to place a few large orders every year instead of several small ones, thus decreasing shipping and warehouse charges for the company without reducing the sales volumes[6].
II. EFFECTIVE WORK
2.1 Budget-Driven Scheduling Algorithms for Batches of Map Reduce Jobs in heterogeneous Clouds
They propose their task- level scheduling algorithms for Map Reduce workflows with the goals of optimizing budget and dead line constraints. They first consider the optimization problem under budget constraint where an in-stage local greedy algorithm is designed and combined with dynamic programming techniques to obtain an optimal global solution. To overcome the inherent complexity of the optimal solution, they also present two efficient greedy algorithms, called Global Greedy-Budget algorithm (GGB) and Gradual- Refinement algorithm (GR).they studied two practical constraints on budget and dead line of or the scheduling of a batch of Map Reduce jobs as a workflow on a se t of (virtual) machines in the Cloud .First, they focused on the scheduling-length optimization under budget constraints. They designed a global optimal algorithm by
combining dynamic programming techniques with a local greedy algorithm for budget distribution on per stage basis, which was also shown to be optimal[10].
2.2 Reining in the Outliers in Map-Reduce Clusters using Mantri (2010)
Mantri identifies points at which tasks are unable to make progress at the normal rate and implements targeted solutions. If a task straggles due to contention for resources on the machine, restarting or duplicating it elsewhere can speed it up[3]. If a task straggles due to contention for resources on the machine, restarting or duplicating it elsewhere can speed it up.
2.3 Resource-aware Adaptive Scheduling for (2011)
This technique leverages job profiling information to dynamcically adjust the number of slots on each machine, as well as workload placement across them, to maximize the resource utilization of the cluster.The main challenge in enabling resource management in hadoop clusters stems from the resource model adopted in MapReduce.We present a resource-aware scheduling technique for MapReduce multi-job workloads that aims at improving resource utilization across machines while observing completion time goals. Existing MapReduce schedulers define a static number of slots to represent the capacity of a cluster, creating a fixed number of execution slots per machine. This abstraction works for homogeneous workloads, but fails to capture the different resource
requirements of individual jobs in multi-user
environments. Our technique leverages job profiling information to dynamically adjust the number of slots on each machine, as well as workload placement across them, to maximize the resource utilization of the cluster. In addition, our technique is guided by user-provided completion time goals for each job. Source code of our prototype is available.
2.4 Coupling task progress for Map Reduce resource aware scheduling (2013)
© 2017, IRJET | Impact Factor value: 6.171 | ISO 9001:2008 Certified Journal
| Page 1502
MapReduce with an open source implementation namedHadoop is proposed. In practical Hadoop systems one kind of issue that vitally impacts the overall performance is known as the NP-complete minimum make span1problem. One main solution is to assign tasks on data local nodes to avoid link occupation since network bandwidth is ascarce resource[10][12]. Many methodologies for enhancing data locality are proposed such as the HDS and state-of-the-art scheduler BAR.
2.5 Two Sides of a Coin: Optimizing the Schedule of MapReduce Jobs to Minimize Their Make span and Improve Cluster. (2012)
To automate the design of a job schedule that minimizes the completion time (make span) of such a set of MapReduce jobs. Scheduling of incoming jobs and the assignment of processors to the scheduled jobs has been an important factor for optimizing the performance of parallel and distributed systems. Large-scale MapReduce clusters that routinely process Peta Bytes of unstructured and semi-structured data represent a new entity in the changing landscape of clouds. A key challenge is to increase the utilization of these MapReduce clusters. In this work, we consider a subset of the production workload that consists of MapReduce jobs with no dependencies. We observe that the order in which these jobs are executed can have a significant impact on their overall completion time and the cluster resource utilization. Our goal is to automate the design of a job schedule that minimizes the completion time (make span) of such a set of MapReduce jobs. We offer a novel abstraction framework and a heuristic, called Balanced Pools that efficiently utilizes performance properties of MapReduce jobs in a given workload for constructing an optimized job schedule.
III.
PREVIOUS IMPLEMENTATIONS
The focus of model construction in this case study is to reveal the contribution of decisive factors to economic growth and the hidden relationship between urbanization and economic growth from enormous economic data. So 52 economic indicators of more than 300 towns and streets over the past 30 years are collected in Indian. For meaningful information is often buried in the mass, we extract the indicators that actually make sense to establish correlative models. After eliminating redundancy and abnormity, 32 factors are selected for important attributes analysis. Fig. 4 shows the importance of these attributes, which are obtained by the algorithms
The indicators ”Built-up Area” and ”Science and Technology Input” own the highest and lowest importance respectively. The ”Built-up Area” reflects the functions of urbanization for economic growth in Indian. Over the past
decade, urbanization has been steadily advanced with a large percentage of land converted to built-up area in Indian. It promotes the economic growth through increasing consumption and investment, as well as affecting the related decisive factors. The”Science and Technology Input” has had less impact than other factors on the economic growth in the past few years in Indian, which means that the capacity for innovation is not enough. It is in line with the actual situation. So the investment in science and technology should be increased to promote the innovation of economic growth[16].
Fig2: Calculation Attribute
Economic attributes have different contributions to economic development, which can provide some references for economists in construction of economic models, and thus to reduce the task of manual analysis. In this section, the important attributes whose attribute weights are not less than σ = 6 are selected for analysis.
3.1 Discount inheritance
Discounts can be applied to nodes on any level of the article tree - from price level 1 down to specific articles. It is intuitive that a discount which is set for a single article will only affect the price of that specific article. When it comes to discounts set on article groups or price level nodes, the system uses a concept called "discount inheritance" to let this affect underlying nodes. In order to determine which discount rate to apply to a given node, the method presented in algorithm 2.1.1 is used.
Algorithm 3.1.1: find Discount Rate (Node n) Input: A node n from the article tree
Result: The discount rate which should be applied to n
1 if n is a node in the path for which a discount rate d is set
then
2 | return d
3 else if n is not a node in the path AND n has an active
© 2017, IRJET | Impact Factor value: 6.171 | ISO 9001:2008 Certified Journal
| Page 1503
4 | return the discount rate from condition c
5 else if n is a price level 1 node then
6 | return 0.0% 7 else
8 parent := n's parent node in the article tree
9 return find Discount Rate(parent)
10 end
The concept of discount inheritance is easy to visualize due to the tree structure of the article database.
An example tree with some existing discount rates is
shown in figure 2.3. Existing discount rates are written
directly onto the grey nodes to which they belong, while nodes without such rates are white. The final result of the discount rate inheritance in the same tree can be seen in figure 2.4, where arrows show how discount rates are passed down through the tree.
Recently, performance and monetary cost optimizations for workflows from various applications in the cloud have become a hot research topic. However, we find that most existing studies adopt ad hoc optimization strategies, which fail to capture the key optimization opportunities for different workloads and cloud offerings (e.g., virtual machines with different prices). This paper
proposes ToF, a general transformation-based
[image:4.595.311.556.104.282.2]optimization framework for workflows in the cloud. Specifically, ToF formulates six basic workflow transformation operations. An arbitrary performance and cost optimization process can be represented as a transformation plan (i.e., a sequence of basic transformation operations). All transformations form a huge optimization space.
Fig 3:An example article tree where discount rates have been set for four nodes
Fig 4: Discount inheritance in the example article tree
IV. PROPOSED ANALYSIS
4.1 Preprocessing Technique-IMPUTATION
Imputation is the process of replacing missing data with substituted values. Single imputation-A once-common method of imputation was hot-deck imputation where a missing value was imputed from a randomly selected similar record. In cases with imputation, there is guaranteed to be no relationship between the imputed variable and any other measured variables. Thus, mean imputation has some attractive properties for univariate analysis but becomes problematic for multivariate analysis.
4.2 Slot allocation and Slot pre-scheduling process
In this module we are going to perform two processes. Slot allocation Slot pre-scheduling process. In this slot allocation process we are going allocate the slot based on dynamic Hadoop slot allocation optimization mechanism. In the slot pre-scheduling process we are going to improve the data locality. Slot Pre-Scheduling technique that can improve the data locality while having no negative
impact on the fairness of Map-Reduce jobs. Someidle slots
which cannot be allocated due to the load balancing constrain during runtime, we can pre-allocate those slots of the node to jobs to maximize the data locality.
4.3 HDFS Upload
Hadoop Distributed File System (DFS) will be configured
for uploading the preprocessed geo data intoHadoop. The
[image:4.595.44.281.528.716.2]© 2017, IRJET | Impact Factor value: 6.171 | ISO 9001:2008 Certified Journal
| Page 1504
from hadoop. Different datacenters are analysed for dataexecution across different datacenters.
4.4 Speculative Execution Performance Balancing
When a node has an idle map slot, we should choose pending map tasks first before looking for speculative map tasks for a batch of jobs. Hadoop Slot is executed for determining path for performing the MapReduce job. After this the Speculative based process starts to execute the determined optimized Multi-execution path. Executing individual MapReduce jobs in each datacenter on corresponding inputs and then aggregating results is defined as MULTI execution path. This path used to execute the jobs effectively.
4.5 Performance Evaluation
Speculative execution is a common approach for dealing with the straggler problem by simply backing up those slow running tasks on alternative machines. Multiple speculative execution strategies have been proposed, but there is a pitfall: incoming jobs are allocated to nodes present in server and fail to schedule process type allocate to node for processing. Performance is evaluated by means of selective the optimized resources and results taken in
terms of execution time, processing memory etc.
…
As seen in this figure, leaf nodes contain articles while branch nodes represent article categories. The most general categories are stored in price level 1 (Clothes and Shoes), subcategories of these in price level 2 (Pants and Shirts are both subcategories of Clothes) and so on. In the current article database, each price level 3 node contains exactly one article group meaning that these two levels are equally specific. While the tree in the figure is just an example (using made up names of clothes and accessories instead of the more Cryptical category codes from the real system), it should be enough to explain the concept of the article tree structure used in PCT. The amount of nodes for each level in the reduced tree provided for this project is shown in table 2.1. The corresponding numbers for the actual system's tree are even larger. Since internal company policies do not allow sharing of the full article tree, this reduced tree has been used throughout the whole project.
Node level #Nodes
Price level 1 8
Price level 2 64
Price level 3 802
Article group 802
Table1: The amount of nodes for each level of the article tree provided for this project
4.5.1 Structure of the simulation process in PCT
Algorithm
1 if this is the first run of the simulation process then
2 | initialize connection to each input data element in the GUI [0(k)]
3 end
4 foreach price level in the article tree [0(k)] do
5 match condition level [0(k)]
6 match price level [0(k)]
7 foreach item in the customer's cache [0(n)] do
8 | match criteria [0(k)]
9 end
10 retrieve target discount [0(k)]
11 foreach article in the article tree [0(a)] do
12 foreach article in the customer's cache [0(n)] do
13 match criteria [0(k)]
14 foreach price level in the article tree [0(k)]
do
15 | retrieve data and calculate results
16 end
17 end
18 retrieve agreed discounts [0(k)]
19 compare discounts to target discounts [0(k)]
20 end
21 end
22 foreach article in the customer's cache [0(n)] do
23 | calculate results for articles under price level 1 nodes path
© 2017, IRJET | Impact Factor value: 6.171 | ISO 9001:2008 Certified Journal
| Page 1505
Fig 6: Redundant calculation of values in PCTV. EVALUATION RESULT
Correlation analysis between urbanization and economic development As described in Section 5.1, urbanization has great effect on the economic development in Indian. In this subsection, we study the correlation between urbanization and economic development. Based on the relevance analysis between urbanization and the constituent factors of the collaborative economic model
H = 13.64U + 0.21 L = 0.874UP, D = 0.86UV − 380.5, S = 0.222HLU + 0.012D − 22.8.
Herein, U is denoted as the urbanization rate, which is the
ratio of the urban resident population to the total
population. P is the total resident population and V is the
sum of the foreign capital utilization, domestic capital introduction, and loan balance of financial institutions.
Table2: The marginal incomes (Billion Yuan) of 1 percent urbanization rate improvement on factors
”Labor force”, ”Human capital”, ”Fixed-asset investment” and ”Innovation input”.
Illustrates that the global urbanization in Indian makes the major constituent factors of economic development grow
steadily in recent years. As observed, the income of ”Labor force” increased from 0.747 billion Yuan in 2001 to 2.326 billion in 2013, with urbanization rate being improved by 1 percent. The other factors saw the similar trend as well. After integrating all equations, we can obtain the correlation between GDP(Y) and urbanization rate (U).
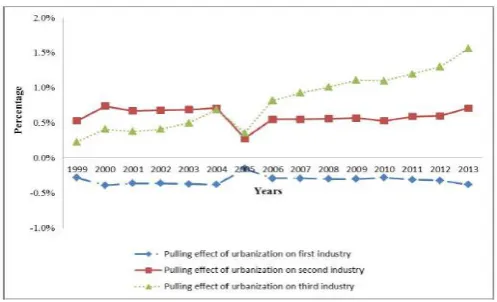
The processes of finding new cluster centers and reducing the density for each data point iterate until the remaining densities of all data points are bounded by some fraction of the density Dc1 of the first cluster center. The stopping criterion usually adopted is Dck/Dc1 < ε. Until now, all the typical annual data records for economic development are selected for the past decades. They can provide references for further development of economy.
Fig7: The pulling effects of urbanization on the first, second and third industry in Indian.
Here, Kt−1 stands for the fixed capital stock of the
previous year. When calculating the derivative of Y on U,
[image:6.595.309.560.568.718.2]the marginal income of urbanization on economic growth can be obtained, namely the pulling effect that raises one unit of urbanization rate on economic growth. Fig. 5 depicts the detailed information.
© 2017, IRJET | Impact Factor value: 6.171 | ISO 9001:2008 Certified Journal
| Page 1506
CONCLUSION
Two types of DHSA are presented, namely, PI-DHSA and PD-PI-DHSA, based on different levels of fairness. User can choose either of them accordingly. In contrast to DHSA, SEPB and Slot Pre Scheduling consider the efficiency optimization for a given slot utilization. SEPB identifies the slot inefficiency problem of speculative execution. It can balance the performance tradeoff between a single job and a batch of jobs dynamically. Slot Pre Scheduling improves the efficiency of slot utilization by maximizing its data locality. By enabling the above three techniques to work cooperatively, the experimental results show that our proposed Distributed Feature
Selection can improve the performance of the Hadoop
system significantly(i.e., 46% �115% for single jobs and 49% �112%for multiple jobs). Moreover, we also have a comparison with YARN. The experiments show that, 1) for single jobs, the result is inconclusive, 2) for multiple jobs, Distributed Feature Selection consistently outperforms YARN by about 2% �9%.In future, we plan to consider implementing Distributed Feature Selection for cloud computing environment with more metrics (e.g., budget, deadline) considered and different platforms by reviewing some existing works One can view modeling road
networks by graphs with low highwaydimensionas being
somewhat analogous to small-world models for social networks. Although real social networks do not look exactly like small-world graphs, the latter give insight into and allow the asymptotic analysis of various routing algorithms. Similarly, while real road networks may have local features that violate the small highway dimension assumption, the notion of highway dimension gives insight into and allows rigorous analysis of algorithms that work very well in practice. As already mentioned, RE, CH, and TN have been developed to be efficient on road networks.TN is the fastest among these algorithms in practice, winning the DIMACS Challenge on shortest paths.
REFERENCES
1. F. Ahmad, S. Y. Lee, M. Thottethodi, T. N.
Vijaykumar. PUMA: Purdue MapReduce
Benchmarks Suite. ECE Technical Reports, 2012.
2. G. Ananthanarayanan, S. Kandula, A. Greenberg, I.
Stoica, Y. Lu, B. Saha, and E. Harris, Reining in the outliers in map-reduce clusters using mantri, in OSDI’10, pp. 1-16, 2010.
3. Apache Hadoop NextGenMapReduce (YARN).
http://hadoop.apache.org/docs/current/hadoop-yarn/hadoop-yarn-site/YARN.html.
4. J. Chao, R. Buyya. MapReduce Programming Model
for .NET-Based Cloud Computing.In Euro-Par’09, pp. 417-428, 2009.
5. Q. Chen, C. Liu, Z. Xiao, Improving MapReduce
Performance Using Smart Speculative Execution
Strategy. IEEE Transactions on Computer, 2013
.
6. J. Dean and S. Ghemawat. MapReduce: Simplified
Data Processing on Large Clusters, In OSDI’04, pp. 107-113, 2004.
7.
Z.H. Guo, G. Fox, M. Zhou, Y. Ruan.ImprovingResource Utilization in MapReduce.In IEEE
Cluster’12. pp. 402-410, 2012
.
8. Z. H. Guo, G. Fox, and M. Zhou.Investigation of data
locality and fairness in MapReduce. In MapReduce’12, pp, 25-32, 2012.
9. Z. H. Guo, G. Fox, and M. Zhou. Investigation of
Data Locality in MapReduce. InIEEE/ACM CCGrid’12, pp, 419-426, 2012.
10. Hadoop. http://hadoop.apache.org.
11. M. Hammoud and M. F. Sakr. Locality-Aware
Reduce Task Scheduling for MapReduce.In IEEE CLOUDCOM’11. pp. 570-576, 2011.
12. M. Hammoud, M. S. Rehman, M. F. Sakr.
Center-of-Gravity Reduce Task Schedulingto Lower MapReduce Network Traffic. In IEEE CLOUD’12, pp. 49-58, 2012.
13. H. Herodotou, H. Lim, G. Luo, N. Borisov, L. Dong,
F. B. Cetin, and S. Babu.Starfish: A Self-tuning System for Big Data Analytics. In CIDR’11, pp. 261C272,2011.
14. H. Herodotou and S. Babu, Profiling, What-if
Analysis, and Costbased Optimizationof
MapReduce Programs. In Proc. of the VLDB Endowment, Vol. 4, No. 11, 2011.
15. S Ibrahim, H Jin, L Lu, B He, S Wu. Adaptive Disk
I/O Scheduling for MapReducein Virtualized Environment, In IEEE ICPP’11, pp.335-344, 2011.
16. Y. C. Kwon, M. Balazinska, B. Howe, and J. Rolia.
SkewTune: mitigating skew inmapreduce
applications. In SIGMOD’12. pp. 25-36, 2012.
17. Max-Min Fairness (Wikipedia).
© 2017, IRJET | Impact Factor value: 6.171 | ISO 9001:2008 Certified Journal
| Page 1507
18. B. Moseley, A. Dasgupta, R. Kumar, T. Sarl, On
scheduling in map-reduce andflow-shops. In SPAA’11, pp. 289-298, 2011.
19. C. O˘guz, M.F. Ercan, Scheduling multiprocessor
tasks in a two-stage flow-shopenvironment. Proceedings of the 21st international conference on Computers andindustrial engineering, pp. 269-272, 1997.
20. B. Palanisamy, A. Singh, L. Liu and B. Jain,
Purlieus: Localityaware ResourceAllocation for MapReduce in a Cloud, In SC’11, pp. 1-11, 2011.
21. J. Polo, C. Castillo, D. Carrera, et al.
Resource-aware Adaptive Scheduling for MapReduce Clusters. In Middleware’11, pp. 187-207, 2011.
22. J. Tan, X. Q. Meng, L. Zhang. Coupling task progress