Egil Ferkingstad
*†
, Arnoldo Frigessi
*
and Heidi Lyng
‡
Addresses: *Department of Biostatistics and (sfi)2 Statistics for Innovation, University of Oslo, Gaustadalleen, Oslo, NO-0314, Norway. †Centre for Integrative Genetics, Norwegian University of Life Sciences, Arboretveien, Aas, NO-1432, Norway. ‡Department of Radiation Biology, Institute for Cancer Research, Norwegian Radium Hospital, Montebello, Oslo, NO-0310, Norway.
Correspondence: Egil Ferkingstad. Email: egil.ferkingstad@medisin.uio.no
© 2008 Ferkingstad et al.; licensee BioMed Central Ltd.
This is an open access article distributed under the terms of the Creative Commons Attribution License (http://creativecommons.org/licenses/by/2.0), which permits unrestricted use, distribution, and reproduction in any medium, provided the original work is properly cited.
Indirect genomic effects on cancer patient survival
<p>A novel methodology is presented for detecting and quantifying indirect effects on cancer survival mediated through several target genes of transcription factors in cancer microarray data.</p>
Abstract
In cancer, genes may have indirect effects on patient survival, mediated through interactions with other genes. Methods to study the indirect effects that contribute significantly to survival are not available. We propose a novel methodology to detect and quantify indirect effects from gene expression data. We discover indirect effects through several target genes of transcription factors in cancer microarray data, pointing to genetic interactions that play a significant role in tumor progression.
Background
There exists a large literature studying associations between survival and high throughput gene expression data [1-5]. Also, much work has been done to elaborate pathways and regulatory networks [6-10]. We have developed a new method combining survival and pathway analysis technolo-gies, aiming at a causal understanding of how gene expression affects survival. This allows us to discover indirect effects of gene expression on patient survival, mediated through other genes. To our knowledge, no comparable method exists that can achieve this. For the first time, we are able to identify in cancer microarray data significant indirect effects of tran-scription factors, such as PPAR proteins, E2F1 and MYC, on survival.
Genome-wide exploration for genes involved in malignant diseases will enable the development of new approaches in cancer diagnostics and therapeutics that will revolutionize the drug discovery field and the development of personalized medicine [11,12]. Lists of genes predictive for treatment out-come of various cancers have been presented, and may poten-tially be used for selecting patients at risk for treatment
failure and aid in clinical decision making. However, the organization of the prognostic genes into structured, func-tionally meaningful information is difficult and, currently, one of the main obstacles limiting the clinical utilization of microarray data [13,14].
A major challenge in the interpretation of microarray results is understanding the biological effect mediated by transcrip-tion factors. These proteins are often key actors in complex regulatory networks containing many signaling pathways, and may interact with other prognostic genes. They can have several modes of interaction with their targets, such as tran-scriptional activation and/or repression of genes and post-transcriptional modification of proteins [15,16]. Their effect can, therefore, be mediated both by changing the expression level of other genes and through mechanisms undetectable in gene expression studies. Due to the central role of many tran-scription factors in controlling the cellular phenotype, these have been proposed as potential targets for therapeutic inter-vention [17]. However, transcriptional interaction between these proteins and other genes makes it difficult to predict the outcome of such interventions. Elucidation of how the Published: 22 March 2008
Genome Biology 2008, 9:R58 (doi:10.1186/gb-2008-9-3-r58)
Received: 14 November 2007 Revised: 24 January 2008 Accepted: 22 March 2008 The electronic version of this article is the complete one and can be
different effects mediated by transcription factors contribute to the development of aggressive cancer phenotypes will aid the design of efficient drugs that interfere with key pathways of the regulatory network.
Current pathway analysis tools have proved useful for validat-ing known interactions of transcription factors and proposvalidat-ing unknown pathways in their regulatory networks [18]. How-ever, these tools make no use of the important information represented by patient survival data and are not, therefore, suitable for exploring direct transcription factor-target rela-tionships that may have prognostic value. Our aim was to enable detection, separation, quantification and comparison of possible direct and indirect effects on survival that are mediated by transcription factors. We consider a data set with genes, the expression levels of which are measured using material from patients. Note that the data consists of both the gene expression measurements and a data set of regulatory interactions between genes. A gene has an 'indirect effect' on survival if its expression influences survival through one or more other prognostic genes present in the data. A gene has a 'direct effect' on survival if its expression influences survival and no other gene is found in the dataset through which this effect is mediated. A direct effect is caused by interactions that are undetectable in the given gene expression data, because the effect is mediated either through protein modifi-cations or by transactivation/repression of genes that are not associated with survival and/or are not included in the data set.
We applied the method to the gene expression data of three previously published cancer studies. In all three cases we identified several transcription factors with one or more indi-rect effects on survival, pointing to the interactions of major importance for the development of an aggressive tumor phe-notype. Although the indirect effects were always weaker than the direct effect, they are highly significant and of biological interest. We further demonstrate that the indirect effect did not always strengthen the direct effect, but for some genes, counteracted it, posing fundamental questions about the effect of therapeutic targeting of transcription factors. Protein expression, phosphorylation and/or enzymatic activities can be used alone or together with gene expression in our model, providing a more comprehensive exploration of the path-ways. Our method represents a totally new way of utilizing large scale gene and protein data that may increase our knowledge of how specific transcription factors contribute to the progression and treatment outcome of cancers as well as other diseases.
Results
Hunting for indirect effects
First, we illustrate the results that are obtained with our method, using the genes PPARD (encoding peroxisome pro-liferator-activated receptor D) and ADFP (encoding adipose
differentiation-related protein) as an example (Figure 1, model 2). All details are explained in the subsequent text. We have gene expression data for both genes from cancer patients and censored survival data from the same patients. It is known that expression of PPARD influences expression of
ADFP. An effect of PPARD on survival could, therefore, be mediated through ADFP. In our terminology, this is an indi-rect effect of PPARD on survival, through ADFP. Other indi-rect effects of PPARD, through other genes, could also exist, and PPARD could also have a direct effect on survival, that is, an effect that is not mediated through any other genes in our data set. Using our method, we can discover and quantify the strengths of such indirect and direct effects. Specifically, we found that, summed over the first five years, PPARD had a direct effect on survival of 0.141 (with a 95% bootstrap confi-dence interval of (0.047, 0.206)), and an indirect effect of 0.048 (95% confidence interval of (0.030, 0.101)). In this case, all effects are positive, indicated by plus signs on the arrows in Figure 1. In other cases, the effects can be negative, indicated by minus signs. Positive effects are harmful (increase the risk of death), while negative effects are benefi-cial. Since the bootstrap confidence intervals do not contain zero, both the direct and indirect effects are significant. The 'total effect' is simply the sum of the direct and indirect effects. Here, approximately 24% of the total effect is indirect.
We developed a stepwise procedure, generating the candidate networks, selecting significant genetic interactions, and iden-tifying the most relevant dynamic path models with indirect effects.
Survival genes and survival forests
Dynamic path models for the Dutch breast cancer data set Figure 1
Dynamic path models for the Dutch breast cancer data set. The top panel shows the thinned survival forest after selecting genetic interactions for which an indirect and direct effect likely existed. Black arrows indicate a total of 19 significant interactions. The thinned forest consisted of eight networks. A number of dynamic path models were fitted to different sub-networks of these networks: Each connected component, each rooted subtree (that is, each gene with all of its descendants), and each interaction separately. For ten models there was at least one significant indirect effect, indicated with rectangles of different colors. Below the thinned survival forest, the ten models with at least one significant indirect effect are shown. Interactions with significant direct or indirect effects are marked with red arrows. The plus and minus signs on arrows between two genes indicate transcriptional activation and repression, respectively, whereas the plus and minus signs on arrows pointing to survival (dN(t)) indicates that poor survival is associated with activation and repression of the gene, respectively. For each significant path, the average strength of the direct and indirect effect during the first five years is listed, along with a 95% bootstrap confidence interval.
PPARA −> MCM7 −> dN(t): 0.021 (0.016, 0.068) PPARA −> PLTP −> dN(t):
0.009 (0.001, 0.031) STAT5A −> dN(t): −0.062 (−0.119, −0.010) STAT5A −> RAD51 −> dN(t):
−0.014 (−0.045, −0.011) PPARD −> dN(t):
0.178 (0.110, 0.256) PPARD −> PPARA −> dN(t):
0.011 (0.004, 0.028)
PPARD −> dN(t): 0.141 (0.047, 0.206) PPARD −> ADFP −> dN(t):
0.048 (0.030, 0.101)
E2F1 −> dN(t): 0.116 (0.098, 0.216) E2F1 −> BBC3 −> dN(t):
0.018 (0.006, 0.030)
MSX2 −> dN(t): −0.040 (−0.098, −0.013) MSX2 −> FGF2 −> dN(t):
0.009 (0.002, 0.024)
MYBL2 −> dN(t): 0.109 (0.099, 0.234) MYBL2 −> MYB −> dN(t):
0.057 (0.038, 0.087)
PPARD −> PPARA −> MCM7 −> dN(t): 0.004 (0.002, 0.018)
1
2
3
4
5
6
7
8
9
10
STAT5A
PPARA MYC RAD51
dN(t) IL6ST MCM7 PLTP
PPARD
ADFP ANGPTL4 PPARA
dN(t)
IL6ST MCM7 PLTP
PPARA
IL6ST MCM7 PLTP
dN(t)
PPARG
ADFP ANGPTL4
dN(t)
PPARD
ANGPTL4
dN(t) PPARG PPARD
PPARA
dN(t)
PPARD
ADFP
dN(t)
BBC3
dN(t) E2F1
FGF2
dN(t) MSX2
MYB
dN(t) MYBL2
+ +
+
+ +
+
+ +
+
+
+
+
+ +
+ +
+
+
+ +
+ + _
_
_
_
_
_
_
_
_
PPARD −>dN(t): 0.158 (0.100, 0.252) PPARD −> ANGPTL4 −> dN(t):
0.031 (0.021, 0.067) PPARG −> ANGPTL4 −> dN(t):
0.031 (0.015, 0.057) PPARG −> dN(t):
−0.068 (−0.120, −0.007) PPARG −> ADFP −> dN(t):
0.023 (0.011, 0.061)
_
STAT5A RAD51
MYC PPARA PLTP IL6ST MCM7
PPARD ADFP
PPARG ANGPTL4
E2F1 BBC3
MSX2 FGF2
MYBL2 MYB
STAT6 GATA3
FOXM1 IPF1
RB1 CDC2
essential to our methodology. The only requirement is that the hypothesized pathways can be modeled by directed graphs. We obtained a collection of directed graphs, called a 'survival forest', representing known pathways involving the survival genes (Figure 2). Only pathways that could be repre-sented as directed acyclic graphs (DAGs) were selected. Our method currently does not handle feedback effects, which are then appropriately simplified. Since our basis was gene expression data, we considered only transcriptional interac-tions, meaning that each pathway contained at least one pro-tein with known transcription factor activity interacting with one or more other genes by changing their expression level. Each interaction was then of the form gene A → gene B, which we write as A →B, representing that the expression of gene A
influences the expression of gene B. The collection of all the pathways in the survival forest was analyzed further, to find the significant direct and indirect effects on survival.
Thinning the survival forest for possible indirect effects
Since our purpose was to identify transcription factors with one or more indirect effects on survival, in addition to direct effects, we deleted all genes where significant indirect effects were unlikely. This selection was based on the likelihood of finding evidence of indirect effects (Figure 2). For each inter-action A →B the additive hazard regression model with A and
B as covariates and survival as response was fitted to the gene expression data. We chose the interactions for which both the effects of A and B on survival were significant at p < 0.05 and dropped other links. This was done because the interaction A
→ B, for which both A and B influence survival, gives the potential for an indirect effect of A through B in addition to the direct effect of A on survival. The selection procedure, therefore, reduced the survival forest to a collection of inter-action networks for which the expression of all genes was sig-nificantly correlated with survival. Thinning also leads to a computational advantage. This 'thinned survival forest' formed the basis for the dynamic path modeling.
Selecting dynamic paths with indirect effects
We now searched every network in the thinned survival forest for significant indirect effects by dynamic path analysis [20] (in Materials and methods). This led to a further reduction of the forest, such that it only included networks where indirect effects were significant (Figure 2).
The analysis was performed on each network separately. The results depended on which genes of each network were included in the model. There is a trade-off between accuracy and power when selecting models. Choosing a large model reduces the risk of leaving out possible interacting survival genes. On the other hand, interesting effects may be reduced in a large model, because covariates can be more correlated by chance. Hence, we operated systematically. First, a dynamic path model was fitted to each connected component of the networks separately. Within a connected component, a model was fitted for each gene together with all its
descend-ants (if any). In the final stage of this strategy, each pair of interactions was modeled separately.
For each model, the strength of the individual interactions was precisely quantified as described in Materials and meth-ods. These estimated effects can be positive or negative. For interactions between genes, a positive effect of A →B means that an increase in the expression of A leads to an increase in the expression of B, and a negative effect means the opposite. For an effect from a gene to survival, a positive effect is harm-ful (increases the risk of death), while a negative effect is ben-eficial. The unit of the effect is the increase in the death rate per unit increase of gene expression.
After the models had been fitted, we used bootstrapping to judge whether the estimated effects were significant. A total of 1,000 bootstrap replications were used. Because of deaths and censorings, the set of patients on which the estimation is based changes over time. The effects can, therefore, be esti-mated at every time point and change when the population at risk changes. Hence, the significance of the effects also changes at each time point. We considered an effect as signif-icant if the 95% bootstrap confidence interval did not contain zero after five years, which is a commonly used horizon in cancer studies. Longer time periods can be used, but estima-tion becomes less precise due to the lower number of patients with such long survival times. We selected only models con-taining at least one significant effect.
Multiple testing
Running a separate test on each genetic interaction created multiple testing concerns. To address these, we used a per-mutation approach where the whole selection procedure was run repeatedly on randomly permuted survival data. In this way we could assess how many interactions would be found if the gene expression levels and survival times were completely unrelated. A total of 1,000 permutations were run for each data set, and the resulting number of interactions selected when only generated by chance was compared to the actual findings, as demonstrated in Table 1 for the data sets analyzed below.
Confounding
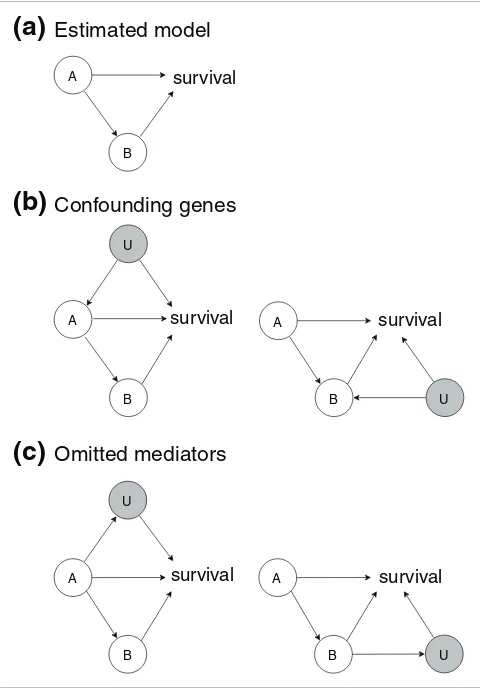
Can confounding misguide our results? What if relevant genes or interactions were incorrectly omitted from our mod-els? Figure 3 illustrates this issue. Assume that we would obtain a significant estimated model, with genes A and B sig-nificantly associated with survival, and with the interaction A
→B present in the thinned survival forest (Figure 3a). A has a direct effect on survival, as well as an indirect effect through
B. Figure 3b illustrates the problem of confounding. U is another gene, or more generally, a collection of genes. The gray shading indicates that U is omitted, that is, not a part of the estimated model. The problem is that the 'common cause'
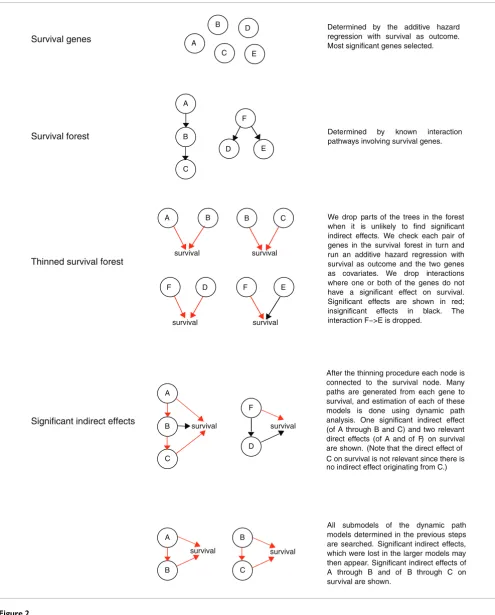
Selecting dynamic path ls Figure 2
Selecting dynamic path models. This figure shows a description of the dynamic path model selection procedure. A, B, ... represent gene A, gene B, .... Arrows indicate interactions between genes or between gene and survival.
Survival genes A
B
C D
E
Survival forest Determined by known interaction
pathways involving survival genes. A
B
C
D E
F
Significant indirect effects
A
B
C
F
D
survival survival
After the thinning procedure each node is connected to the survival node. Many paths are generated from each gene to survival, and estimation of each of these models is done using dynamic path analysis. One significant indirect effect (of A through B and C) and two relevant direct effects (of A and of F) on survival are shown. (Note that the direct effect of
no indirect effect originating from C.)
A
B
survival B
C
survival
All submodels of the dynamic path models determined in the previous steps are searched. Significant indirect effects, which were lost in the larger models may then appear. Significant indirect effects of A through B and of B through C on survival are shown.
Thinned survival forest
We drop parts of the trees in the forest when it is unlikely to find significant indirect effects. We check each pair of genes in the survival forest in turn and run an additive hazard regression with survival as outcome and the two genes as covariates. We drop interactions where one or both of the genes do not have a significant effect on survival. Significant effects are shown in red; insignificant effects in black. The interaction F−>E is dropped.
A B
survival
D F
survival
E F
survival C B
survival
Determined by the additive hazard regression with survival as outcome. Most significant genes selected.
on survival. If the true state of nature corresponds to Figure 3b, while our estimated model is that of Figure 3a, we produce biased effects or a false positive. Assume that the data source of regulatory interactions contains the interactions U → A
and U →B. Then, we argue that the situations in Figure 3b are unlikely to occur in our methodology, because of the way the stepwise selection procedure works (Figure 2). To see this, note that for a confounding gene U to be present, U must have an effect on survival. But this means that U would have been one of the 'survival genes' kept in the first step of the selection procedure, and hence would not be omitted. At least for the breast cancer data sets, we do have expression measurements for the majority of genes that could affect survival. Further-more, the interaction U →A (or U →B) would have remained after the thinning procedure, since there would be evidence for both A → survival and U → survival from the data. For these reasons, it appears unlikely that we would estimate the model of Figure 3a if any of the models in Figure 3b were true. In the presence of a confounding gene U, the effects U →A
and U → survival would be discovered, and the correct model would be estimated. However, it should be pointed out that if the interactions U →A or U →B are not present in the data source one is using (that is, if these regulatory interactions are not known in the literature), then the preceding argument does not hold. Also, if U is not a gene, but some unmeasured environmental factor such as smoking, then, as smoking could affect both gene A (gene B) and survival, the problem of confounding could arise. But this is a potential problem in any statistical analysis not controlling for relevant environ-mental factors, and nothing in our methodology would make our results more vulnerable than usual to confounding in this more general sense. Still, care should be taken in the interpre-tation of our models, and we do not claim to discover 'causal relations' in the strict sense of the term. The third general effect of 'missing interactions' is illustrated in Figure 3c. Here,
U is a (set of) omitted mediator(s). In the left panel, there is an additional path A →U → survival, which is left out of the models, and the left panel shows a case with a missing inter-action A →B →U → survival. In fact, this situation is not problematic: in the situation shown in the left panel, the direct effect should be defined as the sum of the two paths A
→ survival and A →U → survival, and the indirect effects should be defined similarly as the sum of the two paths through B. The reason is simply that the inclusion of omitted mediators is equivalent to looking at a system in greater detail
(finer resolution), which may always be done, and this does not invalidate the model defined at a coarser resolution.
Dynamic path model in cancer genomics data
[image:6.612.313.553.309.655.2]We applied dynamic path analysis on three microarray data sets containing right-censored survival times for the patients. In all cases, we estimated cumulative effects after five years; Table 1
Permutation test
Number of interactions 1 2 3 4 5 6 7 8 9 10 11 Our finding
Dutch data 0.844 0.087 0.036 0.017 0.009 0.003 0.003 0.001 0.000 0.000 0.000 19
Uppsala data 0.698 0.150 0.081 0.032 0.018 0.006 0.006 0.002 0.003 0.002 0.002 7
DLBCL data 0.829 0.095 0.043 0.022 0.004 0.005 0.002 0.000 0.000 0.000 0.000 9
This table shows the probabilities of finding the number of interactions listed in the first line, if survival and gene expression were associated at random.
Confounding and omitted mediators Figure 3
Confounding and omitted mediators. This figure illustrates issues connected to omitted genes/interactions. (a) The assumed estimated model, as produced by our method. (b) The problem of confounding. (c) Two cases of omitted mediators.
Estimated model
A
B
survival
A
B
survival A
B
survival
U
U
Confounding genes
A
B
survival A
B
survival
U
U
Omitted mediators
(a)
(b)
that is, the effects are sums over the first five years of observation.
Dutch breast cancer data
The Dutch breast cancer data set from the study of van de Vijver et al. [21] and van Houwelingen et al. [22] consists of 24,885 gene expression values for 295 women with breast cancer. A total of 175 genetic pair interactions were generated by Pathway Studio based on the gene list of 1,000 survival genes. Out of these, the selection procedure resulted in 19 interactions for which an indirect and direct effect likely existed (Figure 1). This gave a thinned survival forest with eight networks. The number of 19 interactions is highly signif-icant, showing the pronounced reliability of the results, since in the permutation test a single interaction was selected in 844 out of 1,000 permutations, and more than 8 interactions were never selected (Table 1).
Dynamic path modeling based on the selected genetic inter-actions of the thinned survival forest resulted in ten models with at least one significant indirect effect on survival (Figure 1). There were two major types of models. The simple models involved two genes in the significant subnetwork, a transcrip-tion factor with a single interacting gene (models 1-6 and 9). In the complex models with three or more genes in the signif-icant subnetwork, a transcription factor showed indirect effects through two genes (models 7 and 8), or two transcrip-tion factors had an indirect effect through a common gene (model 10). In the former cases the indirect effect was either through serially interacting genes (model 7) or genes interact-ing in parallel with the transcription factor (model 8). Mem-bers of the peroxisome proliferator-activated receptors (PPAR) family were involved in all the complex and some of the simple models, whereas E2F1, MSX2, and MYBL2 were involved in simple models.
In most cases the indirect effect strengthened the direct one, leading to a stronger total effect than suggested from the direct effect. A typical example is shown in model 1, where activation of PPARD led to a direct effect of 0.178 and an indi-rect effect of 0.011 through PPARA, resulting in a total effect of 0.189. This means that a unit increase in the expression of
PPARD implies an increase in the death rate of 0.189 deaths per year, so here the indirect effect is 5.8% of the total effect on survival. The indirect effect could, however, also counter-act the direct effect (models 4 and 9). Hence, repression of
PPARG led to a negative direct effect of -0.068, whereas activa-tion of PPARG was indirectly associated with poor survival through ADPF with a positive strength of 0.023 (model 9). The total effect of PPARG in this model was, therefore, -0.045, still negative but weaker than expected from the direct effect alone. For all models that included both a significant direct and a corresponding significant indirect effect, the indirect effect was weaker than the direct one, but could still represent a strength of more than 50% of the indirect effect (range 6-52%). However, for some models we found indirect effects
without corresponding significant direct effects: the indirect effect of PPARD in model 7, the indirect effect of PPARA in model 8 and the indirect effect of PPARG in model 10, sug-gesting that the indirect effects were strong compared to the direct ones in these cases.
We have reported estimated cumulative effects after five years. In fact, all our estimates are available in continuous time. To illustrate this, Figure 4 shows the time course devel-opment of model 2 of Figure 1, containing the two genes
PPARD and ADFP. From these cumulative plots, we read that the indirect effect (Figure 4a) is positive and stable for the
Time evolution of the dynamic path model containing PPARD and ADFP Figure 4
Time evolution of the dynamic path model containing PPARD and ADFP. This figure shows the time evolution of the model from model 2 of Figure 1. (a) The cumulative indirect effect of PPARD (through ADFP) on survival, and (b) the cumulative direct effect of PPARD on survival. The indirect and direct effects are estimated as explained in Materials and methods; see particularly equations 3 and 4 for details of the calculations. The indirect effect is approximately constant for the first six years, and zero thereafter (recall that the plots are cumulative). Similarly, the direct effect remains positive and stable for the first three years, and then becomes zero. As expected, confidence intervals become wider over time, due to fewer remaining patients. Based on these plots, the use of a five year horizon seems reasonable.
0 2 4 6 8 10
0.0
0.2
0.4
0.6
0.8
1.0
1.2
(a)
Time (years)
Cum
ulativ
e indirect eff
ect
0 2 4 6 8 10
0.0
0.2
0.4
0.6
0.8
1.0
1.2
(b)
Time (years)
first six years, disappearing thereafter. The direct effect (Figure 4b) is stably positive for the first three years, and then vanishes. Both plots show widening confidence intervals over time, due to fewer remaining patients alive and under observation.
Uppsala breast cancer data
The Uppsala breast cancer data set from Miller et al. [23] con-sists of 44,928 gene expression measurements for 251 breast cancer patients. A total of 380 genetic interactions were gen-erated based on an input list of 2,000 survival genes. Seven interactions in six networks were chosen by the selection pro-cedure (Figure 5). The number of interactions was much higher than expected by chance alone (Table 1), suggesting
the selected interactions are highly reliable. The genetic inter-action STAT5A →PPARA was among those selected, as in the case of the Dutch breast cancer data set (Figure 1).
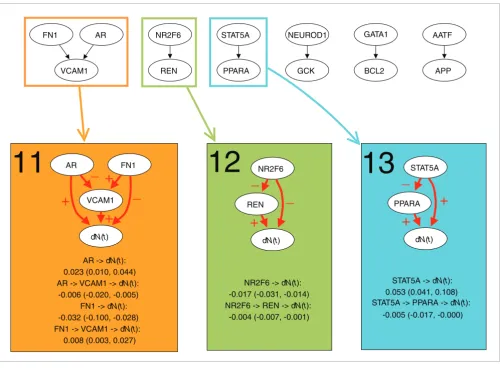
Three models with at least one indirect effect on survival were found by the dynamic path analysis (Figure 5). All models also included a significant direct effect. There was one com-plex model, where both AR and FN1 had an indirect effect through VCAM1 (model 11), and two simple models, where
NR2F6 and STAT5A showed indirect effects through REN
and PPARA, respectively (models 12 and 13). The indirect effect of NR2F6 strengthened the direct one (model 12), whereas for AR, FN1 and STAT5A, a weakening of the direct effect occurred (models 11 and 13). The strength of the
[image:8.612.55.555.261.629.2]indi-Dynamic path models for the Uppsala breast cancer data set Figure 5
Dynamic path models for the Uppsala breast cancer data set. The top panel shows the thinned survival forest after selecting genetic interactions for which an indirect and direct effect likely existed. Black arrows indicate a total of seven significant interactions. The thinned forest consisted of six networks. A number of dynamic path models were fitted to different sub-networks of these networks: each connected component, each rooted subtree (that is, each gene with all of its descendants), and each interaction separately. For seven models there was at least one significant indirect effect, indicated with rectangles of different colors. Below the thinned survival forest, the seven models with at least one significant indirect effect are shown. Interactions with significant direct or indirect effects are marked with red arrows. The plus and minus signs on arrows between two genes indicate transcriptional activation and repression, respectively, whereas the plus and minus signs on arrows pointing to survival (dN(t)) indicate that poor survival is associated with activation and repression of the gene, respectively. For each significant path, the average strength of the direct and indirect effect during the first five years is listed, along with a 95% bootstrap confidence interval.
11
12
13
FN1
VCAM1
AR NR2F6
REN
STAT5A
PPARA
NEUROD1
GCK
GATA1
BCL2
AATF
APP
AR
VCAM1
dN(t)
FN1 NR2F6
REN
dN(t)
STAT5A
PPARA
dN(t)
AR -> dN(t): 0.023 (0.010, 0.044) AR -> VCAM1 -> dN(t):
-0.006 (-0.020, -0.005) FN1 -> dN(t): -0.032 (-0.100, -0.028) FN1 -> VCAM1 -> dN(t):
0.008 (0.003, 0.027)
NR2F6 -> dN(t): -0.017 (-0.031, -0.014) NR2F6 -> REN -> dN(t):
-0.004 (-0.007, -0.001)
STAT5A -> dN(t): 0.053 (0.041, 0.108) STAT5A -> PPARA -> dN(t):
-0.005 (-0.017, -0.000)
+
+
+
+
+
+
_
_
_
_
rect effect ranged from 9-26% of the direct effect.
Diffuse large B-cell lymphoma data
The diffuse large B-cell lymphoma (DLBCL) data set from [24] contains 7,399 gene expression measurements of 240 patients with DLBCL. Based on a gene list of 1,000 survival genes, 385 genetic interactions were generated. Nine of these were chosen by the selection procedure (Figure 6), which were much higher than expected by chance alone (Table 1). The thinned survival forest consisted of eight networks.
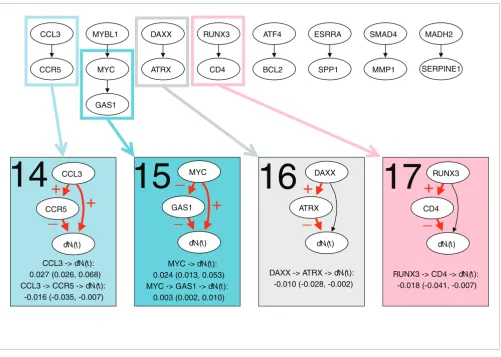
Four dynamic models with at least one significant indirect effect were found (Figure 6). All models were simple, consist-ing of two genes, and in two cases the direct effect was not sig-nificant (models 16 and 17). Both strengthening and counteracting indirect effects were found. The direct effect of
MYC (0.024) was strengthened by the indirect effect caused by repression of GAS1 (0.003), increasing the total effect of
MYC to 0.027 (model 15). The direct effect of CCL3 (0.027), on the other hand, was counteracted by the negative indirect effect through CCR5 (-0.016), resulting in a total effect of 0.011 (model 14). The indirect effect of MYC and CCL3 had strengths of 59% and 13% of the direct effect, respectively.
Discussion
[image:9.612.55.556.84.440.2]We have developed a statistical tool based on dynamic path modeling of gene expression data to detect and quantify indi-rect effects of genes on survival. The use of the additive, rather than multiplicative, hazard model for regression of survival data onto covariates enabled separation of direct and indirect effects in the dynamic path model [20]. By use of permutation Dynamic path models for the DLBCL data set
Figure 6
Dynamic path models for the DLBCL data set. The top panel shows the thinned survival forest after selecting genetic interactions for which an indirect and direct effect likely existed. Black arrows indicate a total of nine significant interactions. The thinned forest consisted of eight networks. A number of dynamic path models were fitted to different sub-networks of these networks: each connected component, each rooted subtree (that is, each gene with all of its descendants), and each interaction separately. For ten models there was at least one significant indirect effect, indicated with rectangles of different colors. Below the thinned forest, the ten models with at least one significant indirect effect are shown. Interactions with significant direct or indirect effects are marked with red arrows. The plus and minus signs on arrows between two genes indicate transcriptional activation and repression,
respectively, whereas the plus and minus signs on arrows pointing to survival (dN(t)) indicate that poor survival is associated with activation and repression of the gene, respectively. For each significant path, the average strength of the direct and indirect effect during the first five years is listed, along with a 95% bootstrap confidence interval.
CCL3 -> dN(t): 0.027 (0.026, 0.068) CCL3 -> CCR5 -> dN(t):
-0.016 (-0.035, -0.007)
MYC -> dN(t): 0.024 (0.013, 0.053) MYC -> GAS1 -> dN(t):
0.003 (0.002, 0.010)
DAXX -> ATRX -> dN(t): -0.010 (-0.028, -0.002)
RUNX3 -> CD4 -> dN(t): -0.018 (-0.041, -0.007) CCL3
CCR5
MYBL1
MYC
GAS1
DAXX
ATRX
RUNX3
CD4
ATF4
BCL2
ESRRA
SPP1
SMAD4
MMP1
MADH2
SERPINE1
RUNX3
CD4
dN(t) DAXX
ATRX
dN(t) MYC
GAS1
dN(t) CCL3
CCR5
dN(t)
+
_
+
+
+
+
_
_
_
_
tests we demonstrated a high reliability in the selected genetic interactions. Moreover, all possible path models were considered in a systematic way to ensure that all significant effects were detected. Based on three publicly available microarray data sets, we found evidence for significant indi-rect effects of many transcription factors associated with the survival of cancer patients. Although our findings are clearly data dependent and incomplete, since the identification of effects was based on known transcriptional interactions, they demonstrate how novel information of transcription factor-target interactions and their importance for survival can be obtained with our method. Extending our knowledge of tran-scriptional interactions may, therefore, increase the number of indirect effects detected, even based on the same expres-sion data.
Confounding represents a persistent danger in studies like ours. We have argued that our method is robust with respect to the most important possible pitfalls. The results are guarded against omitted mediators. Omitted common causes can confound direct and indirect effects, but we have argued that a genetic origin of these is unlikely.
The regulatory networks of many of the transcription factors with indirect effects in our work, such as the PPAR proteins,
E2F1, MYC, and RUNX3, are highly complex with numerous interconnected genes and feedback loops [25-29]. Activation of these pathways collectively promotes tumor growth and progression, although expression of the individual members of the pathways is not necessarily associated with survival. The dynamic path models are simple compared to the entire network of the transcription factors, showing that only a few of the interactions are associated with survival in our data. By finding significant indirect effects, we identified key interac-tions, pointing to the most important pathways. Moreover, the quantitative information of these effects indicates to what extent they counteract or strengthen the direct effect. Note that while the absolute values of the coefficients can be directly compared within each of the data sets, these values are not comparable between data sets, since the data sets are not standardized to a common scale. However, relative val-ues, presented as the ratio between the indirect and direct effect or the indirect and total effect can be compared both within and between studies. The indirect effects contributed significantly to the total effect, and their identification may, therefore, be useful for understanding the role of transcrip-tion factors in the development of aggressive tumor phenotypes.
PPARA, PPARD, and PPARG were involved in many of the indirect effects identified in breast cancer. These proteins are members of the nuclear receptor family and are active in the regulation of lipid metabolism, energy balance, inflammation, and atherosclerosis through interactions with numerous genes [25,30]. The participation of these proteins in the most complex dynamic path models was therefore
plausible. The indirect effects were mainly mediated through proteins involved in lipid metabolism, such as ADFP [31], phospholipid transfer protein [32], and angiopoietin-like protein 4 [33], where the strongest one was the indirect effect of PPARD mediated by ADFP. A major role of the PPAR pro-teins in the development of aggressive breast cancers is, therefore, probably to deregulate lipid metabolism through interactions with these proteins. Other transcription factors with indirect effects in breast cancer were E2F1 and STAT5A, which are essential in the regulation of tumor growth and apoptosis [26,27]. Their indirect effects were mediated through BBC3 (E2F1), RAD51 and PPARA (STAT5A), sug-gesting that the interaction of E2F1 and STAT5A with these proteins contributed significantly to their effect on survival. Of note is the apparent inconsistency between the two breast cancer data sets with respect to the direct effect of STAT5A: Repression of STAT5A was associated with poor survival in the Dutch data set, whereas activation of the same protein correlated with poor survival in the Uppsala data set. We speculate that this inconsistency could be due to some intrin-sic difference in the two populations; for example, patients could be in different stages of the disease for each data set.
MYC and RUNX3, which are regulators of cellular processes such as proliferation and differentiation [28,29], were among the transcription factors with indirect effects in lymphomas.
MYC had an indirect effect through the cell cycle inhibitory gene GAS1, consistent with previous studies indicating that
GAS1 repression is important for MYC-induced promotion of cell growth [34]. RUNX3 showed an indirect effect through the T-cell antigen CD4, which is a marker for thymocyte dif-ferentiation. RUNX3 is required for silencing of CD4 [35], and our results suggest that this silencing plays a significant role in RUNX3-induced progression of lymphomas.
Many of the transcription factors with indirect effects, includ-ing PPARG, E2F1, STAT5A, and MYC, have been suggested as targets for cancer therapy [36-40]. The numerous interac-tions of these transcription factors make the outcome of such targeted therapy difficult to predict. Our work indicates that indirect effects of transcription factors can counteract and thereby diminish the direct effect. This was the case for
indi-rect effects. It should also be mentioned that activation of pathways not associated with survival, and therefore not considered here, may induce other side effects that have to be considered in the design of the targeted therapy.
Conclusion
Dynamic path analysis of large scale gene expression data provides reliable quantification of indirect effects of transcription factors on survival. An improved picture of how transcription factors mediate their effect on survival can therefore be obtained. This may lead to a more precise predic-tion of the effect of new therapeutics targeting transcrippredic-tion factors and the need to develop complex mixture genetic ther-apies. Instead of survival, other time-to-event data can be considered in our model, for example, time to relapse of advanced disease. The method can be applied widely and handle other data sets, such as protein phosphorylation data. In such cases, interactions between phosphorylating proteins and their targets will be considered. Gene and protein data can also be included in the same analysis, providing a more comprehensive analysis of pathways.
Materials and methods
Path analysis and graphical models
The basic idea of graphical modeling is to represent the rela-tions between variables in a graph with vertices and edges connecting vertices [41]. Vertices represent variables, and there is an edge between two vertices if the corresponding variables are related. The type of relation varies with the spe-cific scientific context and can represent, for example, translational pathways. We focus on DAGs. In a 'directed graph' the edges are directed from one vertex to another. A 'path' is a list of vertices connected along directed edges. A 'directed cycle' is a path of edges beginning and ending in the same vertex, representing a feedback control system. Such regulatory systems are not handled by our method. A directed graph is a DAG if it has no directed cycles.
Each vertex of a DAG represents a random variable Xi, where
i = 1,...,n and n is the number of vertices. In our application, i
is a gene, Xi is a gene expression measurement, and the DAG represents a regulatory network with several signaling path-ways. The edges are interactions between the genes. Infor-mally, there is an edge from Xj to Xh if Xj directly influences
Xh, that is, if the expression of gene j influences the expression of gene h in some way. Relationships between variables are assumed to be linear. A 'path model' for (X1,...,Xp) is defined by letting
where the εj are independent and identically distributed model error terms with expectation zero and variance σ2 (we
do not need the assumption that these are normally distributed). The γhj are called 'path coefficients'. The associ-ated 'path diagram' is a DAG G with an edge from Xh to Xj if and only if γhj ≠ 0.
For a vertex Xj, the 'parents' of Xj are defined as the set of Xh
for which there is an edge from Xh pointing to Xj. Because of the linear structure of equation 1, the path coefficients γhj can be estimated by recursively regressing each variable onto its parents using ordinary least squares regression.
The additive hazard regression model
The additive hazard model [19,42] is a model for regression of censored survival data onto (possibly time-dependent) cov-ariates. The model is an alternative to the proportional hazards model [43], which is a multiplicative model. The additive structure of the model is crucial for separating the direct genetic effects from the indirect ones in the dynamic path analysis.
The outcome of interest is, for our purpose, a counting proc-ess Ni(t) indicating whether death has been observed to occur within time t for individual i (such that Ni(t) = 1 if death has occurred at or before time t; Ni(t) = 0 otherwise). We use informally dNi(t) for the possible change in the counting process in the infinitesimal time interval [t, t + dt) and denote by Ft- all information (on deaths, censorings, covariates, and so on) until just before time t. The intensity process is then defined as:
λi(t) = Prob(dNi(t) = 1|Ft-).
Letting Ri(t) be the at-risk indicator for individual i (R(t) = 1 if individual i is observed at time t, R(t) = 0 otherwise), the intensity process may be written as:
λi(t) = Ri(t)αi(t)
where αi(t) is the hazard rate. If Xi1,...,Xip are p covariates for individual i, the additive regression model takes the form:
αi(t) = β0(t) + β1(t)Xi1 + ... + βp(t)Xip,
where the βj(t) are arbitrary regression functions. We may interpret β0(j) as a baseline hazard, while βj(t) is the excess risk at t per unit increase of Xij for j = 1,...,p. Estimation is based on the cumulative regression functions
Estimation of the Bj(t) is easily carried out using a least squares procedure [19,20,42].
Xj j hjXh j j p
h j
= + + =
= −
∑
γ0 γ ε
1 1
2 3
; , ,..., ; (1)
B tj( )=
∫
tβj( ) .sdsThe dynamic path model
A dynamic path diagram [20] is a DAG where the vertex set is partitioned into a 'covariate set' Vc = {X1, X2,..., Xp}, here con-sisting of all genes in the network, and an outcome variable, which here is dN(t). We do not allow edges pointing from the outcome to a covariate.
Estimation in the dynamic path model is done by recursive regressions. Within the covariate set Vc(t) we are back to classical path analysis, and each covariate is regressed onto its parents by least squares. The survival outcome is regressed onto its parents in the graph using the additive hazard regression model. Estimation is carried out repeatedly, each time information changes on covariates (if covariates are time dependent), deaths or censorings.
Using the dynamic path modeling framework, total effects can be decomposed into direct and indirect effects. A direct effect is an effect that is transmitted through a single edge in the graph to the outcome, while an indirect effect is working through a path of length greater than one (Figure 7). There may be several indirect effects of a gene on the outcome.
More precisely, the direct and indirect effects of a covariate Xh
on the (survival) outcome dN(t) are defined as follows. Let there be r indirect paths from Xh to dN(t), and denote these by
P1,P2,...,Pr. Let the indirect path Pi be of the form:
where wi is the length of the path. The strength of the indirect effect of Xh on dN(t) is then given by:
where we let ind(Xh → dN(t)) = 0 if r = 0, that is, if there are no indirect paths, and i1 = h. The definition states that the strength of the indirect effect is the sum over all indirect paths of the products of regression coefficients along each path. The strength of the direct effect dir(Xh → dN(t)) on dN(t) is βh(t), so the strength of the total effect is given by the sum of βh(t) and the expression for ind(Xh → dN(t)) above (Figure 7). To quantify the strength of the indirect, direct and total effects,
we simply plug estimated regression functions and
into the formulas above. Since each individual time
point can be rather noisy, we estimate 'cumulative' direct/ indirect effects to improve stability. That is, for ordered event times T1 <T2 < ..., the estimated cumulative indirect effect at time t is:
the estimated direct effect is:
and the total effect is the sum of equations 3 and 4. An exam-ple of an indirect and a direct effect estimated in this manner is plotted in Figure 4, which shows the results from one of the models estimated from the Dutch data set. In our data,
cov-Pi X Xh i Xi Xi Xi N t
wi
={( , ),( , ),...,( , ( ))},
2 2 3 d
ind(Xh dN t( )) i i ( )t ( ),t
l w
i i
r
l l i
wi
→ = ⎛
⎝ ⎜ ⎜⎜
⎞
⎠ ⎟ ⎟⎟
+
= − =
∏
∑
γ 1 β1 1 1
(2)
ˆ ( ) βj t ˆ ( )
γj t
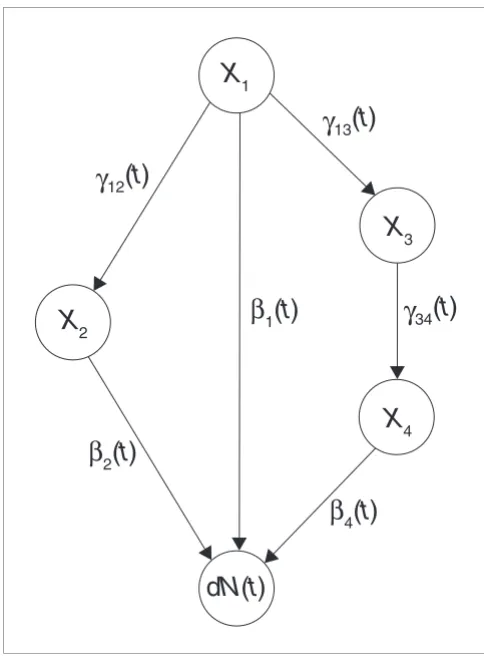
[image:12.612.312.554.84.417.2]The dynamic path model with direct and indirect effects Figure 7
The dynamic path model with direct and indirect effects. This figure shows a dynamic path model with four covariates (genes) X1,X2,X3 and X4
illustrating how the strength of the direct and indirect effect of X1 on
survival dN(t) is calculated. Interactions between the covariates are shown as arrows (edges). Each γij(t) is an ordinary least squares regression coefficient at time t, and each βj(t) is an additive hazard regression
coefficient at time t. The strength of the direct effect of X1 on dN(t) is
given by β1(t). There are two indirect paths from X1 to dN(t): one through X2 and one through X3 and X4. The strength of the indirect effect of X1 on dN(t) is therefore given by γ12(t)β2(t)+γ13(t)γ34(t)β4(t). The strength of the
total effect is the sum of the strength of the direct and indirect effect, that is, β1(t)+γ12(t)β2(t)+γ13(t)γ34(t)β4(t).
X1
X
2X
3d
N
(
t
)
X
4γ
13(
t
)
γ
34(
t
)
γ
12(
t
)
β
1(
t
)
β
4(
t
)
β
2(
t
)
Ind Xh N t i i Tk T
l w
i k
i r
l l i
wi
n( → ( ))= ⎛ ˆ ( ) ˆ ( )
⎝ ⎜ ⎜⎜
⎞
⎠ ⎟ ⎟⎟
+
= − =
∏
∑
γ 1 β1 1 1
T T
∑
k≤t,
(3)
Dir Xh N t h Tk
Tk t
n( → ( ))= ˆ ( ),
≤
ariates were time independent; nevertheless, the regression functions are time dependent, since the patient population at risk changes over time.
Confidence intervals of the estimated effects can be calculated using non-parametric bootstrap [44], sampling randomly from the set of all individuals. We have used 1,000 bootstrap replications in our calculations. The percentile method was used for calculating confidence intervals.
Computation
All computations were carried out using R [45], an open source language and environment for statistical computing and graphics. The additive hazard regression analysis was done using the freely available R package addreg [46]. An R package implementation of our approach is available at [47]. Ordinary linear regression was done using the built-in R func-tion lm. Pathways were generated using Pathway Studio [8].
Abbreviations
ADFP, adipose differentiation-related protein; DAG, directed acyclic graph; DLBCL, diffuse large B-cell lymphoma; PPAR, peroxisome proliferator-activated receptor.
Authors' contributions
EF and AF conceived the methodology and the study, together with HL. EF implemented the method, performed data analysis and produced the results. HL contributed bio-logical expertise. All authors wrote and approved the final manuscript.
Acknowledgements
Egil Ferkingstad was supported by the 'National programme for research in functional genomics in Norway' from the Research Council of Norway. We thank two anonymous referees for helpful comments that have led to an improved paper.
References
1. Bair E, Tibshirani R: Semi-supervised methods to predict patient survival from gene expression data. PLoS Biol 2004, 2:E108.
2. Bullinger L, Döhner K, Bair E, Fröhling S, Schlenk RF, Tibshirani R, Döhner H, Pollack JR: Use of gene-expression profiling to iden-tify prognostic subclasses in adult acute myeloid leukemia. N Engl J Med 2004, 350:1605-1616.
3. Hastie T, Tibshirani R, Botstein D, Brown P: Supervised harvesting of expression trees. Genome Biol 2001, 2:research0003.1-0003.12. 4. Schumacher M, Binder H, Gerds T: Assessment of survival prediction models based on microarray data. Bioinformatics 2007, 23:1768-1774.
5. Bøvelstad H, Nygård S, Størvold H, Aldrin M, Borgan Ø, Frigessi A, Lingjærde OC: Predicting survival from microarray data - a comparative study. Bioinformatics 2007, 23:2080-2087.
6. Margolin AA, Nemenman I, Basso K, Wiggins C, Stolovitzky G, Dalla F, Califano A: ARACNE: an algorithm for the reconstruction of gene regulatory networks in a mammalian cellular context. BMC Bioinformatics 2006, 7(Suppl 1):S7.
7. Tuck DP, Kluger HM, Kluger Y: Characterizing disease states from topological properties of transcriptional regulatory
networks. BMC Bioinformatics 2006, 7:236.
8. Nikitin A, Egorov S, Daraselia N, Mazo I: Pathway studio - the analysis and navigation of molecular networks. Bioinformatics 2003, 19:2155-2157.
9. Chang WC, Li CW, Chen BS: Quantitative inference of dynamic regulatory pathways via microarray data. BMC Bioinformatics 2005, 6:44.
10. Tringe SG, Wagner A, Ruby SW: Enriching for direct regulatory targets in perturbed gene-expression profiles. Genome Biol 2004, 5:R29.
11. Anderson JE, Hansen LL, Mooren FC, Post M, Hug H, Zuse A, Los M: Methods and biomarkers for the diagnosis and prognosis of cancer and other diseases: towards personalized medicine. Drug Resist Updat 2006, 9:198-210.
12. He YD: Genomic approach to biomarker identification and its recent applications. Cancer Biomark 2006, 2:103-133. 13. Macgregor PF: Gene expression in cancer: the application of
microarrays. Expert Rev Mol Diagn 2003, 3:185-200.
14. Shai RM: Microarray tools for deciphering complex diseases. Front Biosci 2006, 11:1414-1424.
15. Slee E, O'Connor D, Lu X: To die or not to die: how does p53 decide? Oncogene 2004, 23:2809-2818.
16. Matsumura I, Tanaka H, Kanakura Y: E2F1 and c-Myc in cell growth and death. Cell Cycle 2003, 2:333-338.
17. Kim R, Tanabe K, Emi M, Uchida Y, Inoue H, Toge T: Inducing cancer cell death by targeting transcription factors. Anticancer Drugs 2003, 14:3-11.
18. Basso K, Margolin AA, Stolovitzky G, Klein U, Dalla-Favera R, Califano A: Reverse engineering of regulatory networks in human B cells. Nat Genet 2005, 37:382-390.
19. Aalen OO: A linear regression model for the analysis of life times. Stat Med 1989, 8:907-925.
20. Fosen J, Ferkingstad E, Borgan Ø, Aalen OO: Dynamic path analy-sis - a new approach to analyzing time-dependent covariates. Lifetime Data Anal 2006, 12:143-167.
21. van de Vijver MJ, He YD, van't Veer LJ, Dai H, Hart AAM, Voskuil DW, Schreiber GJ, Peterse JL, Roberts C, Marton MJ, Parrish M, Atsma D, Witteveen A, Glas A, Delahaye L, van der Velde T, Bartelink H, Rodenhuis S, Rutgers ET, Friend SH, Bernards R: A gene-expres-sion signature as a predictor of survival in breast cancer. N Engl J Med 2002, 347:1999-2009.
22. van Houwelingen HC, Bruinsma T, Hart AA, van't Veer LJ, Wessels LF: Cross-validated Cox regression on microarray gene expression data. Stat Med 2006, 25:3201-3216.
23. Miller LD, Smeds J, George J, Vega VB, Vergara L, Ploner A, Pawitan Y, Hall P, Klaar S, Liu ET, Bergh J: An expression signature for p53 status in human breast cancer predicts mutation status, transcriptional effects, and patient survival. Proc Natl Acad Sci USA 2005, 102:13550-13555.
24. Rosenwald A, Wright G, Chan WC, Connors JM, Campo E, Fisher RI, Gascoyne RD, Muller-Hermelink HK, Smeland EB, Giltnane JM, Hurt EM, Zhao H, Averett L, Yang L, Wilson WH, Jaffe ES, Simon R, Klaus-ner RD, Powell J, Duffey PL, Longo DL, GreiKlaus-ner TC, Weisenburger DD, Sanger WG, Dave BJ, Lynch JC, Vose J, Armitage JO, Montserrat E, López-Guillermo A, et al.: The use of molecular profiling to predict survival after chemotherapy for diffuse large-B-cell lymphoma. N Engl J Med 2002, 346:1937-1947.
25. Ahmed W, Ziouzenkova O, Brown J, Devchand P, Francis S, Kadakia M, Kanda T, Orasanu G, Sharlach M, Zandbergen F, Plutzky J: PPARs and their metabolic modulation: new mechanisms for tran-scriptional regulation? J Intern Med 2007, 262:184-198. 26. DeGregori J, Johnson DG: Distinct and overlapping roles for
E2F family members in transcription, proliferation and apoptosis. Curr Mol Med 2006, 6:739-748.
27. Buitenhuis M, Coffer PJ, Koenderman L: Signal transducer and activator of transcription 5 (STAT5). Int J Biochem Cell Biol 2004, 36:2120-2124.
28. Oster SK, Ho CS, Soucie EL, Penn LZ: The myc oncogene: Mar-velouslY complex. Adv Cancer Res 2002, 84:81-154.
29. Whiteman HJ, Farrell PJ: RUNX expression and function in human B cells. Crit Rev Eukaryot Gene Expr 2006, 16:31-44. 30. Kiec-Wilk B, Dembinska-Kiec A, Olszanecka A, Bodzioch M,
Kawecka-Jaszcz K: The selected pathophysiological aspects of PPARs activation. J Physiol Pharmacol 2005, 56:149-162. 31. Targett-Adams P, McElwee MJ, Ehrenborg E, Gustafsson MC, Palmer
32. Tu AY, Albers JJ: Glucose regulates the transcription of human genes relevant to HDL metabolism: responsive elements for peroxisome proliferator-activated receptor are involved in the regulation of phospholipid transfer protein. Diabetes 2001, 50:1851-1856.
33. Ge H, Cha JY, Gopal H, Harp C, Yu X, Repa JJ, Li C: Differential regulation and properties of angiopoietin-like proteins 3 and 4. J Lipid Res 2005, 46:1484-1490.
34. Claassen GF, Hann SR: Myc-mediated transformation: the repression connection. Oncogene 1999, 18:2925-2933.
35. Durst KL, Hiebert SW: Role of RUNX family members in tran-scriptional repression and gene silencing. Oncogene 2004, 23:4220-4224.
36. Jarrar MH, Baranova A: PPARgamma activation by thiazolidinediones (TZDs) may modulate breast carcinoma outcome: the importance of interplay with TGFbeta signalling. J Cell Mol Med 2007, 11:71-87.
37. Fenner MH, Elstner E: Peroxisome proliferator-activated receptor-gamma ligands for the treatment of breast cancer. Expert Opin Investig Drugs 2005, 14:557-568.
38. Humphreys RC, Hennighausen L: Transforming growth factor alpha and mouse models of human breast cancer. Oncogene 2000, 19:1085-1091.
39. Pützer BM: E2F1 death pathways as targets for cancer therapy. J Cell Mol Med 2007, 11:239-251.
40. Ponzielli R, Katz S, Barsyte-Lovejoy D, Penn LZ: Cancer therapeu-tics: targeting the dark side of Myc. Eur J Cancer 2005, 41:2485-2501.
41. Lauritzen S: Graphical Models. Oxford: Clarendon Press; 1996. 42. Aalen OO: A model for non-parametric regression analysis of
counting processes. Lecture Notes Statistics 1980, 2:1-25. 43. Cox DR: Regression models and life-tables. J R Stat Soc [Ser B]
1972, 34:187-220.
44. Efron B: Censored data and the bootstrap. J Am Stat Assoc 1981, 76:312-319.
45. R Development Core Team: R: A Language and Environment for Statistical Computing. Vienna, Austria: R Foundation for Statistical Computing; 2007.
46. R Package addreg for Additive Hazard Regression Analysis [http://www.med.uio.no/imb/stat/addreg]