Combined modal parameters-based index
for damage identification in a beamlike structure:
theoretical development and verification
M.M. FAYYADH, H. A. RAZAK, Z. ISMAIL
Dep. of Civil Engineering, Faculty of Engineering, University of Malaya, 50603 Kuala Lumpur, Malaysia. A new index for detecting the damage severity in structural elements by combining modal parameters is proposed in this study. The index is based on the combined effect of both the natural frequencies and mode shapes when a change in stiffness of the structural element occurs. In order to demonstrate the significance and capability of this new algorithm, the magnitude of damage was calculated from a finite element model of a beam-like structure model and comparisons with previous algorithms were carried out. The new index called Combined Parameter Index (CPI) compares the factor of reduction in stiffness according to reduction in natural frequencies and also the factor of reduction in stiffness according to change in mode shape. Various damage levels starting from reduction in stiffness of 1% were adopted to validate the sensitivity of the new index to detect the damage severity at various deterioration levels. Mid-span and quarter-span damage positions were adopted to verify the capability of the new damage index to detect the damage severity at various locations. Moreover, damage in support condition was investigated in order to ascertain that the new damage index can also identify support damage cases. The results indicate that the new index has better ability and higher sensitivity to determine the severity of the damage due to stiffness changes in the element or support. In addition, the CPI exhibits sensitivity to detect lower level of damage occurring at earlier stage by having the ability to detect a damage of 1% reduction in the structural element stiffness or elastic bearing stiffness. Keywords: damage detection, frequency reduction index FRI, mode shape reduction index MSRI, modal assurance criteria MAC, combined parameter index CPI, elastic bearing stiffness
1.
Introduction
damage identification methods applied to civil engineering structural elements provide for the first two levels of damage identification with sufficient degree of reliability.
The basic idea behind this approach is that modal parameters i.e. natural frequency, mode shape and modal damping are functions of physical properties of structures namely mass, damping and stiffness. Therefore, any change in the physical properties will cause detectable changes in the modal parameters. Since the measuring of natural frequency is easier than that of change in structural damping, change can be detected from dynamic analysis using natural frequency and mode shapes. However, there is some debate on whether the use of modal parameters is significant enough to be a good indicator of damage or deterioration. From previous studies, it is observed that the effect on natural frequency when damage occurs in a structure is often of relatively low sensitivity. The low sensitivity of frequency shifts to damage requires either very precise measurements or large levels of damage. The alternative to using natural frequency as damage identification is by using mode shape, with the use of Modal Assurance Criteria MAC to determine the level of correlation between modes from the control beam and those from the damaged beam.
sensors with the aim of locating damage for low cost on components that are subject to impact during service, [18]. An innovative health monitoring methodology based on structural strain measurement was proposed; the measurements were then processed by a back-propagation, feed forward, artificial neural network. The proposed methodology, demonstrated on a cracked aircraft lap-joint structure to evaluate its capability and drawbacks in predicting fatigue damaged states, had good capability to predict accurately the crack position and the length of a lap-joint structure, [12].
The effects of input and output noise on the estimation of transfer entropy were evaluated. The study found that input noise lessens the sensitivity of the damage feature by diminishing the ability of the non-parametric density estimation to produce low variance transfer entropy estimation. The study also concluded that output noise had an effect on the feature’s sensitivity, [19]. A new proposal for a hybrid health monitoring system was offered, using sequential vibration impedance approaches, to detect damage in pre-stress concrete bridge girders, [13]. Several vibration-based statistical time series were applied as structural health monitoring methods on lightweight aluminium truss structures, [14]. An autoregressive model used the acceleration time histories obtained from two experimental structures in the literature, [15]. The coefficients of the autoregressive model became the damage-sensitive features and acted as input into an artificial neural network. A method for detecting damage in structures without baseline state information was proposed, [22]. The study found that it is possible to identify the location and severity of damage based on singular value decomposition. A wavelet-based method, which not only localized multiple damage sites but also provided information on when the damage occurred was proposed, [27]. Lower modes are found to have higher sensitivity to the change in the support conditions, [7–9]. An analytical model for detecting cracks in a cantilever beam using the modal parameters i.e. natural frequencies and mode shapes, was developed, [11] and found that both modal parameters are affected by the crack regardless of its position or size. A new damage detection index based on combined mode shape vectors and its curvature was developed and it was verified to have higher sensitivity than existing algorithms, [8].
From all the previous studies, it can be concluded that the natural frequency relates well to the global stiffness of structures but is less sensitive to local stiffness change. On the other hand, the use of mode shape and its derivatives, in relation to changes in the local stiffness of structures has been more promising for ascertaining damage location. Thus, the objective of this study is to develop a Health Monitoring Index HMI for detecting damage severity by combining both natural frequency and mode shape through the use of eigenvalue and eigenvectors. In addition, the results obtained by using the proposed HMI will be compared with other indicators.
2.
Theoretical development
called Combined Parameters Index (or CPI), is the stiffness percentage ratio of the damaged case to the control case. CPI eliminates all the positive values of this ratio and will average out the negative values for each mode. In addition, this section will summarize and revise two other indicators found in literature that will be used for comparison to CPI. The first indicator is the Frequency Reduction Index (FRI) which is based on the reduction of natural frequency to locate damage; the second is the Mode Shape Reduction Factor (MSRI) which uses the changes in mode shape through Modal Assurance Criteria MAC.
2.1. Developed index: Combined Parameters Index (CPI)
The free vibration dynamic equilibrium equation can be expressed as:
Mq(t) + Kq(t) = 0, (1)
where:
K – the stiffness matrix,
M – the analytical mass matrix.
The computation of eigenvalue and eigenvectors for Equation (1) can be found in many references, [6, 10–17]. The solution to Equation (1) will have the form:
q(t) = me t, (2)
where = ± im, taking = + im and i2 = –1 gives:
q(t) = – m2meiZmt. (3)
Substituting Equations 2 and 3 into Equation 1, and rearranged will lead to the Eigenvalue problem:
(K – m2M)m = 0. (4)
Equation 4 can be re-written as:
Km = m2Mm. (5)
Taking = – im gives the same solution as in Equations 4 and 5.
The Eigenvalue problem has m = 1...n solutions
>
Zpm@
n2and)pm, and each solution satisfies Equation (5). Taking into account a solutions corresponding to the first a natural modes (Eigenvectors), Equation (5) can be re-written in compact form as:or
>
)1,...,)a@
M>
)1,...,)a@
diagZ12,...,Za2,K
where:
a – the mode number,
K = []axa – the stiffness matrix,
M = []axa – the mass matrix,
= [###]nxa – the Eigenvector matrix,
A = [%]axa – the Eigenvalue matrix.
For the purpose of this study, the number of solutions and thus of the Eigenvalues must be taken equal to the number of the degrees of freedom and thus of Eigenvectors; one Eigenvalue thus means one Eigenvector and n Eigenvalues implies n Eigenvectors.
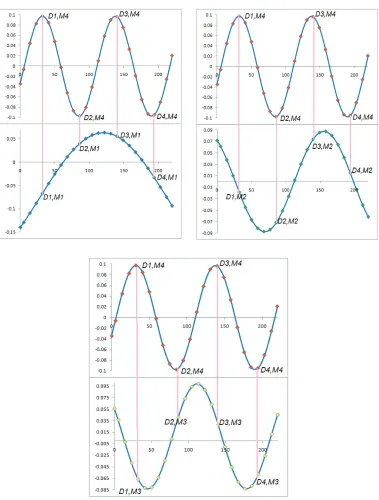
The Eigenvector indicator matrix * = [###]axa is built by using the peak values of the measured modal displacement for the particular mode number a; for mode numbers less than a, the values that correspond to the peak value location of mode number a are utilized. Figure 1 shows how to fill up the cells of the * matrix if four modes are adopted, where it shows the selection of the degree of freedoms D1 to D4 as the peak values on the fourth mode shape (M4) and utilizing the same points D1–D4 on Modes 1, 2 and 3 (M1, M2 and M3). The first column in the * matrix will be filled up with the values of D1 at cell (1, 1) to D4 at cell (4, 1) from first Mode (M1), and the same way for the rest of the columns until the fourth column, which would be filled up with values of D1 to D4 in cells (1, 4) to cell (4, 4) from the fourth mode (M4). The Eigenvalue indicator matrix A* = [%]axa contains the measured Eigenvalues for each mode until mode number a in the diagonal.
Based on Eigenvector indicator matrix * and eigenvalue indicator matrix A*, Equation 6 can be re-written as
K** = M* *A*, (9)
where K* and M* are stiffness and mass indicator matrices.
Based on the assumption made for the purpose of this study by taking the number of the Eigenvalues equal to the number of the eigenvectors, the indicator matrix *
is a square matrix and thus its inverse can exist. Equation (9) can be further reduced into:
K* = M* *A*(*)–1 (10)
For comparison of stiffness indicator matrices of both the undamaged (control) and damaged cases, considering that there is no reduction in mass for the damaged case, the matrix M* remains constant for both control and damaged beams. Equation (10) can be re-written as:
, 1 * * * c c c
c A
K* (11)
, 1 * * * d d d
d A
K* (12)
where indices c and d represent control and damaged cases, respectively.
Subsequently, the Combined Parameters Index matrix, CPI = []axa, at each cell of the matrix is defined by
, , , 1 ) , CPI( * * ¸¸¹ · ¨¨© § j i K j i K j i c d (13)
The CPI will be calculated at each cell of the CPI(i, j) matrix, and then the average of the (a × a) cell values will be found to obtain one single value as shown in Equation (14) below:
, , CPI CPI , , 1 a a j i ii ajjaa
u (14)
where:
CPI – the single value for the matrix CPI(i, j), i – the number of the eigenvalue,
j – the number of the eigenvector,
2.2. Index based on Natural Frequency
The natural frequency, f, for transverse free vibration of a simply supported Bernoulli-Euler beam with similar dimensions, [3, 4, 24], is given by:
, 2 4 2 mL El n f (15) where:
n – mode number, m – mass per unit length,
L – span length. The natural frequency is proportional to the square root of its flexural rigidity, EI,
, El
f v (16)
which implies that a change in flexural rigidity will contribute to the change in natural frequency. The Frequency Reduction Index (FRI) can be defined as:
%, 100 1 , , ¸ ¸ ¹ · ¨ ¨ © § c i d i f f FRI (17)
where fi,c and fi,d are the natural frequency ati-th mode for control and damaged beams,
respectively.
2.3. Index based on mode shape
The method used to ascertain configuration errors between experimental mode shapes and eigenvectors predicted from the finite element model is called modal assurance criterion (MAC), [6]. For the purpose of the damage detection and in case of available data at the undamaged case of the structure (control case), the MAC is a correlation between mode shapes of damaged and undamaged cases as given by the following formula: , ) )( ( MAC
1 , , 1 , ,
2
1 , ,
¦
¦
¦
ni ic ic
n
i ic ic
n
i ic id
M M M M M M (18)
where Mi,c and Mi,d are the mode shape vectors ati-th mode for control c and damaged
Utilizing the concept in the previous paragraph, Mode Shape Reduction Index (MSRI) which is an indicator that utilizes only the mode shapes, is defined by the following formula:
%. 100 ) MAC 1
(
MSRI (19)
3.
Case study
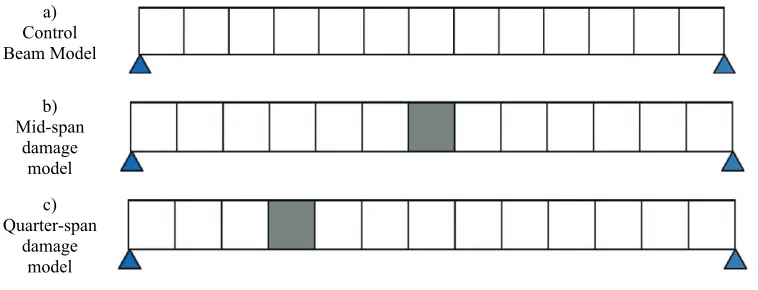
To demonstrate the significance and capability of the proposed index, one finite-element beamlike structure model was built to represent control and damaged cases. The span length of the beam was 3250 mm with a cross-sectional area of 150 mm by 250 mm. The sensitivity level of the new index attempted to detect different damage levels and locations. It also attempted to detect deterioration in elastic-bearing stiffness for cases of bridge girders. Since the dynamic parameters are related to the stiffness of the structural element, the damage is presented by reducing the modules of elasticity E values. The Stiffness Reduction Ratio (SRR) was adopted as denotation for the damage level and can be calculated as:
SRR = (1 – Ed/Ec). 100%, (20)
where:
Ed – the modulus of elasticity value for the damage cases, Ec – the modulus of elasticity for the control case.
[image:9.482.50.365.506.598.2]Four levels of stiffness were adopted as the control where E is 200 GPa, and the SRR was 0%: the first damage level is the smallest level where the SRR was 1% (E is 198 GPa), the second damage level is the medium level where the SRR was 5% (E is 190 GPa) and the third damage level is the higher level where the SRR was 12.5% (E is 175 GPa). The same levels were examined for different damage locations; the first damage was located at the mid-span and the second damage was located at the quarter-span. A total of six cases for different SRR levels and different damage locations were adopted. Table 1 shows the SRR adopted in the present study. Figure 2 shows the beamlike structure model for the control beam, mid-span damage, and quarter-span damage.
Table 1. Damage cases adopted in present study
Stiffness Damage Cases Stiffness Reduction Ratio SRR Damage Location
Control C 0% N/A
SD1 1% Mid-Span
SD2 5% Mid-Span
SD3 12.5% Mid-Span
SD4 1% Quarter-Span
SD5 5% Quarter-Span
a) Control Beam Model
b) Mid-span
damage model
c) Quarter-span
[image:10.482.49.428.81.226.2]damage model
Fig. 2. Beam like structure model used in present study
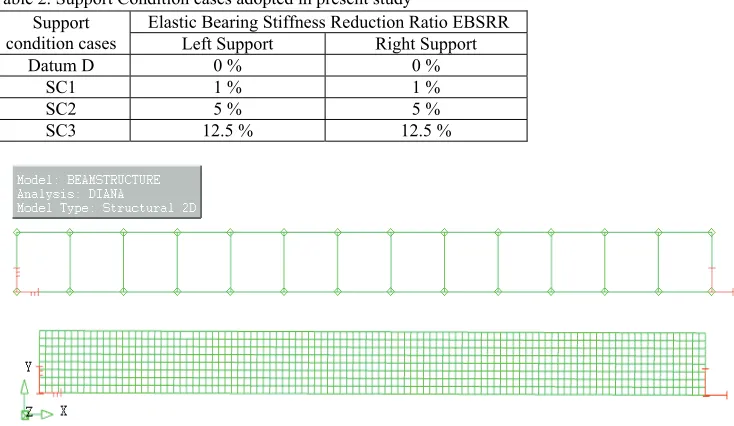
For support stiffness in cases when elastic bearing was used, four cases were adopted: the control case, when both supports are fixed on elastic bearing with stiffness K of 50000 N/mm; the first damage case where there was 1% deterioration in elastic-bearing stiffness; the second damage case where there was 5% deterioration in elastic bearing stiffness; and the third damage case where there was deterioration of 12.5% in elastic-bearing stiffness. Elastic Bearing Stiffness Reduction Ratio (EBSRR) was adopted to indicate the elastic-bearing stiffness case where:
EBSRR = (1 – Kd/Kc). 100%, (21)
where:
Kd – the elastic bearing stiffness for the damage cases, Kc – the elastic bearing stiffness for the control case.
Table 2 shows the EBSRR adopted in the present study. Utilizing a general-purpose finite-element package that is based on the displacement method, one two-dimensional finite-element model was constructed to represent the beamlike structure model. The beam model was built by using a 4-node plane stress element. Figure 3 shows a typical model for the beam constructed using software. The physical and material properties of the beam were Poisson’s ratio of 0.2, mass density of 7850 kg /m3 and Young’s modulus of 200 GPa for the control case. These vary from one damage case to another. The self-weight was computed by taking gravitational acceleration as 9.81 m/s2 in the –y direction.
relevant to the damage case induced. Finally, the indices FRI, MSRI, and CPI were calculated for the first four bending modes.
Table 2. Support Condition cases adopted in present study
Elastic Bearing Stiffness Reduction Ratio EBSRR Support
condition cases Left Support Right Support
Datum D 0 % 0 %
SC1 1 % 1 %
SC2 5 % 5 %
SC3 12.5 % 12.5 %
Fig. 3. Finite Element modelling for the beam like structure model
4.
Results and discussion
This section will present the results from the analytical modelling of the beamlike structure used in the present study. First, the dynamic parameters as natural frequencies and mode shapes were carried out using Eigen analysis. Then, the damage detection indices FRI, MSRI, and CPI were calculated. Results were divided into two sections: Structural Element Stiffness Reduction Damage, when the value of the modules of elasticity have changed at the mid-span and quarter-span, and elastic-bearing stiffness reduction damage, when the support conditions have been changed from fixed to hinged at one or both of the support sides.
4.1. Structural element stiffness reduction damage
Fig. 4. FRI index values for different damage levels located at mid-span
Fig. 5. FRI index values for different damage levels located at quarter-span
[image:12.482.118.364.441.580.2]Fig. 7. MSRI index values for different damage levels located at quarter-span
FRI results showed that the first and the third modes are the most sensitive to detect damage severity when the damage was located at mid-span, while modes two and three were the most sensitive when the damage was located at the quarter-span. The higher FRI values for all the modes were at the highest damage level at SRR 12.5% for both damage locations. First mode showed the highest value for damage located at mid-span, while mode two had the highest value when the damage was located at the quarter-span. Figures 6 and 7 show graphically the comparison of MSRI at different damage levels for damage located at mid-span and quarter-span respectively.
[image:13.482.125.364.435.583.2]MSRI values had lower sensitivity than FRI, where the higher MSRI value was 0.05% at the third mode when the SRR was 12.5% for damage located at quarter-span. However, modes 3 and 4 had higher sensitivity than the first two modes. Figures 8 and 9 show graphically the comparison of CPI at different damage levels for damage located at mid-span and quarter-span, respectively.
Fig. 9. CPI index values for different damage levels located at quarter-span
The new damage detection index, CPI, had more sensitivity then both indices, where the higher CPI value was 3.9% at the SRR and 12.5% for damage located at quarter-span. In addition, all the four modes show good sensitivity in detecting the damage, with increasing values corresponding to increase in the stiffness-reduction ratio. Moreover, the fourth mode was the most sensitive. The CPI results display unexpected behaviour, with modes two and four (antisymmetric modes) able to detect the damage located at the mid-span, as opposed to FRI and MSRI which show less sensitivity. This is because the values of FRI and MSRI for these antisymmetric modes rely on each mode separately, and due to the antisymmetric shape, less sensitivity was observed. The CPI values at the antisymmetric modes also rely on the odd modes (first and third modes) as discussed in the construction of the Eigenvalue and Eigenvector matrixes in Equations 9 and 10 and Figure 1. For the second mode, the CPI will take into consideration the eigenvector and eigenvalue for the first modes, and for the fourth mode it will take into consideration the eigenvalues and eigenvectors of the first, second and third modes. This helps to improve the sensitivity of the antisymmetric modes to detect the damage located at mid-span.
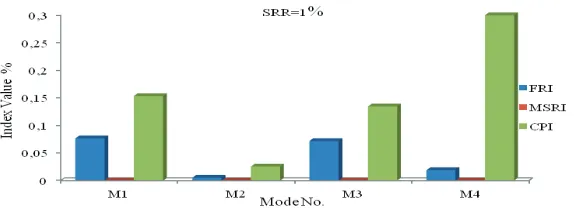
The results show that the sensitivity of the indices for all the modes increased corresponding to the increase in the damage level. In order to compare the sensitivity for existing and developed damage severity indexes at different damage location each damage level separately, Figures 10 and 11 show the comparison of the indices for the SRR of 1% and damage located at mid-span and quarter-span, respectively.
The results show that the CPI had more sensitivity than the FRI and MSRI, and it increased the sensitivity for both damage locations. The result of the smallest damage level validates the CPI as a sensitive index that can detect damage even with small levels, whether at mid-span or quarter-span. The results show that CPI has higher sensitivity when the damage is located elsewhere than at mid-span.
Fig. 10. CPI comparisons with FRI & MSRI for damage located at mid-span
Fig. 11. CPI comparisons with FRI & MSRI for damage located at quarter-span
Fig. 12. CPI comparisons with FRI & MSRI for damage at mid-span
[image:15.482.99.388.336.447.2] [image:15.482.84.407.480.580.2]The results prove the higher sensitivity of the CPI compared to the FRI and MSRI. They also show that CPI sensitivity increases when the damage is located elsewhere than mid-span.
Figures 14 and 15 show the index comparisons for the SRR of 12.5% and damage located at mid-span and quarter-span, respectively.
The results prove the higher sensitivity of the CPI compared to the other indices. The results show that the CPI sensitivity increases for the damage cases when it is located elsewhere than mid-span.
[image:16.482.76.404.273.383.2]The results prove that for the FRI, the first mode was the most sensitive when the damage was located at mid-span and the second mode was the most sensitive when it was located at quarter-span. For the MSRI, the third mode was the most sensitive wherever the damage, while for the CPI, the fourth mode had the highest sensitivity, wherever the damage. The results show that for all the damage levels, all the available modes, and all damage locations, the CPI increased the sensitivity of the FRI and MSRI by at least twice.
[image:16.482.74.404.278.532.2]Fig. 14. CPI comparisons with FRI & MSRI for damage at mid-span
Fig. 15. CPI comparisons with FRI & MSRI for damage at quarter-span
The results prove that for the FRI, the first mode was the most sensitive when the damage was located at mid-span and the second mode was the most sensitive when it was located at quarter-span. For the MSRI, the third mode was the most sensitive wherever the damage, while for the CPI, the fourth mode had the highest sensitivity, wherever the damage. The results show that for all the damage levels, all the available modes, and all damage locations, the CPI increased the sensitivity of the FRI and MSRI by at least twice.
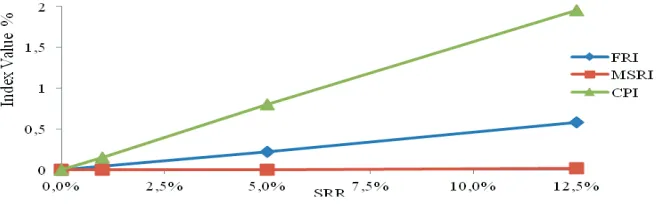
[image:17.482.79.410.368.470.2]The average percentage values for mode 1 to mode 4 of the three indices were calculated based on algebraic averaging of the index values for the four modes. Figures 16 and 17 show the graph versus the percentages of the SRR for damage located at mid-span and quarter-span, respectively.
Fig. 16. Indices average values corresponding to damage ratios for damage located at mid-span
mid-span and quarter-mid-span, respectively. The averaging results validate the CPI as the higher sensitivity index compared to FRI and MSRI and prove its capability to detect damage located at mid-span and quarter-span.
4.2. Elastic bearing stiffness reduction damage
[image:18.482.133.348.204.330.2]This section will present the results from the calculation of the FRI, MSRI, and CPI for the first four modes of the control beam model and two support stiffness deterioration levels. Figures 18–20 show the comparison of FRI, MSRI and CPI, respectively, at different values of elastic-bearing stiffness.
Fig. 18. FRI index values for different elastic bearing damage levels
Fig. 19. MSRI index values for different elastic bearing damage levels
[image:18.482.120.359.365.507.2]Fig. 20. CPI index values for different elastic bearing damage levels
The results show that for the FRI, mode one was the most sensitive. For the MSRI, modes one and four had good sensitivity compared to the other modes; however, it still had a very small amount of sensitivity. The CPI had a higher sensitivity for all modes, and mode three was the most sensitive. The sensitivity of all indices increased corresponding to the increase in the support stiffness deterioration level.
Figures 21–23 show the indices results at EBSRR of 1%, 5% and 12.5%, respectively. The results showed that the CPI had higher sensitivity than FRI and MSRI. Mode three was the most sensitive mode for the CPI index. CPI increased sensitivity by at least 20 times even for the smallest support stiffness deterioration level.
The average percentage values for mode 1 to mode 4 of the three indices were calculated based on algebraic averaging of the index values for the four modes. Figure 24 shows the average values corresponding to the elastic bearing stiffness reduction ratio.
[image:19.482.71.376.452.572.2]The results showed that the MSRI was the least sensitive for all elastic-bearing damage levels and CPI the most sensitive to any change in stiffness. The CPI increased sensitivity by 27, 31 and 33 times when the EBSRR was 1%, 5% and 12.5%, respectively. The averaging results for all considered modes validate the CPI as a higher sensitivity index and prove its capability to detect support damage even with small levels.
[image:20.482.82.399.158.272.2]Fig. 22. CPI comparisons with FRI & MSRI for EBSRR of 5%
Fig. 23. CPI comparisons with FRI & MSRI for EBSRR of 12.5%
[image:20.482.84.403.469.586.2]5.
Conclusions
The following conclusions can be drawn based on the results from the present study.
x The new damage detection index CPI has higher sensitivity than the existing indices even for a small damage ratio of 1%, which is an increase in the sensitivity by at least 3.2 times.
x The results validate the CPI’s capability to detect the damage and to have higher sensitivity for both damage locations, at mid-span and at quarter-span.
x The calculation method of CPI helped to improve the sensitivity of the antisymmetric modes in detecting damage located at the mid-span, in comparison to the FRI and MSRI.
x The CPI’s sensitivity will be higher when the damage is located elsewhere than mid-span.
x The CPI increased sensitivity much more than the other indices in the case of deterioration in elastic bearing, with a 27 times increase in sensitivity.
x CPI is more sensitive in the case of elastic-bearing deterioration than for the cases of the structural-element stiffness.
Acknowledgements
The authors would like to acknowledge the financial assistance provided by University of Malaya through a research grant entitled “Development of Algorithms for Structural Health Monitoring using Modal Parameters” (RG090/10AET). The authors would also like to thank all the people who have contributed either directly and indirectly, in making this research possible.
References
[1] Abdul Razak H., Choi F.C.: The effect of corrosion on the natural frequency and modal damping of reinforced concrete beams, Journal of Engineering Structures, Vol. 23, 2001, pp. 1126–1133.
[2] Catbas F.N., Gul M., Burkett J.L.: Conceptual damage-sensitive features for structural health monitoring: laboratory and field demonstrations, Mechanical Systems and Signal Processing, Vol. 22, No. 7, 2008, pp. 1650–1669.
[3] Chopra A.K.: Dynamics of structures: theory and applications to earthquake engineering, New Jersey, Prentice Hall, 1995.
[4] Craig Jr. R.R.: Structural dynamics: an introduction to computer methods, New York, John Wiley & Sons, 1981.
[5] Deraemaeker A., Reynders E., De Roeck G., Kullaa J.: Vibration-based structural health monitoring using output-only measurements under changing environment, Mechanical Systems and Signal Processing, Vol. 22, No. 1, 2008, pp. 34–56.
[7] Fayyadh M.M., Abdul Razak H., Khalil R.O.: The effect of the differential difference in support condition on the dynamic parameters, Proceeding of the Twelfth East Asia Pacific Conference on Structural Engineering & Construction, Hong Kong, China, 2011.
[8] Fayyadh M.M., Abdul Razak H.: Stiffness reduction index for detection of damage location: analytical study, International Journal of the Physical Sciences, Vol. 6, No. 9, 2011, pp. 2194–2204.
[9] Fayyadh M.M., Abdul Razak H.: The effect of support condition on dynamic parameters, Proceeding of the 17th International Congress on Sound and Vibration, Cairo, Egypt, 2010. [10] Heylen W., Lammens S., Sas P.: Modal analysis theory and testing, Katholieke
Universiteit Leuven, Belgium, 1999.
[11] Jassim Z., Fayyadh M.M., Mustapha F.: Health monitoring of cantilever rod using vibration test theoretical and numerical study, Proceeding of the 17th International Congress on Sound and Vibration, Cairo, Egypt, 2010.
[12] Katsikeros C.E., Labeas G.N.: Development and validation of a strain-based structural health monitoring system, Mechanical Systems and Signal Processing, Vol. 23, No. 2, 2009, pp. 372–383.
[13] Kim J.T., Park J.H., Hong D.S., Park W.S.: Hybrid health monitoring of prestressed concrete girder bridges by sequential vibration-impedance approaches, Engineering Structures, Vol. 32, No. 1, 2010, pp. 115–128.
[14] Kopsaftopoulos F.P., Fassois S.D.: Vibration based health monitoring for a lightweight truss structure: experimental assessment of several statistical time series methods, Mechanical Systems and Signal Processing, Vol. 24, No. 7, 2010, pp. 1977–1997.
[15] Lautour O.R. De, Omenzetter P.: Damage classification and estimation in experimental structures using time series analysis and pattern recognition, Mechanical Systems and Signal Processing, Vol. 24, No. 5, 2010, pp. 1556–1569.
[16] Lee Y.S., Chung M.J.: A study on crack detection using eigen frequency test data, Journal of Computers and Structures, Vol. 77, 2000, pp. 327–342.
[17] Maia N.M.M., Silva E., Julio M.: Theoretical and experimental modal analysis, New York, Research Studies Press Ltd. and John Wiley & Sons Inc, 1997.
[18] Montalvão D., Ribeiro A.M.R., Duarte-Silva J.: A method for the localization of damage in a CFRP plate using damping, Mechanical Systems and Signal Processing, Vol. 23, No. 6, 2009, pp. 1846–1854.
[19] Overbey L.A., Todd M.D.: Effects of noise on transfer entropy estimation for damage detection, Mechanical Systems and Signal Processing, Vol. 23, No. 7, 2009, pp. 2178–2191. [20] Ricardo P., Consuelo H., Juan M.O.: Identification of damage in RC beams using index
based on local modal stiffness, Journal of Construction and Building, Vol. 22, No. 8, 2008, pp. 1656–1667.
[21] Rizos P.F., Aspragathos N., Dimarogonas A.D.: Identification of crack location and magnitude in a cantilever from the vibration modes, Journal of Sound and Vibration, Vol. 138, No. 3, 1990, pp. 381–388.
[22] Rodríguez R., Escobar J.A., Gómez R.: Damage detection in instrumented structures without baseline modal parameter, Engineering Structures, Vol. 32, No. 6, 2010, pp. 1715– 1722.
[24] Timoshenko S., Young D.H., Weaver Jr. W.: Vibration problems in engineering, Fourth Edition, New York, John Wiley & Sons, 1974.
[25] Todorovska M.I., Trifunac M.D.: Earthquake damage detection in the Imperial County Services Building III: analysis of wave travel times via impulse response functions, Soil Dynamics and Earthquake Engineering, Vol. 28, No. 5, 2008, pp. 387– 404.
[26] Wang J., Qiao P.: On irregularity-based damage detection method for cracked beams, International Journal of Solids and Structures, Vol. 45, No. 2, 2008, pp. 688–704.
[27] Yan G., Duan Z., Ou J., De Stefano A.: Structural damage detection using residual forces based on wavelet transform, Mechanical Systems and Signal Processing, Vol. 24, No. 1, 2010, pp. 224–239.
czny parametr modalny jako indeks identyfikacji zniszczenia
konstrukcji belkowych: podstawy teoretyczne i weryfikacja numeryczna