International Journal of Emerging Technology and Advanced Engineering
Website: www.ijetae.com (ISSN 2250-2459, ISO 9001:2008 Certified Journal, Volume 5, Issue 5, May 2015)
Multiple Distributed Generators Placement for Enhancement of
Voltage stability and Minimizing Energy Loss at Minimum Cost
in RDNs
Prof. Dr. Ahmed R. Abul'Wafa
1, Bahaa Saad Mahmoud
2, Dr. Aboul’Fotouh El’Garably
3 1Electric Power and Machines Dept. Ain Shams University, Cairo, Egypt2,3Electric Power and Machines Dept. El’Shorouk Academy, Cairo, Egypt
Abstract—This paper uses improved analytical expressions (IA) for multiple DGs placement in radial distribution network (RDNs) to achieve a high loss reduction and improvement of voltage profile of the system. The paper proposes a method combining (IA), a Voltage Stability Index (Lj) and economic analysis to reach the final (DG) placement. A Fast Approach technique for obtaining the optimal power factor for DG which is capable of delivering both real and reactive power.
Keywords—Analytical Expressions, loss reduction, Voltage Stability analysis, Cost benefit factor, optimal DGs placement, optimal power factor, radial distribution network.
I. INTRODUCTION
Nowadays power systems have to operate closer to their stability limits due to the growth in the load demand. Economic and environmental considerations are the reasons for few transmission networks lines to be constructed. The liberalization of electricity supply industry deregulation is the main reason for the rapid increasing of the Distributed Generators (DG’s) penetration into the distribution systems. (DGs) are generally defined as the generating plants serving a customer on-site or providing support to a distribution network, connected to the grid at distribution level voltages [1]. Distribution networks those with (DGs) are referred as active networks while those without (DGs) are referred as passive networks [2]. The (DG) technology could be traditional or non-traditional technology, the traditional combustion generator such as diesel reciprocating generator and natural gas-turbine, and non-traditional generator including fuel cell, storage device and renewable energy source such as solar, photovoltaic, wind, geothermal, ocean, and fuel cell [3]. The main advantages of using renewable energy based (DG) sources is to eliminate the harmful emissions and the main disadvantages are relative low efficiency and high costs [4].
Improper allocation or sizing of (DG) unit may cause voltage rise due to increase the real power flow back to grid or causes voltage to fall due to increase the reactive power flow into feeder [5], so the problem of (DG) planning has recently received much attention by power system researchers so as to garner maximum benefit from (DG) allocation in (RDNs). In [6] Pavlos S. Georgilakis and Nikos D. Hatziargyriou investigates the Optimal (DG) placement in power distribution networks, models, methods, and future research. Some of the analytical methods for (DG) allocation in (RDNs) proposed in [6] are titled below.
In [7] two analytical methods one is applicable to allocation single (DG) with fixed size in (RDN) and the second one is applicable to meshed power systems. An analytical method, based on the exact loss formula, is proposed to allocate a single (DG) in (RDN) [8]. In [9] an analytical method using a loss sensitivity factor is developed to allocate a single (DG) in (RDN). In [10] an analytical method is proposed for finding the optimal locations of multiple DG units and using the Kalman Filter algorithm for determining their optimal size. Analytical expressions for finding optimal size and power factor of different types of (DGs) are suggested in [11]. An analytical method described in [12] computes the optimal location and size of multiple (DGs), considering also different types of (DGs).
This paper proposes an extended methodology for multiple (DG) placement in (RDNs) based on (IA) expressions, Cost Benefit Factor (CBF) and stability index to achieve both maximum loss reduction,
voltage stability enhancement and minimum cost. It assumes a 100% (DG) penetration. All calculations are carried out at the optimum power factor. Bus bar voltage limit is ( ). The size of (DG) units not
exceed the summation of combined load and the system
International Journal of Emerging Technology and Advanced Engineering
Website: www.ijetae.com (ISSN 2250-2459, ISO 9001:2008 Certified Journal, Volume 5, Issue 5, May 2015)
II. IMPROVED ANALYTICAL (IA)EXPRESSIONS
A. Power Losses
The total real power loss in a power system is represented by an exact loss formula [13].
(1)
and
(2)
Where
Complex Voltage at bus .
Real elements of [ ] impedance matrix where
.
Active power injections at bus and bus respectively.
Reactive power injections at bus and bus respectively.
Number of Busses.
The exact loss formula Eq. (1) is differentiated with respect to the injected power (Pi) at bus and equalizing the result to zero for obtaining the size of (DG) which will be placed at bus for achieving maximum loss reduction.
(3)
(4)
Where
The real power injection from DG placed at bus- bar.
The load demand at bus bar.
Based on Eq. (1, 2, 3 and 4), the general (IA) Expressions (5) and (6) are obtained to be used for obtaining the optimum size of (DG) unit that will achieve maximum loss reduction in (RDNs).
(5)
(6)
Where
, (+) for (DG) injecting and (-) for (DG) absorbing the reactive power respectively.
B. IA Expressions According to Different DGs Types suggested in [14]
Type 1 (DG), is capable of injecting both real and reactive power, the optimal size of (DG) at each bus i for maximizing loss reduction can be given by (5) and (6) and the sign of will equal (+1). Type 2 (DG), is capable of injecting real power but consuming reactive power but the sign of will equal (-1). Type 3 (DG), is capable of injecting real power only (unity P.F).
(7)
Type 4 (DG), is capable of delivering reactive power only. The optimal size of (DG) at each bus i for the minimum loss is given by.
(8)
The exact loss equation is a function of loss coefficients α and . After (DG) placement the voltages magnitude and angles of all busses in the system will be changed, consequently the values of α and coefficients will be changed. However numerical results showed that accuracy gained in sizing (DG) by updating α and ß is small and negligible. Therefore it is not necessary to carry out further load flow calculation to update the values of the loss coefficients in the process of adjusting the sizes of the (DG) units [15]. That will save the time in (DGs) placement methodology. The optimum power factor ( ) of units (Type 1, 2) for minimizing total loss is equal to that of the combined load ( ). That can be expressed as.
(9)
(10)
Where
International Journal of Emerging Technology and Advanced Engineering
Website: www.ijetae.com (ISSN 2250-2459, ISO 9001:2008 Certified Journal, Volume 5, Issue 5, May 2015)
III. VOLTAGE STABILITY INDEX
The voltage stability Lj index is a quantitative measure for estimating the voltage stability margin of the system. This index is developed by Kessel and Glavitch [16], the value of indicator Lj is between 0 (no load) and 1 (voltage collapse). The lower value of the indicator means larger voltage stability margin. The calculation of this index is based on the load flow output data.
To obtain the value of Lj indicator, the hybrid parameters of the (RDN) is obtained by a partial inversion of bus admittance matrix ( ), where the voltages at the load buses are exchanged against their currents is built as follows.
Where
are the voltage and current vectors at the load buses, are the voltage and current vectors at the generator buses including slack bus and are the sub-matrices of the hybrid matrix.
The voltage stability indicator at load bus j can then
be calculated using Eq. (11).
(11)
Where
the ji-th element of sub-H matrix .
, are voltages vectors at bus i and bus j.
the representative of an equivalent generator
comprising the contribution from all generators.
The indicator of the voltage stability for the system.
(12)
IV. METHODOLOGY OF DGPLACEMENT
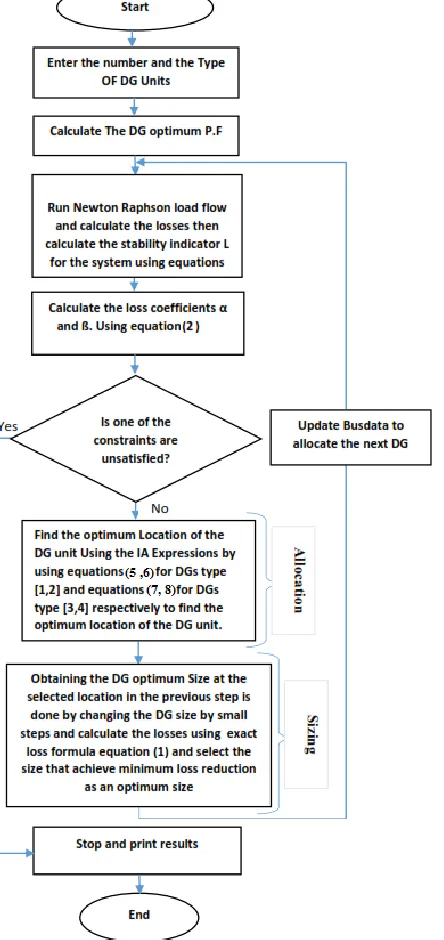
The computational procedure to allocate multiple (DG) units on the basis of the (IA) expressions and the L-indicator is described in flow chart of Fig.1 and detailed as follows.
Step 1 Enter the number and type of (DG) units to be allocated in the (RDN) system.
Step 2 Run Newton Raphson load flow to find losses
then calculate the stability index of the
system using Eq. (12).
Step 3 Calculate the optimum power factor of DG using Eq. (9).
Step 4 Calculate the loss coefficients and ß using Eq. (2). Calculate the optimal size of (DG) at each bus by selecting one of the (IA) expressions (5, 6) for type (1, 2) and (7, 8) for type (3, 4) as shown in Table 1.
Step 5 Find the optimal location of (DG) as follows.
International Journal of Emerging Technology and Advanced Engineering
[image:4.612.69.291.149.619.2]Website: www.ijetae.com (ISSN 2250-2459, ISO 9001:2008 Certified Journal, Volume 5, Issue 5, May 2015)
Fig. 1 Flow Chart of DG Placement Technique
Step 6 Adjustment of the optimal (DG) size as follows:
Perturb the size of the (DG) unit at optimum location obtained in step (5), by small step and calculate the losses for each changing step by using the exact loss formula Eq. (1). Select the size that gives the maximum loss reduction as an optimum size and store this (DG) size. In this step the updating of loss coefficients and ß
after changing (DG) size by small steps is not required because the accuracy gained by updating α and ß is small and negligible.
Step 7 Place the (DG) unit at the optimum location obtained in step (5) with optimal size obtained in step (6) then update the load data and run the load flow, calculate the losses using the load flow loss equation then calculate the new loss coefficient values, calculate the stability index of the system after placing this (DG).
Step 8 Allocate the next (DG) unit by repeating steps 5, 6 and 7.
Step 9 Stop if either the following constraints occurs:
(a) The voltage at a particular bus exceeds the upper limit, (b) The total size of (DG) units exceeds the total load plus losses, (c) The new iteration loss is greater than the previous iteration loss, (d) The new value of stability index exceeds the previous value after
International Journal of Emerging Technology and Advanced Engineering
[image:5.612.59.280.176.490.2]Website: www.ijetae.com (ISSN 2250-2459, ISO 9001:2008 Certified Journal, Volume 5, Issue 5, May 2015) TABLE I
LOSSES AND STABILITY INDEX AFTER DG PLACEMENT AT EACH BUS ONE AT A TIME
Bus No.
DG size
in MW L- Index
Losses in (MW)
%loss reduction
2 4.0138 0.103962 0.201061 4.710427
3 3.5621 0.089179 0.160571 23.9
4 3.1427 0.081696 0.147913 29.89905
5 2.8327 0.075369 0.135895 35.59479
6 2.5508 0.062895 0.111053 47.36825
7 2.5774 0.062105 0.112232 46.80948
8 1.9309 0.062919 0.118645 43.77014
9 1.5705 0.067175 0.121399 42.46493
10 1.4118 0.069199 0.12373 41.36019
11 1.3708 0.069729 0.124192 41.14123
12 1.3382 0.070165 0.125253 40.63839
13 1.1835 0.072289 0.129457 38.64597
14 1.1962 0.072179 0.131403 37.7237
15 1.0838 0.073733 0.133534 36.71374
16 1.0221 0.074644 0.136797 35.1673
17 0.9284 0.076106 0.142631 32.40237
18 0.9107 0.07643 0.145982 30.81422
19 1.7288 0.10582 0.206216 2.267299
20 0.5586 0.106775 0.208487 1.190995
21 0.5039 0.106819 0.208613 1.13128
22 0.4240 0.106885 0.20899 0.952607
23 2.4517 0.09467 0.169851 19.5019
24 2.0684 0.096601 0.17536 16.891
25 1.6762 0.098594 0.18183 13.82464
26 2.4121 0.064907 0.112962 46.46351
27 2.2469 0.067369 0.115379 45.31801
28 1.8331 0.073806 0.121015 42.64692
29 1.6952 0.076033 0.123336 41.54692
30 1.6710 0.076468 0.125692 40.43033
31 1.4459 0.080248 0.131558 37.65024
32 1.4545 0.080193 0.134588 36.21422
33 1.2433 0.083748 0.137336 34.91185
V. SIMULATION RESULTS AND DISCUSSION (DG
PLACEMENT FROM THE CRITERIA OF:MAXIMIZING BOTH
LOSS REDUCTION,VOLTAGE STABILITY OF IEEE33BUS
SYSTEM)
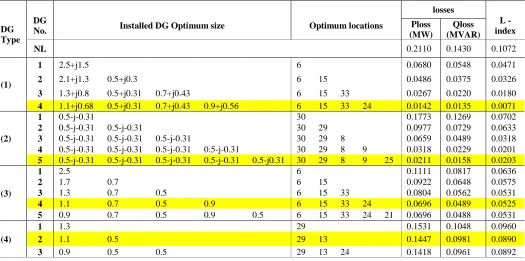
The proposed method is tested on IEEE 33-Bus Test Radial Distribution with total load of 3.7 MW and 2.3 MVAR and total active power losses 0.211 M.W, and the results of placement of multiple (DG) of different types (1, 2, 3, 4) are shown in Table 2.
A. Case:type-1 DG
Placement of (2.5+j1.5) MVA single (DG) unit operates at optimum power factor at the optimum location (bus 6) achieves loss reduction (67.77 %) and improve the stability index of system from (0.1072) to (0.0471),
However placing two, three and four (DG) units increasing the loss reduction to (76.97%, 87.35% and 93.27%) respectively. The stability indicator is
reduced to (0.0326, 0.0180 and 0.0071) respectively. The losses reduction in per unit is given by Eq. (13).
(13)
Fig. (2) Voltage Profile of type-1 DG
B. Case:type-2 DG
The loss reduction with a single (DG) Placement is
(15.97%) and the indicator decrease to
(0.0702). After allocating two, three, four and five (DG) units the loss reduction will be (53.70%, 68.77%, 84.93% and 90%) respectively. The indicator
decreases to (0.0201) in case of placement of four (DG) units, however placing the fifth (DG) unit increasing the
index slightly to 0.0203 and the loss reduction
is improved to (90%), so only fifth (DG) units is necessary for minimizing losses and enhancing system stability. Adding more DG units will increasing the system stability index to a large value and the system profile will go to worth again. The voltage profile for multiple type 2 (DGs) placement is shown in Fig. 3.
[image:5.612.313.569.194.356.2] [image:5.612.311.570.562.679.2]International Journal of Emerging Technology and Advanced Engineering
Website: www.ijetae.com (ISSN 2250-2459, ISO 9001:2008 Certified Journal, Volume 5, Issue 5, May 2015) C. Case:type-3 DG
[image:6.612.42.567.116.682.2]In this case the loss reduction for placing single, two, three, four and five (DG) units are (47.35 %, 56.30%, 61.90%, 67.01% and 67.01%) respectively as shown in Table 2.
Stability indicator value for five (DG) units
placement is more than the index value for the placement of four (DG) units, so only four (DG) units are accepted. The voltage profile for multiple type 3 (DGs) placement is shown in Fig. 4.
Fig. (4) Voltage Profile of type-3 DG
D. Case:type-4 DG
The loss reduction with single unit will be (27.44%), and for two and three units becomes (31.42% and 32.80%) respectively. Similarly in case of placement three (DG) units the indictor slightly higher in comparison to
the placement of two (DG) units, also the loss reduction improvement is a slight improvement, so we can add only two (DG) units to achieve high loss reduction and better stability. The voltage profile for multiple type 4 (DGs) placement is shown in Fig. 5.
Fig. (5) Voltage Profile of type-4 DG
TABLE II
RESULTS OF DG PLACEMENT FOR MAXIMIZING LOSS REDUCTION IN IEEE 33 BUS SYSTEM
DG Type
DG
No. Installed DG Optimum size Optimum locations
losses
L -index Ploss
(MW)
Qloss (MVAR)
NL 0.2110 0.1430 0.1072
(1)
1 2.5+j1.5 6 0.0680 0.0548 0.0471
2 2.1+j1.3 0.5+j0.3 6 15 0.0486 0.0375 0.0326
3 1.3+j0.8 0.5+j0.31 0.7+j0.43 6 15 33 0.0267 0.0220 0.0180
4 1.1+j0.68 0.5+j0.31 0.7+j0.43 0.9+j0.56 6 15 33 24 0.0142 0.0135 0.0071
(2)
1 0.5-j-0.31 30 0.1773 0.1269 0.0702
2 0.5-j-0.31 0.5-j-0.31 30 29 0.0977 0.0729 0.0633
3 0.5-j-0.31 0.5-j-0.31 0.5-j-0.31 30 29 8 0.0659 0.0489 0.0318
4 0.5-j-0.31 0.5-j-0.31 0.5-j-0.31 0.5-j-0.31 30 29 8 9 0.0318 0.0229 0.0201
5 0.5-j-0.31 0.5-j-0.31 0.5-j-0.31 0.5-j-0.31 0.5-j0.31 30 29 8 9 25 0.0211 0.0158 0.0203
(3)
1 2.5 6 0.1111 0.0817 0.0636
2 1.7 0.7 6 15 0.0922 0.0648 0.0575
3 1.3 0.7 0.5 6 15 33 0.0804 0.0562 0.0531
4 1.1 0.7 0.5 0.9 6 15 33 24 0.0696 0.0489 0.0525
5 0.9 0.7 0.5 0.9 0.5 6 15 33 24 21 0.0696 0.0488 0.0531
(4)
1 1.3 29 0.1531 0.1048 0.0960
2 1.1 0.5 29 13 0.1447 0.0981 0.0890
[image:6.612.46.571.420.681.2]International Journal of Emerging Technology and Advanced Engineering
Website: www.ijetae.com (ISSN 2250-2459, ISO 9001:2008 Certified Journal, Volume 5, Issue 5, May 2015)
VI. ECONOMIC ANALYSIS FOR DGPLACEMENT
Economy of (DG) placement is a decisive factor. This economy is measured through Cost Benefit Factor (CBF). (CBF) is proposed to rate the profit of (DG) placement in (RDN). This factor is a ratio between the money saving grew from total power losses reduction ,
cost of reserved power generation and the cost of adding new distributed generator unit . The placement of (DG) unit is profitable if the (CBF) is greater than one [17].
(14)
A. Total Cost of saved Energy
(15)
= 8760 *
(16)
Where
Power generated at the slack bus and in $/kWh.
Summation of equations (15 and 16) gives the total money saving in energy after (DG) placement in (RDN).
B. Total Cost of added DG units
The cost of (DG) units is divided into two major categories the capital fixed cost and the operating and maintenance cost. The capital fixed cost is annualized into a stream of equal annual payments over a specified (T) time at a specific interest rate (d) by using the capital recovery factor (CRF) [18].
(17)
(18)
AFC= (19)
(20)
Where
is the annualized fixed capital cost of (DG) unit.
is the annualized operation and maintenance cost of (DG) unit.
is the fixed capital cost of DG unit in $/Kw.
[image:7.612.47.279.263.479.2]CBF is calculated using equations (14:20) for (DG) unit placement based on minimum loss and maximum system voltage stability indicator criteria using the data given in table 3.
(DG) placement shall satisfy the three criteria: maximizing loss reduction, voltage stability and economy of IEEE 33 bus system.
VII. SIMULATION RESULTS (DGPLACEMENT FROM THE
THREE CRITERIA:ENHANCEMENT OF VOLTAGE STABILITY
AND MINIMIZING ENERGY LOSS AT MINIMUM COST OF
IEEE33BUS SYSTEM
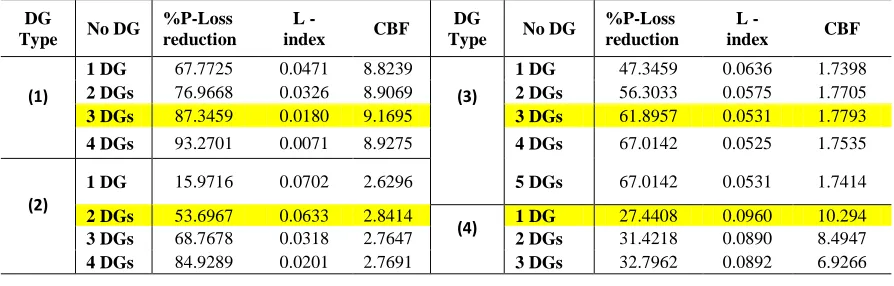
Applying three criteria of maximizing loss reduction, voltage stability and economy is tested on 33 IEEE bus system to optimally allocate DGs. The results are shown in table 4.
A. Case:type-1 DG
Refer to table 4, the CBF in case of single (DG) unit placement will be (8.8239) and it is improved to (8.9069, 9.1695) respectively for two and three (DG) units placement, but it is decreased again to (8.9275) at the placing of the fourth (DG) unit. So it is not economical to place four (DG) units of type 1 to enhance the voltage stability and maximizing the loss reduction.
B. Case:type-2 DG
International Journal of Emerging Technology and Advanced Engineering
Website: www.ijetae.com (ISSN 2250-2459, ISO 9001:2008 Certified Journal, Volume 5, Issue 5, May 2015) Table III
COST DATA FOR DIFFERENT DG UNIT TYPES [19]
Cost Data of type 1 DG (diesel generator) Cost Data of type 3 DG (PV )
Fixed CAPITAL COST 500 $/KW Fixed CAPITAL COST 3000 $/KW O&M cost 15 $/kw/year O&M cost 30 $/KW/Year Number of operating years T=30 Discount rate d=0.07 Tariff 0.05 $/KWH DG life time, years T=30
Tariff 0.05 $/KWH
Cost Data of type 2 DG (wind) Cost Data of type 4 DG (capacitor )
Fixed CAPITAL COST 1600 $/KW Installation cost 1000 $ for each location O&M cost 60 $/kw/year Purchasing rate of capacitor 3 $/KVAR
TABLE IV
RESULTS OF DG PLACEMENT FROM THE THREE CRITERIA: ENHANCEMENT OF VOLTAGE STABILITY AND MINIMIZING ENERGY LOSS AT MINIMUM COST OF IEEE 33 BUS SYSTEM
DG
Type No DG
%P-Loss reduction
L -
index CBF
DG
Type No DG
%P-Loss reduction
L -
index CBF
(1)
1 DG 67.7725 0.0471 8.8239
(3)
1 DG 47.3459 0.0636 1.7398
2 DGs 76.9668 0.0326 8.9069 2 DGs 56.3033 0.0575 1.7705
3 DGs 87.3459 0.0180 9.1695 3 DGs 61.8957 0.0531 1.7793
4 DGs 93.2701 0.0071 8.9275 4 DGs 67.0142 0.0525 1.7535
(2)
1 DG 15.9716 0.0702 2.6296 5 DGs 67.0142 0.0531 1.7414
2 DGs 53.6967 0.0633 2.8414
(4) 1 DG 27.4408 0.0960 10.294
3 DGs 68.7678 0.0318 2.7647 2 DGs 31.4218 0.0890 8.4947
4 DGs 84.9289 0.0201 2.7691 3 DGs 32.7962 0.0892 6.9266
So the number of (DG) units limited to two (DG) units to enhance the voltage stability and improve the loss reduction by economical way.
C. Case:type-3 DG
The CBF increase to (1.7398, 1.7705, and 1.7793) respectively for single, two and three (DG) unit placement, but it is decreased again to (1.7535) at the placing of the fourth (DG) unit. So it is economical to place only three (DG) units of type 3 to enhance the voltage stability and maximizing the loss reduction
D. Case:type-4 DG
[image:8.612.83.530.368.511.2]International Journal of Emerging Technology and Advanced Engineering
Website: www.ijetae.com (ISSN 2250-2459, ISO 9001:2008 Certified Journal, Volume 5, Issue 5, May 2015)
VIII. COMPARISON OF REACHED RESULTS WITH THOSE IN
PUBLICATIONS
Observing Table 5, for case (1) the optimal size of the DG unit placed by the proposed Extended-IA approach is slightly small as compared to the IA approach [13], for single DG unit placement the loss reduction in case of IA is slightly higher than the proposed method, but the CBF (1.7398) of the extended method is higher than the CBF (1.7350) of the IA-method, so the extended method is more economical. Similarly for two DGs unit placement the extended method is more economical.
But in case of three DG units placement the IA showed that locations (6, 12 and 31) are the optimum locations and the summation of the DG units sizes at these locations equal (2.52 MW) and will achieve (61.61%) loss reduction, but the proposed extended method selected the locations (6, 15 and 33) as an optimum locations, the summation of DG units sizes at these locations equal to (2.3MW) and will achieve higher loss reduction (61.90%) than the IA method, the extended method is still more economical, the CBF of IA is (1.7772) and the cost CBF of the Extended-IA method is (1.7793).
In this case the size of DG is selected to enhance the voltage stability via minimizing the losses of the test system, the size of DG units is chosen to achieve the minimum cost benefit and the stability index is
used as a constraint in this case.
For case (2) the size of DG unit can be chosen to enhance the voltage stability via both loss reduction and maximizing the stability index, so in this case the weight of improving the stability index will be higher, that will be achieved by Increasing the DG unit size for more stability index improvement, but loss reduction will
The simulation results show that by placing a 2.9MW single DG unit (type 3) at bus 6 will increase the system index to 0.0582 but the losses reduction will be
46.78% and the CBF will be (1.7208). The index, loss reduction and CBF using PSO algorithm presented in [20] are (0.0589, 45.5450% and 1.7181) after placing a 2.89MW (type 3) DG unit at bus 7. Similarly by comparing the proposed method results for three DG units placement with the method proposed in [21] which is based on PSO algorithm, the proposed method achieves higher improvement for both loss reduction and stability index.
TABLE V
RESULTS OF DG PLACEMENT BASED ON PROPOSED METHOD AND OTHER PUBLICATIONS METHODS Case (1) Minimum loss reduction
IA-method [13] Proposed method
DG
No. Installed DG unit
% Ploss
reduction CBF Installed DG unit
% Ploss
reduction CBF
(1) Bus 6 47.39% 1.7350 6 47.35% 1.7398
Size 2.601 2.5
(2) Bus 6 14 56.61% 1.7638 6 15 56.30% 1.7705
Size 1.8 0.72 1.7 0.7
(3) Bus 6 12 31 61.61% 1.7772 6 15 33 61.90% 1.7793
Size 0.9 0.9 0.72 1.1 0.7 0.5
Case (2) Minimum loss reduction and voltage stability enhancement
Publications- methods Proposed method
DG
No. Installed DG unit
%Ploss Reduc-tion
L-
index CBF
Installed DG unit
%Ploss
Reduc-tion
L-
index CBF
(1) PSO[20]
Bus 7
45.55% 0.0589 1.7181 6
2.9 46.78% 0.0582 1.7208
Size 2.89
(3) PSO[21]
Bus 6 25 16
61.09% 0.0571 1.7504 6 15 33 61.14% 0.0524 1.7544
International Journal of Emerging Technology and Advanced Engineering
Website: www.ijetae.com (ISSN 2250-2459, ISO 9001:2008 Certified Journal, Volume 5, Issue 5, May 2015)
Finally the proposed method results are acceptable and there is no big difference in comparison to the previous publications results.
IX. CONCLUSION
The paper presents an extended Methodology based on Improved Analytical Expression, for DG placement to
secure minimum loss, Stability index indicator
and cost benefit factor. The system with DG placed to minimize loss is subjected assessment of voltage stability. DG placement is further adjusted to minimize the stability
index . Further economy of DG placement, based on cost benefit factor (CBF) assessment to reach best (DG) placement in the (RDN), based on the three criteria. The merits of the developed method lies in its simplicity, saving time because the load flow in this method is only performed twice once before placement the (DG) unit and once after installing the (DG) units as well as this method is precise in achieving results.
REFERENCES
[1] G. A. L. S. T. Ackermann, Distributed generation: A definition.
Electric Power System Research, 57 (3) (2001) 195–204.
[2] A. M. Begovic, Summary of System protection and voltage stability,
IEEE Transactions on Power Delivery, 10 (2) (2001) 631-638.
[3] A. W. Ouyang, Distribution network planning method considering
distributed generation for peak cutting, Energy Conversion and Management, 51 (12) (2010) 2394-2401.
[4] M. L. R. A. M. V. M. M. A. A. D. A. Pigazo, Wavelet-based
islanding detection in grid-connected PV systems, IEEE Trans. Ind. Electron., 56 (11) (2009) 4445–4455.
[5] H. L. Willis, Power Distribution Planning Reference Book, Marcel
Dekker, New York, 1997.
[6] N. D. H. Pavlos S. Georgilakis, Optimal Distributed Generation
Placement in Power Distribution Networks: Models,Methods, and Future Research, IEEE TRANSACTIONS ON POWER SYSTEMS, 28 (3) (2013).
[7] H. L. Willis, Analytical methods and rules of thumb for modeling DG-distribution interaction, in Proc. IEEE Power Eng. Soc. SummerMeeting, (2000) 1643–1644.
[8] Wang and M. H. Nehrir, Analytical approaches for optimal
placement of distributed generation sources in power systems, IEEE Trans.Power Syst., 19 (4) (2004) 2068–2076.
[9] P. M. A. N. M. N. Acharya, An analytical approach for DG
allocation in primary distribution network, Int. J. Elect. Power Energy Syst., 28 (10) (2006) 669–678.
[10] T. Gözel and M. H. Hocaoglu, An analytical method for the sizing and siting of distributed generators in radial systems, Elect. Power Syst.Res, 79 (6) (2009) 912–918.
[11] S.-H. Lee and J.-W. Park, Selection of optimal location and size of multiple distributed generations by using Kalman filter algorithm, IEEE Trans. Power Syst., 24 (3) (2009) 1393–1400.
[12] N. M. A. R. C. B. D. Q. Hung, Analytical expressions for DG
allocation in primary distribution networks, IEEE Trans.Energy Convers., 25 (3) (2010) 814–820.
[13] J.S.DHillon, Power System Otimization, 2007.
[14] Q. Hung and N. Mithulananthan, Multiple distributed generators
placement in primary distribution networks for loss reduction, IEEE Trans. Ind. Electron., 60 (4) (2013) 1700–1708.
[15] N. M. Duong Quoc Hung, Multiple Distributed Generator Placement
in Primary Distribution Networks for Loss Reduction, IEEE TRANSACTIONS ON INDUSTRIAL ELECTRONICS, VOL. 60(4) (2013).
[16] H. G. P. Kessel, Estimating the voltage stability of a power system,
IEEE Trans. Power Delivery, (3) (1986) 346–354.
[17] M. A. E. Ahmed Helal, Optimal Location and Sizing of Distributed
Generation Based on Gentic Algorithm, ©IEEE 978 (1) (2012) 4673-4695.
[18] P. D. H. T. Short W, Manual for the economic evaluation of energy
efficiency and renewable energy technologies, US National Renewable Energy Laboratory (NERL), (1995) 47-54.
[19] M.M. Aman. G.B. Jasmon. A.H.A. Bakar H. Mokhlis, A new
approach for optimum DG placement and sizing based on voltage stability maximization and minimization of power losses, 70 (2013) 202–210.
[20] H. Musa , S.S. Adamu, Enhanced PSO Based Multi-Objective