Energy performance and thermal comfort
of courtyard/atrium dwellings in the
Netherlands in the light of climate change
Taleghani, M, Tenpierik, M and van den Dobbelsteen, A
http://dx.doi.org/10.1016/j.renene.2013.09.028
Title Energy performance and thermal comfort of courtyard/atrium dwellings in the Netherlands in the light of climate change
Authors Taleghani, M, Tenpierik, M and van den Dobbelsteen, A
Type Article
URL This version is available at: http://usir.salford.ac.uk/49734/
Published Date 2014
USIR is a digital collection of the research output of the University of Salford. Where copyright permits, full text material held in the repository is made freely available online and can be read, downloaded and copied for noncommercial private study or research purposes. Please check the manuscript for any further copyright restrictions.
Energy performance and thermal comfort of courtyard/atrium
dwellings in the Netherlands in the light of climate change
*1Mohammad Taleghani1, Martin Tenpierik1, Andy van den Dobbelsteen1
1 Delft University of Technology, Delft, the Netherlands
Abstract
With increased global concerns on climate change, the need for innovative spaces which can
provide thermal comfort and energy efficiency is also increasing. This paper analyses the
effects of transitional spaces on energy performance and indoor thermal comfort of low-rise
dwellings in the Netherlands, at present and projected in 2050. For this analysis the four
climate scenarios for 2050 from the Royal Dutch Meteorological Institute (KNMI) were used.
Including a courtyard within a Dutch terraced dwelling on the one hand showed an increase in
annual heating energy demand but on the other hand a decrease in the number of summer
discomfort hours. An atrium integrated into a Dutch terraced dwelling reduced the heating
demand but increased the number of discomfort hours in summer. Analysing the monthly
energy performance, comfort hours and the climate scenarios indicated that using an open
courtyard May through October and an atrium, i.e. a covered courtyard, in the rest of the year
establishes an optimum balance between energy use and summer comfort for the severest
climate scenario.
Keywords
Courtyard, atrium, climate change, heating demand, thermal comfort.
1.
Introduction
1.1. Background
In the light of energy reduction, transitional spaces have been recognised as a way to receive
natural light and air [1-9]. These spaces have been used for 5000 years [10, 11], and have
emerged in different types for varied purposes. These spaces cover a wide range of spaces
from a balcony and a corridor to a courtyard or an atrium. Transition zones are the in-between
architectural spaces where the indoor and outdoor climate is moderated without mechanical
control systems. In these spaces the occupant may to a certain extent experience the dynamic
effects of changes in the outdoor climate. Typically transitional spaces have different
interactions with the outdoor environment depending on the climate. In hot climates, they are
open to the sky to ease night radiation flux [6, 12-14]. Steemer et al. [15] proposed six
archetypal generic urban forms for London (51°N) and compared incident solar radiation,
built potential and day-lighting criteria. They concluded that the courtyard performs best
among these six archetypes. In humid regions, they are used to ventilate buildings and reduce
humidity [16-19]. Okeil [20] generated a built form named the Residential Solar Block (RSB),
which later was compared with a slab and a pavilion court [21]. The RSB was found to lead to
an energy efficient layout for a hot and humid climate of UAE at a latitude of 25°N.
Regarding the importance of ventilation in hot arid and humid climates, Al-Hemiddi and
Megren Al-Saud [22] demonstrated that the cross ventilation in a courtyard results in
significant enhancement of cooling the interiors and providing thermal comfort. Regarding the
orientation, [23] in a hot arid environment with measurements showed that in two identically
shaped and similarly treated courtyards, but differently oriented, East-West direction provides
much more thermal discomfort than North-South. In colder environments, courtyards are
covered and glazed to capture solar energy and reduce heat loss [24-27]. Aldawoud and Clark
that the open courtyard building exhibits a better energy performance for the shorter
buildings, while at some point the enclosed atrium exhibits a better energy performance for
tall buildings. They also discussed that different factors like glazing and climate parameters
play important role in the efficiency of an atrium. Last but not least, in snow climates, a group
of buildings forming an urban courtyard protects itself against cold winds [8, 28].
This paper investigates courtyards, common in hot climates, as a possible passive strategy for
buildings in temperate climates. More precisely, the courtyard and the atrium (covered
courtyard) as transitional spaces will be analysed in this paper to see if they could be
applicable and effective for dwellings in the Netherlands by 2050. Finally, the paper will
conclude whether courtyards or atria, or a combination of both, can provide a more
energy-efficient and comfortable indoor environment for the temperate climate of the Netherlands. In
other words, the main question for the study presented is whether the use of transitional
spaces can be a solution for temperate climates if these become subject to climate change.
1.2. Climate change in the Netherlands
There is a growing concern about the use of fossil energy and its implications for the
environment. After decades of debate, the human influence on the climate seems near to
certain, supported by a vast majority of climate scientists gathered under the International
Panel on Climate Change [29]. NASA has identified eight effects of rapid climate change.
These are: global temperature rise, warming oceans, shrinking ice sheets, declining arctic sea
ice, glacial retreat, sea level rise, extreme weather events and ocean acidification. The exact
extent to which these effects of climate change will occur, and in which timeframe, is subject
to uncertainty. Therefore the IPCC works with different variants, sets of probabilities, each
leading to different outcomes for the temperature increase and sea level rise. The Royal Dutch
the near future in 2050, divided as in a matrix of two times two: a moderate and warm
scenario (+1oC, +2oC temperature increase respectively) versus unchanged or changed air
[image:5.595.205.388.157.330.2]circulation patterns. Figure 1 presents these four scenarios.
Figure 1: Four climate scenarios for the Netherlands in 2050 [30].
Based on these scenarios, Figure 2 presents the expected number of summer days with
Figure 2: Calculated effects on the number of summer days in case of the four climate scenarios for the Netherlands in 2050 [30].
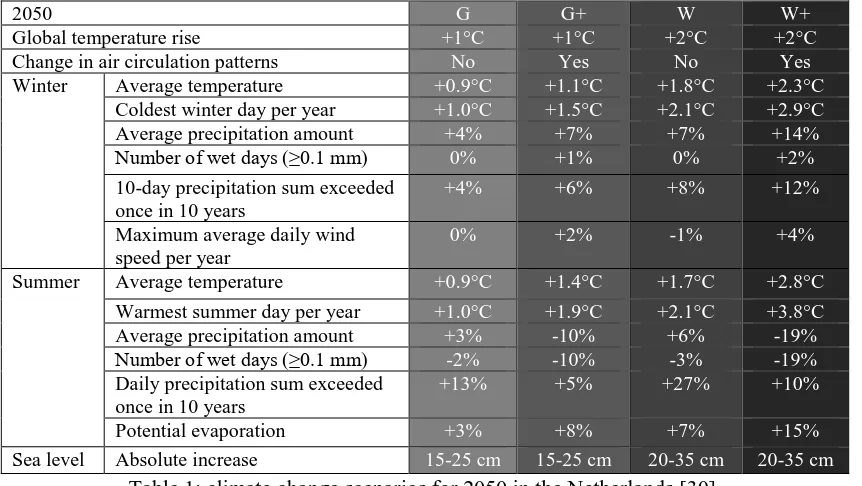
Table 1 presents an overview of climate characteristics for each of the four climate scenarios.
2050 G G+ W W+
Global temperature rise +1°C +1°C +2°C +2°C
Change in air circulation patterns No Yes No Yes
Winter Average temperature +0.9°C +1.1°C +1.8°C +2.3°C
Coldest winter day per year +1.0°C +1.5°C +2.1°C +2.9°C
Average precipitation amount +4% +7% +7% +14%
Number of wet days (≥0.1 mm) 0% +1% 0% +2%
10-day precipitation sum exceeded once in 10 years
+4% +6% +8% +12%
Maximum average daily wind speed per year
0% +2% -1% +4%
Summer Average temperature +0.9°C +1.4°C +1.7°C +2.8°C
Warmest summer day per year +1.0°C +1.9°C +2.1°C +3.8°C
Average precipitation amount +3% -10% +6% -19%
Number of wet days (≥0.1 mm) -2% -10% -3% -19%
Daily precipitation sum exceeded once in 10 years
+13% +5% +27% +10%
Potential evaporation +3% +8% +7% +15%
[image:6.595.84.510.175.416.2]Sea level Absolute increase 15-25 cm 15-25 cm 20-35 cm 20-35 cm
Table 1: climate change scenarios for 2050 in the Netherlands [30].
Recent insights indicate a greater probability towards W (Warm) and W+ (Warm+) rather
than G (Moderate) and G+ (Moderate +), implying higher temperatures throughout the year as
well as dryer summers and wetter winters. For residential buildings, this is important, since
these for indoor comfort need to be adjusted to higher outdoor temperatures. Preferably this
needs to be done without mechanical interventions, because correction by means of
air-conditioning units would increase the consumption of fossil fuels, thereby further aggravating
climate change and heating up urban areas locally due to waste heat from the cooling device.
Another consequence of the most probable scenarios is an increase of precipitation in winter
and heavier showers in summer, which in a common Dutch situation would be discharged as
quickly as possible, but this now already creates flood problems, so local retention will
2.
Methodology
2.1. Modelling and simulations
This simulation study is divided into four phases, each showing the effect of using a
transitional space inside a building (see Figure 3). Phase zero forms the reference for this
study and uses a typical Dutch mid-terraced dwelling without any form of transitional space.
In phase 1, two courtyard models are introduced; the first is an existing dwelling located in
Amsterdam (Figures 5 and 6) and having a small courtyard, i.e. a patio; the second is a virtual
dwelling that was constructed by introducing a small courtyard in the Dutch mid-terraced
reference dwelling (Figure 4). In phase 2, the courtyards of the dwellings from phase 1 are
covered with a glazed roof, creating an atrium. In the last phase, the courtyards of the
dwellings from phase 1 have a glazed roof in winter (from October till April) and no roof in
summer (from May till September). All models are designed in such a way that they at least
have a living room, a bedroom and a kitchen.
For the simulations the DesignBuilder software package was used, which employs the
state-of-the-art building performance simulation engine of EnergyPlus. EnergyPlus is a
comprehensive transient simulation tool including detailed accounting of energy inputs and
energy losses. The simulation is based on hourly weather data and among others takes into
account solar heat gains through windows, heat conduction and convection between different
zones and the energy applied or extracted by mechanical systems [31, 32].
Model Surface/Volume
Reference model 0.38
Amsterdam courtyard 0.51
Virtual courtyard 0.88
[image:7.595.201.397.637.687.2]Figure 3: the research scenario.
Figure 4: The Dutch Agentschap NL mid-terraced reference dwellings [33].
Figure 6: The Amsterdam courtyard house with its left and right adjacent.
For this study, the following properties were implemented in DesignBuilder:
a) Construction:
For the simulations, the wall and roof types were parameterised with the data in Table 3. Section U-value
W/m2K
Rc-value
m2K/W
Wall:
- Brickwork Outer Leaf (100mm) - Air Gap (40mm)
- EPS Expanded Polystyrene (100mm) - Concrete Block (100mm)
- Gypsum Plastering (10mm)
0.31 3.0
Roof:
- Bituminous roofing felt (2mm) - Fibreboard (13mm)
- XPS Extruded Polystyrene (80mm) - Cast Concrete (100mm)
- Gypsum Plastering (15mm)
[image:9.595.134.460.372.555.2]0.33 2.9
Table 3: the wall and roof properties used in the simulations and calculations.
b) HVAC:
The heating system considered in the models is based on radiators for which the water is
supplied by a gas boiler with an efficiency of 65%. The heating set points are described in
Table 4, and the heating set-backs are 12oC.
Regarding the ventilation, the dwellings have a natural supply of fresh air. Moreover, if the
Furthermore, the wind factor used is 1.00. The models are not equipped with an additional
mechanical cooling system since the predominant part of Dutch dwellings are in free running
mode during summer. Furthermore, there is an operation schedule for the zones. The
operating schedule specifies the times when the prescribed environmental conditions should
be met.
Heating schedule Set-point °C
Living room 16:00-23:00 21
Bedroom 22:00-09:00 18
[image:10.595.124.454.208.322.2]Kitchen 16:00-23:00 18
Table 4: heating schedules, set points and set backs of the thermal zones.
c) Glazing type and lighting:
Most Dutch dwellings have large windows to achieve maximum daylight access. This is
mostly because of the high latitude (52oN) and consequently the low sun angle during the
winter (15o at 12:00 on 21st of Dec). A window-to-wall ratio of around 30% is very common
in the Netherlands. The external window type for the models is double glazing (generic clear
3mm) with an air cavity of 13mm in between the layers (U- value= 1.96 W/m2K).
2.2. Summer thermal comfort calculation
Thermal comfort temperature boundaries reflect within which temperature range the indoor
environment is assumed to be comfortable for users [34, 35]. Among all thermal comfort
standards, this study uses ASHRAE 55-2010 for the calculations of summer thermal comfort.
This is due to the large number of field studies making up its database. Moreover, recent
studies [36-41] have compared several thermal comfort standards with different approaches;
main purpose of this standard is to specify the combinations of indoor thermal environmental
parameters (temperature, thermal radiation, humidity and air speed) and personal parameters
(clothing insulation and metabolism rate) that will produce thermal environmental conditions
acceptable to a majority of the occupants. This standard uses the following equation for
calculating the indoor comfort temperature (Tco) based on the outdoor reference temperature
(Tref):
(1)
Where
= prevailing mean outdoor air temperature for a time period between last 7 to 30 days
before the day in question [43].
This equation may be used for summer when the outdoor drybulb temperatures range from
5°C to 32°C. Figure 7 shows the comfort bandwidths derived from equation (1). Based on
80% and 90% occupant acceptability ranges. The 80% acceptability limits are for typical
applications and the 90% limit may be used when a higher standard of thermal comfort is
desired. Moreover, the activity level is determined as being less than 1.3 met (normally
[image:11.595.125.469.522.727.2]sedentary activities).
2.3. Weather data
• The current climate:
The climate of De Bilt (52°N, 4°E), representing the climate of the Netherlands, is known as a
temperate climate based on the climatic classification of Köppen-Geiger [44]. The prevailing
wind is South-West. The mean annual dry bulb temperature is 10.5°C (Figure 8). In this
paper, the reference weather data of De Bilt is used according to Dutch standard [45].
According to this standard, every month of the reference year is represented by a specific year
which is considered representative of the period from 1986 until 2005. The selection is
presented in Table 5. Data files from appendix A2 (of the standard) are used for this study
because these were developed for energy performance simulations. For summer thermal
comfort studies, the standard [45] specifies separate weather files. In this study, also the
weather file in Appendix A2 was used.
Month Jan Feb Mar Apr May Jun Jul Aug Sep Oct Nov Dec Year 2003 2004 1992 2002 1986 2000 2002 2000 1992 2004 2001 2003
[image:12.595.112.519.550.714.2]Table 5: Representative weather data of De Bilt as used in the calculations.
Furthermore, based on the comfort algorithm and the range permitted for 80% of
acceptability, Figure 9 presents the indoor operative comfort temperatures during the free
running mode period in De Bilt. The duration of this period is based on the former Dutch
energy performance standard for residential buildings [46]. This standard states that the free
[image:13.595.78.514.240.499.2]running mode typically occurs from 1st of May until 30th of September in the Netherlands.
Figure 9: Comfort temperatures of De Bilt in the free running time calculated based on ASHRAE 55-2010 standard for 80% of occupants.
• Weather data for the year 2050:
In 2006, the Royal Netherlands Meteorological Institute presented the most recent climate
scenarios for the Netherlands [30]. These four differing climate scenarios present the expected
climate changes in the Netherlands in 2050 and 2100. The scenarios differ in the extent to
which the global temperature increases and in the way wind patterns above the Netherlands
temperature, whereas the G and G+ scenarios are characterised by a moderate increase of
average global temperature. Moreover, contrary to the W and G scenarios, the W+ and G+
scenarios are also affected by changes in wind patterns above the Atlantic and Western
Europe, causing hot and wet winters and hot and dry summers in the Netherlands.
As can be seen from Table 1, the four climate scenarios include changes in temperature, wind
and precipitation, and consequently sun hours. The first and last are most important for
determining the energy performance of buildings, whereas the second and third are less
important. For the year 2050 and with reference to the year 1990, the climate scenarios predict
an increase in temperature between 0.9°C to 2.3°C in winter and 0.9°C and 2.8°C in summer.
The climate scenarios do not present a precise prediction for changes in solar radiation
patterns. According to a KNMI climate sketchbook [47], the Netherlands is located at the
boundary between Southern Europe, where cloud coverage will decrease, and Northern
Europe, where cloud coverage will increase. Only, in the G+ and W+ small changes in the
number of rainy days in summer, an consequently sun hours, are expected. In general, though,
it is expected that changes in solar radiation patterns will be small. As a result, such changes
are not considered in this study.
For the energy performance simulations, hourly weather data including outdoor temperature
and solar radiation are needed. As explained previously, the weather file from [45] is used for
simulating the current climate. This weather file is also used as a basis for the developing the
weather files of 2050 for each of the four climate scenarios; only the outdoor temperature has
to be modified. The weather files were developed by [48] using the KNMI online
transformation program for time series [49]. This transformation tool transforms historic
temperature series on a daily basis to a new series that fits one of the four climate scenarios
• In the transformation program, the weather station of De Bilt was selected with a time
horizon of 1990. This produces the daily average temperature in De Bilt between 1976
and 2005.
• With the help of the program the daily temperatures of 1990 are then transformed to
the time horizon of 2050 for each of the four climate scenarios. This produces the
daily temperature in De Bilt between 2036 and 2065.
• Next, for each day in the period 1976 to 2005, the daily temperature increase over a
period of 60 years (from 1976-2005 to 2036-2065) is calculated, again for each
climate scenario.
• The hourly weather data in a certain month in the weather file of [45] are measured
data coming from a certain representative month between the years 1986 and 2004
(Table 5). For each day in the weather file of [45] the results of the previous step are
used to see how big the increase in temperature is according to each of the scenarios.
• Finally, for each day in the [45] weather file, the temperature of each hour is increased
by its respective daily increase in order to get the temperature corresponding to a
certain climate scenario.
3.
Results and discussion
3.1. Phase zero: The reference model- Building I
The Netherlands is known as a temperate climate. As can be seen in Figure 8, in winter, the
average wind speed is higher than in summer. Wind is important for the heat loss of a
building by infiltration. Figure 10 shows the monthly heat loss, solar gains and heating energy
demand of Building I for the current representative weather data of De Bilt [45]. The heating
mode (May-September), heating demand is zero, and during this period, solar gains through
windows and internal heat gains make up for the transmission and ventilation/infiltration heat
losses. Due to the increase of wind speed, the decrease of the outdoor temperature and the
[image:16.595.76.520.214.458.2]decrease of solar gains, the heating energy demand starts to increase from October.
Figure 10: Monthly energy balance of the reference model representative for the current climate.
Based on this model in DesignBuilder, the four climate scenarios G, G+, W and W+ were
simulated additionally. These simulations help to understand how climate change affects the
dwelling’s indoor environment and energy use. Figure 11 depicts the indoor operative
temperature of Building I for the current climate of the Netherlands and for each of the four
climate scenarios. As illustrated, the indoor operative temperature is more or less identical in
winter for each situation. The main reason is that in winter this temperature is not so much
affected by the outdoor conditions but by the heating system. However, during the
free-running time, the indoor operative temperature differs for each scenario. In this period, the
conditions. The highest indoor operative temperature increase, equal to 2.5oC, can be found in
the W+ scenario in the months June, July and August. For that scenario, the monthly average
outdoor dry bulb temperature increase approximately equals 3.0oC in the respective months.
Likewise, the heating energy demands based on the five sets of weather data are demonstrated
in Figure 12. It is logical that less energy is needed for heating in winter if the outdoor
temperature is higher. Consequently, the heating energy demand of Building I based on the
representative weather data of [45] is the highest (26 kWh/m2/yr). Also, heating energy
[image:17.595.87.517.320.520.2]demand is the lowest for the severest climate scenario (W+): 19 kWh/m2/yr.
Figure 12: Heating energy demand of Building I based on [45] and the four KNMI’06 climate scenarios.
Because of the increase of indoor operative temperature during free-running time, the number
of thermally comfortable hours changes. In this regard, the indoor comfort temperature and
the range for 80% satisfaction in the climate of De Bilt are important. Calculations using the
adaptive thermal comfort model from ASHRAE 55-2010 for the daytime show that by the
increase of outdoor drybulb temperature, the number of hours the indoor temperature exceeds
the 80% satisfaction range increases from 46 hours (for the current climate) to 331 hours (for
the severest scenario; W+), which equals respectively 4% and 31% of the total number of
hours.
3.2. Phase one: The effect(s) of a courtyard- Buildings IIc and IIIc
At this step of the research, the effect of having a courtyard as a transitional space inside a
dwelling is studied. On this account, an actual courtyard dwelling in Amsterdam-Building IIc
(Figure 6), and a virtual courtyard dwelling-Building IIIc based on the reference dwelling are
in Figure 13 using the weather data representing the current climate and climate scenario W+.
Based on the results, Building IIIc has a higher heating demand than Building I (45 and 26
kWh/m2/yr respectively). Moreover, Building IIc is also less energy-efficient than Building I
[image:19.595.88.518.212.466.2](33 compared to 26 kWh/m2/yr).
Figure 13: Heating energy demand of Building I, IIc and IIIc for the current climate of the Netherlands (dark bars) and the future W+ scenario (white bars inside dark ones).
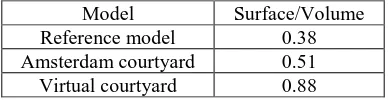
Referring to Table 2, the surface to volume ratios of the two models in phase one are higher
than Building I. This leads to the higher exposure of the models to outdoor conditions and
consequently to higher heat losses in winter. In this regard, although a courtyard increases
solar gains, it makes the models prone to additional transmission, ventilation and infiltration
heat losses. The heating energy demands of the mentioned models in the context of climate
scenario W+ are shown as white bars in Figure 13. With the increase of outdoor temperature,
for the models are 1.1 kWh/m2 for Building I, 1.3 kWh/m2 for Building IIc, and 1.7°C for
Building IIIc. These differences also show how surface to volume ratio relates the heating
demand of a building to its outdoor environment.
From the summer thermal comfort point of view, the indoor operative temperature of the
models needs to be analysed and compared. In Figure 14, the indoor operative temperatures of
Building I, IIc and IIIc are illustrated in the context of the current and the severest climate
scenario (W+). Comparing Building I and Building IIIc during May-October, the indoor
operative temperature of Building I is 1°C and 3°C higher than of Building IIc in the current
climate and W+ scenario. Moreover, Building II has the lowest indoor operative temperature
in summer. These differences between Building I and the courtyard models are due to the
transmission losses through the envelopes. Apparently, since the courtyard models have a
higher surface to volume ratios, they are easily prone to heat loss and ventilation. Based on
the calculated comfort temperatures for this period of 5 months, Building IIc has the smallest
number of discomfort hours in the severest climate scenario W+ (12% of the occupied hours),
and Building IIIc made based on Building I has slightly more discomfort hours (15% of the
occupied hours). As shown previously, Building I has the largest number of discomfort hours
Figure 14: Monthly average indoor operative temperature of the studied models in the context of the
severest KNMI’06 climate scenario (W+).
3.3. Phase two: The effect(s) of an atrium- Buildings IIa and IIIa
In this phase, the models simulated in phase one with a courtyard are covered with a glass
roof (U-value of 2.2 W/m2K). In phase one, the simulated dwellings with a courtyard showed
an increase in heating demand in comparison to Building I. In this step, the courtyards are
covered to analyse whether this strategy increases the efficiency of the dwellings from an
energy use and thermal comfort point of view.
Referring to Figure 15, the heating demands of the courtyard dwellings (IIc and IIIc) are
compared with the respective atrium models (IIa and IIIa) in the current climate of the
Netherlands. During the cold months, the differences are clearly visible. In this regard, the
average winter monthly heating demand of Building IIc is 1.3 kWh/m2 more than of its atrium
model (excluding summer months in which the heating demand is zero). The average winter
climate covering the transitional space, thereby creating an atrium, can reduce the heating
demand by 6 and11 kWh/m2 for the whole year for Building IIc and IIIc, respectively. Having
the models in the severest KNMI’06 climate scenario (W+), the heating energy demands have been reduced (as visible in Figure 15 with white bars). The average reductions during a year
for the models between the current climate and future climate scenario W+ are 1.0 kWh/m2
for Building IIa model, and 1.2 kWh/m2 for Building IIIa. These differences also show how
surface to volume ratio relates the heating demand of a building to its outdoor environment.
Also overheating risk should be checked for atria which typically increase the number of
summer discomfort hours. Therefore, similarly as in Phase one, the indoor operative
temperature of the four models (being the courtyard and atrium dwellings) is compared for
[image:22.595.77.524.408.642.2]both the current Dutch climate and the severest KNMI’06 climate scenario (W+).
Figure 16: Indoor operative temperature of the studied models in the context of the severest KNMI’06 climate scenario (W+).
Figure 16 clearly shows how the average monthly indoor operative temperature increases
during summer in the atrium dwellings compared to the courtyard dwellings for the current
climate and KNMI’06 W+ climate scenario. As the monthly operative temperatures of models
are depicted, converting courtyard models to atrium, increases indoor operative temperature.
In this regard, the courtyard model (Building IIc) is 0.5°C cooler than the similar atrium
model (during May-October). This difference in Building IIIc is 1.0°C. In general, it shows
covering a courtyard and converting it to an atrium, makes the indoor environment warmer.
In addition, the mentioned models in the context of KNMI’06 W+ climate scenario are
considered. On this account, Building IIa is 0.6°C warmer than IIc, and Building IIIa is 1.2°C
warmer than the similar courtyard model (Building IIIc). These differences cause a higher
As an illustration, thermal discomfort increased from 12 to 20% for Building IIa, and 15to
33% for Building IIIa, as compared to their respective courtyard model (for the KNMI’06
climate scenario W+).
Month Building IIc Building IIa Building IIIc Building IIIa Priority
based model Heating kWh/m2 Discomfort hours Heating kWh/m2 Discomfort hours Heating kWh/m2 Discomfort hours Heating kWh/m2 Discomfort hours
Jan 9 - 7 - 12 - 9 - At*
Feb 5 - 4 - 7 - 5 - At
Mar 4 - 3 - 5 - 3 - At
Apr 1 0 1 0 1 0 0 0 At
May 0 0 0 0 0 0 0 16 Cy**
Jun 0 26 0 41 0 31 0 66 Cy
Jul 0 14 0 24 0 22 0 48 Cy
Aug 0 5 0 14 0 5 0 38 Cy
Sep 0 0 0 0 0 0 0 0 Cy/At
Oct 1 0 1 0 1 0 1 0 CY/At
Nov 5 - 4 - 6 - 4 - AT
Dec 8 - 6 - 10 - 7 - AT
[image:24.595.48.553.633.755.2]Total 33 45 26 79 43 58 30 168 -
Table 6: Monthly heating energy demand and discomfort hours (based on the current climate scenario). At*=atrium; Cy**= courtyard.
Month Building IIc Building IIa Building IIIc Building IIIa Priority
based model Heating kWh/m2 Discomfort hours Heating kWh/m2 Discomfort hours Heating kWh/m2 Discomfort hours Heating kWh/m2 Discomfort hours
Jan 7 - 6 - 9 - 7 - At
Mar 3 - 2 - 3 - 2 - At
Apr 0 0 0 0 0 0 0 0 Cy/At
May 0 2 0 12 0 8 0 34 Cy
Jun 0 58 0 75 0 63 0 106 Cy
Jul 0 40 0 62 0 52 0 84 Cy
Aug 0 27 0 62 0 43 0 125 Cy
Sep 0 0 0 0 0 0 0 2 Cy/At
Oct 0 0 0 0 0 0 0 0 CY/At
Nov 3 - 2 - 4 - 3 - AT
Dec 6 - 5 - 8 - 6 - AT
[image:25.595.44.553.69.339.2]Total 23 127 18 211 29 166 22 351 -
Table 7: Monthly heating energy demand and discomfort hours (based on the W+ climate scenario).
3.4. Phase three: Optimisation
As shown in the previous sections, adding an atrium to a dwelling decreases its annual energy
use but increases the number of discomfort hours in summer. Contrary, adding a courtyard to
a dwelling increases its annual energy use but decreases the number of discomfort hours in
summer. At this stage, it is tried to combine the models simulated in phases one and two to
optimise for both energy use and summer thermal comfort. It is assumed to have a flexible
open space inside the dwellings; in winter (October till April) covered by glass to form an
atrium and in summer (May till September) opened to the sky to form a courtyard. In this
regard, the two mentioned aspects – annual heating energy demand and summer thermal
comfort - are the main parameters for the optimisation. Therefore, in the beginning of this
and if the results show an increase in efficiency and thermal comfort, the duration of the
period will be shortened or widened.
For the first step of the optimisation, the monthly heating energy demand and the number of
discomfort hours are monitored in Table 6 and 7 (for the current climate and the KNMI’06
climate scenario W+, respectively). In this regard, from the energy point of view, Building IIa
is 7 kWh/m2 (in the current climate) and 5 kWh/m2 (in W+ climate) in a year more efficient
than its respective courtyard model (Building IIc). This difference is even bigger for Building
IIIa versus IIIc (13 and 7kWh/m2,respectively). Nevertheless, having a look at the summer
indoor operative temperature as illustrated in Figure 16, the number of discomfort hours in the
courtyard models is less than in their respective atrium models. Therefore, the combination of
the two modes (open or closed) should be precisely based on the advantages and
disadvantages of monthly performance of the models.
Table 6 and 7 show for each dwelling and for each month a summary of the heating demand
and number of discomfort hours based on the current climate and the KNMI’06 climate
scenario W+, respectively. The last columns show which of the dwellings, atrium or courtyard
situation, has the best performance concerning energy use and/or summer thermal comfort.
The courtyard models have a lower number of discomfort hours and higher heating energy
demand in comparison with their atrium models. Therefore, for an optimised model the
advantages of the atrium should be used for winter (limiting heat losses), whereas the
advantages of the courtyard should be used for summer (reducing overheating). According to
the simulations, it would be efficient if the transitional space is open for about 4 to 6 months
(starting in May; ending in August, September or October) and be covered for the rest of the
year. For this optimised model and in the context of the current climate, the heating energy
demand of Building IIo will be 26 kWh/m2 in a year, and the discomfort percentage in
discomfort hours. Regarding the future climate scenario (W+), the heating energy demand of
the Building IIo will be 18 kWh/m2 in a year, and the discomfort percentage in summer will
be 12%. Moreover, for Building IIIo it will be 22 kWh/m2/yr for heating demand and 15% for
discomfort hours.
Finally, at the end of the optimisation, it is useful to mention if all the optimisations have led
to a more efficient building rather the reference model (Building I). Tables 8 and 9 compare
Building I with optimised models in the contexts of current and W+ climate scenarios.
Comparing the Buildings IIo and IIIo with Building I, the heating energy demands are equal
while the summer discomfort hours are one third and half of Building I, respectively.
Month Building I Building IIo Building IIIo
Heating kWh/m2 Discomfort hours Heating kWh/m2 Discomfort hours Heating kWh/m2 Discomfort hours
Jan 8 - 7 - 9 -
Feb 5 - 4 - 5 -
Mar 3 - 3 - 3 -
Apr 1 0 1 0 0 0
May 0 2 0 0 0 0
Jun 0 56 0 26 0 31
Jul 0 36 0 14 0 22
Aug 0 31 0 5 0 5
Sep 0 0 0 0 0 0
Oct 1 0 1 0 1 0
Nov 4 - 4 - 4 -
Dec 6 - 6 - 7 -
[image:27.595.117.478.345.726.2]Total 28 125 26 45 30 58
Month Building I Building IIo Building IIIo Heating kWh/m2 Discomfort hours Heating kWh/m2 Discomfort hours Heating kWh/m2 Discomfort hours
Jan 6 - 6 - 7 -
Feb 3 - 3 - 4 -
Mar 2 - 2 - 2 -
Apr 0 0 0 0 0 0
May 0 28 0 2 0 8
Jun 0 96 0 58 0 63
Jul 0 73 0 40 0 52
Aug 0 134 0 27 0 43
Sep 0 0 0 0 0 0
Oct 0 0 0 0 0 0
Nov 2 - 2 - 3 -
Dec 5 - 5 - 6 -
[image:28.595.118.477.94.475.2]Total 18 331 18 127 22 166
Table 9: Monthly heating energy demand and discomfort hours (based on the W+ climate scenario).
4.
Conclusions
In this paper, the effects of transitional spaces on the annual heating energy demand and
summer thermal comfort were discussed. A Dutch mid-terraced dwelling was selected as a
reference model- Building I (based on AgenstchapNL; Netherlands Ministry of Economic
Affairs). As phase zero, this model was simulated in the contexts of five weather conditions in
the Netherlands. The first one is representative of the current climate; the other four represent
four climate scenarios for the Netherlands in 2050: G (moderate), G+ (moderate, changed air
showed that because of climate change, the heating energy demand of Building I decreases
and the number of discomfort hours in summer increases.
Therefore, in the next phase, the effect of a courtyard or patio was tested to see if it can
increase the energy efficiency or indoor summer thermal comfort. In this regard, an actual
courtyard dwelling in Amsterdam (Building IIc) and a virtual courtyard dwelling (Building
IIIc developed from the reference model) were simulated. The results showed that the
courtyard reduces the indoor operative temperature in summer, and consequently the number
of discomfort hours, but increases the annual heating demand of the dwelling.
Therefore, in the next phase of the study, the courtyards were covered by a glazed roof to
reduce the heat losses in winter. Covering the courtyard indeed led to a lower heating energy
consumption of the models but also led to more thermal discomfort in summer. Finally, in the
last phase, the advantages of the courtyard and atrium models were the subjects for
optimisation. This optimisation was based on the monthly behaviour of the models. A
combined model was introduced optimising the monthly heating energy demand in winter and
thermal discomfort in summer. Simulations showed that the optimal period of having an open
courtyard is at least between the four months of May until August. In the period from
November until April, the courtyard should be covered with glass. Due to the moderate
situation in September and October, both the courtyard or atrium modes perform equally well.
Comparing the optimised Amsterdam (Building IIo) and virtual models (Building IIIo) with
the reference model (Building I), the heating energy demands are equal while the summer
discomfort hours are one third and half of the reference model, respectively.
Consequently, this paper showed that climate change influences heating energy demand and
summer thermal comfort. Open transitional spaces can be a way to reduce overheating.
Moreover, the application of these spaces should be in consideration of winter to avoid heat
for using an open space in a year in the specific climate the Netherlands is between May and
August (and can last till October).
Acknowledgements
The authors would like to acknowledge Mr. Dick de Gunst for providing us with the
documents of the Amsterdam courtyard house and Dr. Wim van der Spoel for developing the
References
1. Reynolds, J.S., Courtyards: Aesthetic, Social and Thermal Delight. 2002, New York: John Wiley.
2. Chun, C., A. Kwok, and A. Tamura, Thermal comfort in transitional spaces— basic concepts: literature review and trial measurement. Building and Environment, 2004. 39(10): p. 1187-1192.
3. Pitts, A. and J.B. Saleh, Potential for energy saving in building transition spaces. Energy and Buildings, 2007. 39(7): p. 815-822.
4. Sharples, S. and D. Lash, Daylight in Atrium Buildings: A Critical Review. Architectural Science Review, 2007. 50(4): p. 301-312.
5. Aldawoud, A. and R. Clark, Comparative analysis of energy performance between courtyard and atrium in buildings. Energy and Buildings, 2008.
40(3): p. 209-214.
6. Muhaisen, A.S., Solar Performance Of Courtyard Buildings. 2010: VDM Verlag.
7. Ghaddar, N., K. Ghali, and S. Chehaitly, Assessing thermal comfort of active people in transitional spaces in presence of air movement. Energy and Buildings, 2011. 43(10): p. 2832-2842.
8. Taleghani, M., M. Tenpierik, and A. Dobbelsteen, Environmental Impact of Courtyards- A Review and Comparison of Residential Courtyard Buildings in Different Climates. Green Building, 2012. 7(2): p. 113-136.
9. Yang, X., Y. Li, and L. Yang, Predicting and understanding temporal 3D
exterior surface temperature distribution in an ideal courtyard. Building and Environment, 2012. 57(0): p. 38-48.
10. Fathy, H., Natural energy and vernacular architecture: principles and
examples with reference to hot arid climates. 1986, Chicago: The University of Chicago Press.
11. Oliver, P., Dwellings: The house across the world. 2003, Oxford: Phaidon Press Ltd.
12. Givoni, B., Climate Considerations in Building and Urban Design. 1998: Wiley.
13. Berkovic, S., A. Yezioro, and A. Bitan, Study of thermal comfort in courtyards in a hot arid climate. Solar Energy, 2012. 86(5): p. 1173-1186.
15. Steemers, K., et al., City texture and microclimate. Urban Design Studies, 1997. 3: p. 25-50.
16. Day, C. and S. Roaf, Ecohouse: A Design Guide. 2012: Taylor & Francis.
17. Rajapaksha, I., H. Nagai, and M. Okumiya, A ventilated courtyard as a passive cooling strategy in the warm humid tropics. Renewable Energy, 2003.
28(11): p. 1755-1778.
18. Sharples, S. and R. Bensalem, Airflow in courtyard and atrium buildings in the urban environment: a wind tunnel study. Solar Energy, 2001. 70(3): p. 237-244.
19. Haw, L.C., et al., Empirical study of a wind-induced natural ventilation tower under hot and humid climatic conditions. Energy and Buildings, 2012.
52(0): p. 28-38.
20. Okeil, A., In search for Energy efficient urban forms: the residential solar block, in the 5th International Conference on Indoor Air Quality, Ventilation and Energy Conservation in Buildings Proceedings. 2004: Toronto.
21. Okeil, A., A holistic approach to energy efficient building forms. Energy and Buildings, 2010. 42(9): p. 1437-1444.
22. Al-Hemiddi, N.A. and K.A. Megren Al-Saud, The effect of a ventilated interior courtyard on the thermal performance of a house in a hot–arid region.
Renewable Energy, 2001. 24(3–4): p. 581-595.
23. Meir, I.A., D. Pearlmutter, and Y. Etzion, On the microclimatic behavior of two semi-enclosed attached courtyards in a hot dry region. Building and Environment, 1995. 30(4): p. 563-572.
24. Edwards, B., Courtyard Housing: Past, Present, Future. 2006: Taylor & Francis Group.
25. Short, C.A., M.J. Cook, and A. Woods, Low energy ventilation and cooling within an urban heat island. Renewable Energy, 2009. 34(9): p. 2022-2029.
26. Laouadi, A., M.R. Atif, and A. Galasiu, Methodology towards developing skylight design tools for thermal and energy performance of atriums in cold climates. Building and Environment, 2003. 38(1): p. 117-127.
27. Ayoob, A.N. and J.L. Izard, Study of comfort in atrium design. Renewable Energy, 1994. 5(5–8): p. 1002-1005.
29. IPCC, Climate Change 2007, in The physical science basis. Contribution of the working group I to the fourth assessment report of the intergovernmental panel on climate change, S. Solomon, et al., Editors. 2007: Cambridge.
30. KNMI, in Climate Change Scenarios 2006 for the Netherlands. 2006, KNMI publication: WR-2006-01
31. DesignBuilder, DesignBuilder software User manual. 2009.
32. Chowdhury, A.A., M.G. Rasul, and M.M.K. Khan, Thermal-comfort analysis and simulation for various low-energy cooling-technologies applied to an office building in a subtropical climate. Applied Energy, 2008. 85(6): p. 449-462.
33. Senternovem, Referentiewoningen Nieuwbouw. 2006, Senternovem: Sittard.
34. Nicol, J.F. and M.A. Humphreys, Adaptive thermal comfort and sustainable thermal standards for buildings. Energy and Buildings, 2002. 34(6): p. 563-572.
35. Taleghani, M., et al., A review into thermal comfort in buildings. Renewable and Sustainable Energy Reviews, 2013. 26(0): p. 201-215.
36. van Hoof, J. and J.L.M. Hensen, Quantifying the relevance of adaptive thermal comfort models in moderate thermal climate zones. Building and
Environment, 2007. 42(1): p. 156-170.
37. Sourbron, M. and L. Helsen, Evaluation of adaptive thermal comfort models in moderate climates and their impact on energy use in office buildings. Energy and Buildings, 2011. 43(2–3): p. 423-432.
38. Borgeson, S. and G. Brager, Comfort standards and variations in exceedance for mixed-mode buildings. Building Research & Information, 2011. 39(2): p. 118-133.
39. Ferrari, S. and V. Zanotto, Adaptive comfort: Analysis and application of the main indices. Building and Environment, 2012. 49(0): p. 25-32.
40. Lomas, K.J. and R. Giridharan, Thermal comfort standards, measured internal temperatures and thermal resilience to climate change of free-running buildings: A case-study of hospital wards. Building and
Environment, 2012. 55(0): p. 57-72.
41. Filippín, C. and S. Flores Larsen, Summer thermal behaviour of compact single family housing in a temperate climate in Argentina. Renewable and Sustainable Energy Reviews, 2012. 16(5): p. 3439-3455.
43. ASHRAE, ASHRAE Standard 55–2010 in Thermal Environmental Conditions for Human Occupancy. 2010, ASHRAE Atlanta, GA.
44. Kottek, M., et al., World Map of the Köppen-Geiger climate classification updated. Meteorologische Zeitschrift, 2006. 15(3).
45. NEN-5060, Hygrothermische Eigenschappen van Gebouwen
Referentieklimaatgegevens. 2008, Nederlands Normalisatie-Instituut (NNI). 46. NEN-5128, Energieprestatie van woonfuncties en woongebouwen -
Bepalingsmethode. 2004.
47. KNMI, in Klimaatschetsboek Nederland; het huidige en toekomstige klimaat. 2009, KNMI: De Bilt.
48. Spoel, W.H.v.d. and E.v.d. Ham, Pilot effect klimaatverandering op
energiegebruik en besparingsconcepten bij woningen, in report MO11110006 for Agentschap NL, TU Delft. 2012: Delft.
![Figure 1: Four climate scenarios for the Netherlands in 2050 [30].](https://thumb-us.123doks.com/thumbv2/123dok_us/8712890.882380/5.595.205.388.157.330/figure-climate-scenarios-netherlands.webp)
![Figure 4: The Dutch Agentschap NL mid-terraced reference dwellings [33].](https://thumb-us.123doks.com/thumbv2/123dok_us/8712890.882380/8.595.73.526.525.658/figure-dutch-agentschap-nl-mid-terraced-reference-dwellings.webp)


![Figure 7: Comfort bandwidths of ASHRAE 55-2010 [43].](https://thumb-us.123doks.com/thumbv2/123dok_us/8712890.882380/11.595.125.469.522.727/figure-comfort-bandwidths-ashrae.webp)


