Memorandum Series No. 154 .
i
The OECD Social Indicator Development Programme:
Selected tabulations of Irish data in the areas of
housing, health and working life
¯ .. ¯ 4. ..¯
{
N. Bolger and E. E. Davis
January 1983
Pr|ce £4
Confidential: Not to be quoted
until the permission of the Author
/
TABLE OF CONTENTS
i. 2. "3 ¯ 4. 5. 6.
List of tables
Introduction
Background to OECD work on social indicators
Description of ESRI data sources
Table specifications and layout
Standard footnotes
Selected tabulations (grouped under main indicator headings) :
Short-term disability Long-term disability At~qoical work schedule Work environment nuisances Indoor dwelling Space
Access to outdoor space Basic amenities
Proximity of selected services Fear for personal safety
Refer enc e s
Table
SHORT-TERM DISABILITY
1 Average number of temporary disability days per person in the whole population: 1977
.
¯ Average number of temporary disability days per person by individual characteristics: 1977
Average number of bed days due to temporary disability per person, by individual characteristics: 1977
LONG-TERM DISABILITY
Percentage of the population restricted in daily activities because of long-standing health conditions, by level of restriction: 1977
Percentage of the population restricted at all in daily activities because of long-standing health conditions, by individual characteristics: 1977
’’S Distribution of the long-term disabled by household
type: 1977
4 Percentage of the population with selected types of ¯ functional disability by age and sex: 1977
¯ ATYPICAL WORK SCHEDULE
1
2~
3
4
Percentage of employed with atypical work schedules: 1978
Percentage of employees working in shifts, by selected individual characteristics, and sector of activity: 1978
Percentage of employed working at night, by selected individual characteristics, and sector of activity: 1978
Percentage of employed working on Sundays and public holidays by selected individual characteristics, and
sector of activity: 1978
WORK ENVIRONMENT NUISANCES
1 Percentage of employed reporting regular exposure to specific nuisances in their work environment by ¯socio-economic status and sex: 1978
(ii)
LIST OF TABLES (Continued)
INDOOR. DWELLING SPACE
Distribution of the private household population by density of occupation of dwellings: 1977
2 Density of occupation of dwellings by selected characteristics of head of household: 1977
8 Percentage of private household population living in dwellings occupied by more than one person per room, by selected individual characteristics: 1980
ACCESS TO OUTDOOR SPACE
Percentage of households in dwellings with balcony/ terrace and/or private garden, by selected characteristics of head of household: 1977 lbiS
Percentage of private ¯household population in dwellings with balcony/terrace and/or private garden, by selected individual characteristics: 1977
2 Percentage of urban private households having access from their dwelling to an area of open space within a stated time, by selected characteristics of head of household: 1977
his
Percentage of urban private household population having access from their dwelling and within a stated time to an area of open space by selected individual ¯
characteristics: 1977
BASIC AMENITIES
1 Percentage of the private household population in dwellings with specific amenities: 1977
-Percentage of private households in dwellings lacking one of the ¯amenities, by selected characteristics of the head of household: 1977
LIST OF TABLES (Continued)
PROXIMITY OF SELECTED SERVICES
1
2
Percentage of the private household population having access from their dwelling and within a stated time to selected services: urbanand rural population: 1977
¯ Percentage of the private household population having access from their dwelling within a normal walking distance of 20 minutes to a store satisfying daily needs, by characteristics of head of household and of
individuals: 1977
-3 Percentage of the private ¯household population having access from their dwelling within a normal walking distance of 20 minutes to a post Office, by
characteristics of head of household and of individuals: 1977
FEAR FOR PERSONAL SAFETY .
Percentage of the population afraid to walk alone in their neighbourhood at night, by selected individual characteristics: 1977
51
53
55
-i-1. Introduction
This document contains a set of social indicator tables requested
recently by the OECD via the Department of Finance. They represent part
of aproject which has been in operation since 1971, the aim of which is to
produce accurate measures of social well-being to aid the formulation and
monitoring of social policies.
The tables consist of unpublished data collected at ESRI in the form
of two nationwide social surveys. The data requested, together with the
specific disaggregations, reflect the overall priorities of the OECD rather
than those of interested parties in Ireland. However, as will be outlined
later, considerable effort was expended at OECD in developing a set of indicators
and disaggregating variables ¯which might prove useful to social scientists and
policy-makers. Consequently, in advance of their publication by the OECD
at some future date, and of detailed Irish reports on the original two surveys,
it was thought useful to provide access to these tabulations.
The remainder of this document is organised as follows: first, a brief
history of OECD Social Indicator Development Programme is given; following
this, the two social indicator surveys at ESRI are described, along with some
information on the general format of the tables; finally, the tables themselves
are provided.
2. .Background to OECD work on social indicators
The OECD Social Indicator Development Programme has been organised
into three distinct phases, the first two of which have now been completed. ¯Phase
areas of concern within which specific social measures could be developed.
This phase culminated in the production of a ’!List of Social Concerns Common
to most OECD Countries" (OECD, 1973) in which broad areas such as health,
education, employment, leisure and the physical environment were identified
as important foci for the work of the second phase.
Phase 2, which began in 1973, proceeded with the development of
specific indicators and resulted in 1976 with the publication of a provisional working
list of social concerns and indicators (OECD, 1976). At this point more intensive
work was undertaken within many social concern areas with the establishment of
fifteen groups (called Common Development Efforts or CDEs). These
sub-groups were composed of experts in specific social areas whose task was to produce
a serviceable list of indicators for implementation in the final phase of the
programme.
This developmental work resulted in the adoption by the Council of OECD
of a "1980 List of Social Indicators". This list of social indicators, which was
considerably more restricted in range than was originally envisaged, represented¯
a compromise between the aim of accurately reflecting all aspects of social
well-being and the need to produce a list of indicators which would be both compatible
¯ with existing national data-bases and available for use in a reasonable¯ period
of time.
Following the adoption of the 1980 list, the OECD Secretariat set about
work on the final phase of the programme. The main thrust of this work appears
to be the collection of data compatible with the specifications of the list from
member countries. The aim is to produce a "Compendium of Social Data" based
3
--process was begun toward the latter part of 1981 with the issuing of a request
to member countries to provide available data in specific tabular formats. In the case of Ireland, this request was channeled through the Department
of Finance to specific sources such as the CSO, the Department of Education and
the ESRI.
Thus, it can be seen that the specific requests are informed by
develop-mental work covering more than ten years. The role of ESRI in providing
tabulations stems from its involvement in two nationwide surveys sponsored by
the EEC in the late 1970s. The following section provides background information
on these surveys.
3. Description of ESRI data sources
As part of separate work on social indicators sponsored by the EEC,
¯ two nationally representative surveys were fielded in member states in 1977 and
1978. The first of these surveys collected objective data and subjective perceptions
in the areas of housing, physical and mental health and health service utilisation.
Thus, this survey provides information on objective characteristics of housing,
such as number of rooms, possession of facilities such as central heating and
bath, availability and proximity of neighbourhood amenities, et0., while also
¯ measuring subjective evaluations of the adequacy of the above (e.g., ¯perceived overcrowding, satisfaction with household facilities).
Similarly, in the area of health, information was collected on the respondents’
illness history, their present functional abilities¯ with regard to reading, climbing
stairs, etc., together with subjective assessments of their state of health. In
on doctor visitations and hospital stays, along with information on timing, nature
of the illness, etc. Furthermore, assessments as to the adequacy of these
services were also obtained.
The second EEC survey focussed on the quality of working life and once
again collected a variety of data, both subjective and objective¯ In this survey,
five separate questionnaires were used, depending on the work status of this
respondent: employed, unemployed, retired, housewife or persons with no work
experience. The data collected ranged from work histories of the employed and
unemployed, together with the nature of their work and the stresses experienced
on the job, details of absenteeism due to sickness, similar retrospective
informa-tion from retired persons, and finally, housewives’ percepinforma-tion of their work in
the home, together With their orientation toward future labour market work.
As can be seen from the above, a large volume of data has been collected
in these surveys. As yet, analyses of these data have not been published; however,
two reports based on the Irish data have been submitted to the Statistical Office of
the European Communities in Luxembourg (Davis, Fine-Davis, Meehan and Downey,
1980; Fine-Davis, Davis, and Bolger, 1981).
The social indicator tables requested by OECD cover only a small portion
of these data, yet, nevertheless, touch on a number of the areas alluded to above.
The next section describes the general nature of these tables, their format,
disaggregations and footnotes.
¯ Table specifications and layout
The main noteworthy points on this topic are outlined below.
a¯ Symbols used in the tables
0 in cells where no group of this kind exists in Ireland¯ ¯ in cells where this sub-population exists (and is included in
[image:9.595.39.553.14.821.2]--
5--blank no data on this (sub) indicator available.
b, Footnotes
As per OECD instructions, these are contained on a separate page in
each case. As many tables share some footnotes in common, to simplify
matters, a set of standard footnotes has been prepared (see page 6) which
are referred towhere appropriate.
c. Disaggregations
These vary from indicator to indicator but usually consist¯ of age, sex,
socio-economic status, household type and Community size. For the
work-related variables, manual/non-manual and branch of activity tend to be also
used.
d..Sample sizes
In all tables, where appropriate, the row and column £s (on which rates,
percentages, etc., are based) are included. In many cases, due to missing
data, the sample sizes in the table will vary depending on the particular
disaggregating variable.
e. Time of data collection and source
The original request from OECD specified 1980 as the preferred year
for which data should be provided. In addition, a number of time series
¯ were requested. As the ESRI data covers only 1977 and 1978, depending
on the indication, these have been provided instead. In all tables the original
5, Standard Footnotes
(a) Reference population is all persons aged 18 years and over. ¯ ’
(b) Information on sector of economic activity not available: therefore, employed are treated as single category,
self-(c)
(d)
Community size is defined as follows:
Very large metropolitan areas Large metropolitan areas
Other urban
Rural
Branch of activity categories derived from as indicated:
¯Agriculture
Indus try
Other
(e)
= Dublin
= Cork, Limerick, ¯ Galway and Waterford
= All other towns of population greater than 500
= All other towns of 500 or less/ open country
combining the following codes
Owner =
Renter =
-7-The symbol "0" indicates that a particular cell in a tabulation is empty. However, as these data refer to a sample survey, it is not possible to infer from this that the group defined by such a cell does not exist in the population.
To avoid confusion with the above, the symbol "zero" has been used where a particular cell in a tabulation is not empty but whose percentage value rounds to zero.
¯ , . - . . ¯ "-" .,2 . .. ". ,.- ": -~ :’"
HEALTH
I" ’ (social concern)
-:
Indi’cator: SIIORT-TE~.~ DISABILITY ¯
Reference Population: All Persons Aged I Y’ear or More(O)
" TABLE I: Avera~e(2)*Ntumber of Tempo.rary Disabiiit.v Days(i)
.~: -. per Person in the ~’~hole Population: 1977
¯ ,
,
June 1977 (3)
(3)
i9B0(3)Disability Days Total of which: bed days Total of which : bed days Total of which : bed day
Underlying conditions:
° ~ .
-accidents - other
1~ = 2019 N = 2019
Total
1 .4
4.2NOTES
(0) Please specify, if different age llmi% used:
(I) ¯Disability days: day on whichan individual has to put down on his usual level of activity, because of illness¯ or inJury~
(2) Average is usually calculated from disdbility days within a period of fixed duration (e.g, two weeks), reported through surveys. Results should then¯be¯ extended on a year basis.
¯ ~3) Please indicate number of times a year the survey is taken, and method used tO derive average.
I
~o
[image:14.821.0.796.35.595.2]Indicator: SHORT-TERM DISABILITY
Footnotes: Table I
(o)
(1)
(2)*
(3)
See Standard Footnote (a).
Number of disability days derived from responses to the following question:
"Looking back over the past four weeks ... for how many days, if any, were you unable to carry out normal
activities because of illness ? (or injury)?"
Number of bed days derived from the following question:
"Looking back over the past four weeks ... for how many days were you kept in bed at home?"
Average disability days and bed days derived from annualized estimates based on once off survey data collected in June 1977. As these measures are highly seasonal, the validity of this exercise is questionable. The figures provided are highly likely to underestimate the true annual levels of short-term disability.
Survey taken once only; average refers to the arithmetic mean, i.e. :
n
i=l
11
[image:16.595.27.551.18.782.2]-SIIORT-TEI’J.I D!SABILITY (cont.)
TABLE 2: Averace ~u,~ber of TemT~orarv Disabilltv Days Per Person(I) by Indiviaual Charac%eristlcs: 1977(2) "
(aays)
Year: 1977 I Females Males Total
N = 996 N = 993 N = 1989
A~
I -14
18- 24 8.6 6.2 7,3
25 - 44 7.9 4.8 6,3
45 - 64 - 14,1
65+ 19.1 15.5 17.6
ALL AGES 10.5 11.9 11,2
Socio-Economic e ~, (3)~ta ~ us N = 987 N = 964 N = 1951
self-employed agricultural] :
self-employed non- [ m 6.0 5.6
agricultural .J
nom-manual employees 9.8 3.5 6.1
manual employees 16.1 9.6 11.1
ALL ACTIVE 10.5 7.7 8.4
of which: unemployed 17.5 14.8
home-makers 10.1 I0.0
students
recipients of retirement
and disability pensions 25.3 38.7 34.5
ALL NOT ACTIVE 11.3 35.0 15.6
.... I
,(4)
Community Size N = 986 N=973 N .= 1959
very large metropolitan areas 14.3 11.9 13.3
large metropolitan areas 12.2
other urban 8.0 8.2 8.1
rural 13.4 9.9 Ii.5
N =227 N = 716 N = 682 N =364
N = 290 N = 297 N = 4O2 N = 989 N= 75 N = 664 N= 16 N =207 N = 887
N =470
N = 214 N = 391 N = 884
~OTE____~S
(I) See Table I.
Indicator:
Footnotes: Table 2
(1)
(2)
(3)
(4)
See Standard Footnote (a)
See Table I (2)*
See Standard Footnote (b)
See Standard Footnote (c)
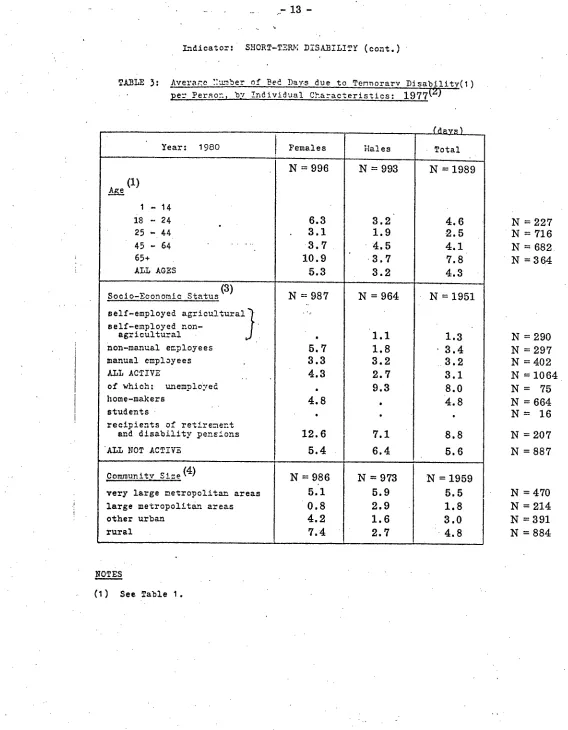
TABLE 3:
13
-SHORT-TE~M DISABILITY (cont.)~
Averace N’&mber of Bed Dav.s due to Temnorarv D~sability(1) ~e~ Persor.) by Individual Characteristics: 1977(z)
(days) Year: 1980 Females Males Total
N = 996 N = 993 N = 1989
(1)
1 -14.i8 - 24 6.3 3.2’ 4.6
25 - 44 3.1 1.9 2.5
45 - 64 ... 3.7 4.5 4.1
65+ 10.9 ~3.7 7.8
ALL AGES 5.3 3.2 4.3
Soclo-Economlc Status(3) N = 987 N = 964 N = 1951 self-employed agricultural ~
self-employed non- l’
agricultural ~J 1.1 1.3
non-manual employees 5.7 1.8 ’3.4
manual employees 3.3 3.2 3.2
ALL ACTIVE¯ 4.3 2.7 3.1
of which: unemployed 9.3 8.0
home-makers
4.8
4.8
students ¯ I
recipients of retirement
and disability penelons 12.6 7.1 8.8
’ALL NOT ACTIVE 5.4 6.4 5.6
Community~_:e°~ (4)
¯ b N = 986 N = 973 N = 1959
very large metropolitan areas 5.1 5.9 5.5
large metropol!t~u areas 0,8 2.9 1.8
other urban 4.2 1.6 3.0
rural 7.4 2.7 4.8
17 = 227 N =716 N = 682 N = 364
N = 290 N = 297 N =4O2 N = 1064 17= 75 N = 664 N= 16 N =207 17 = 887
N = 470 N = 214 N =391 N = 884
HOTE____S
(I) See Table I.Indicator: SHORT-TERM DISABILITY
¯ Footnotes: Table 3
(1) See Standard Footnote (a)
(2) See Table 1 (2)*
(3) See Standard Footnote (b)
Per.,ons restricted in their daily activities
[image:20.821.85.803.21.569.2]- as a percentage¯
TABLE 1 :
LONG-TERM DOABILITY
Reference Population: k~ole Po~u!ation
Percentage of the Pooulation(I) Restricted in Dai!~ Activities(2) because of Long-standing(3) Health
~onditions~Lby Level of Restric±ion - 19._z, 19.., 1980
.°
/ "
I
(perdentages)
-19 77 19..
! 980
to any extent ( 3 )
to a great to my. to a great
extent(3) extent(3) extent(3) to anyextent (3) to a greatextentr~
!
27 Zero(5)
|., ..
of the whole population(1)
- Of whieh~conditions resulting ({~om accidents
(1) Please notify partial coverage of population:
!
I
. (2) Restriction relatively to kind or level of activities normal to the group. Question asked: Do youhaveany illness, etc., that has troubed you for at least last year ...
(3) Please indicate criteria applied.
Indicator: LONG-TER.M DISABILITY
Footnotes: Table 1
(1)
(2)
(4)
(5)
See Standard Footnote (a)
Restriction defined on basis of foliow.~,ng question:
"Do you yourself have any illness, physical disability that has troubled you for at least the past year or is likely to go on troubling you in the near future? (YES/NO)"
Extent of restriction disaggregated according to whether respondent was bedfast/wheelchair user (e.g., restricted "to a great extent") or not.
Disaggregation not available.
-
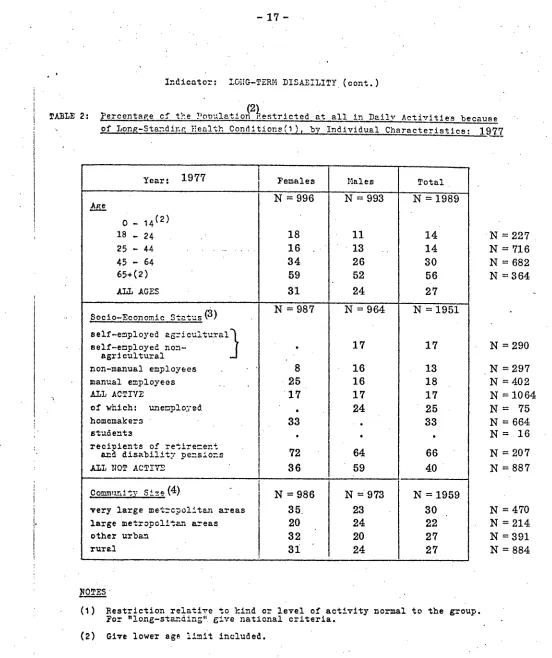
17-TABLE 2:
Indicator: L0],~G-TERM DISABILITY (cont.)
(2~
Fercenta~,e cf ~he ~2ooulation ~.estricted at all in Dai!v Activities because of Long-Sta~ndinq Health Conditions (1 )~ by. Individual Characteristics: 1977
Year: 1977 i
1
Females Males TotalN = 996 N = 993 N = 1989 o - 14(2)
18 . 24 . 18 11 14
25 - 44 ... 16 ¯ 13 .. 14
45 - 64 34 26 3O
65+(2) 59 52 56
ALL AGES 31 24 27
Soclo-~concmlc ... (3) N = 987 N = 964 N = 1951
self-employed agricultural~
self-employed non- 17 17
agri cultural 3
non-manual employees 8 16 13
manual employees . 25 16 18
ALL ACTIVE 17 17 17
of which: unemplo’,’ed 24 25
homemakers 33 33
stud ent 3 !
recipients of ~ ~-’-- ," "~÷. ~ e .I_ e_e... I
and disability pensions 64 66
Al’r, NOT ACT’rT2 I
72
, 36 59 4O
!
Ccmmun’.ty Size (4) I N = 986 N =973 N = 1959
very large metrcpo!itan areas 35. 23 30
large metropollt~n areas 20 24 22
other urban 32 20 27
rural 3i 24 27
N =227 N = 716 N = 682 N =364
N = 290 N = 297 N =402 N = 1064 N = 75 N = 664 N = 16 N =207 N =887
N = 470 N = 214 N = 391 N = 884
NOTES’ ¯ ..
(1) Restriction relative to kind or level of activity normal to the group. For "long-s~mnding" give national criteria.
(2) Give lower ag~ limit included.
SOURCE OF DATA:
?
[image:22.597.30.582.24.682.2]Indicator: LONG-TERM DISABI LI TY
Fo0tnotes: Table 2
(1)
(2)
(3)
(4)
See Table 1 (2)
See Standard Footnote (a)
See.Standard Footnote (b)
1977
19..
... p, i ill JH
[image:24.821.106.805.22.488.2]1980
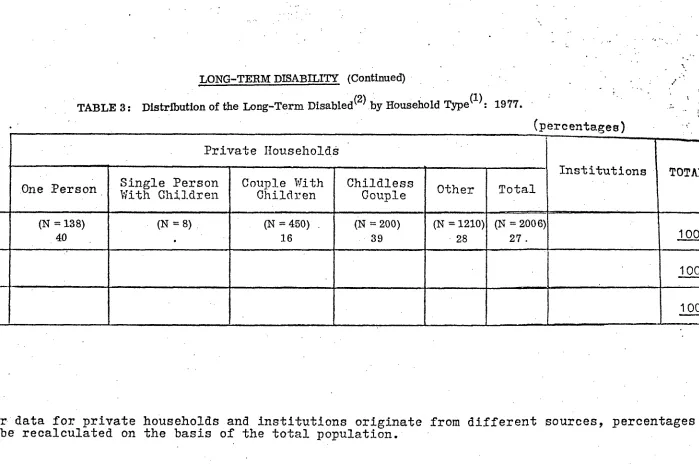
TABLE 3 :
LONG-TERM DISABILITY (Continued)
Distribution of the Long-Term Disabled(2) by Household Type(l): 1977.
One Person
.m , i,, , (N = 138)
4O
Private
.., L J,
Single Person
With Children
(N = s)
IIouseholds
Couple With
Children
i,
(N = 450)
16
Childless
Couple
(N = 200) ¯ 39
Other
,.. ,,, (N = 1210)
28
m , ~ __
Total
(N = 2006)
27.
,?
(percentages)
Institutions
ii, , ",
l
TOTA
100
10C
NOTES
(1)
~’~enever data for private
should be recalculated on
SOL~..CE OF DATA:
households and institutions originate from
the basis of the total population.¯
EEC sponsored Housing, Health and General Attitudes Survey
different sources, percentages
I
Indicator: LONG-TER, M DISABILITY
Footnotes: Table 3
(1) See Standard Footnote (a)
21
-¯
?
[image:26.595.21.572.27.473.2]Indicator: LONG-TERM DISABILITY
Table 4: Percentage of the Population(l)with Selected Types of Functional Disability, by Age and Sex: 1977
a. Percentage of the population finding it impossible to see adequately "to read an article in a daily newspaper (with glasses)".
Year: 1977 Females Males Total
Age N = 992 N = 988 N = 1980
18 - 24
0(2)
0 0 "25 - 44 ¯ Zero(2) 1 1
45 - 64 1 2 2
65+ 6 1 4
All Ages 2 1 2
N = 226 N = 713 N = 678 N=363
b. percentage of the population finding it impossible "to hear what is being said in a conversation between several people (with hearing aid)"
Year: 1977 Females Males Total
¯ Age N = 993 N = 988 N = 1981
18 - 24 0 0 0
25 - 44 .0 0 0
45 - 64 O 0 0
65+ 2
1
2All Ages 1 Zero Zero
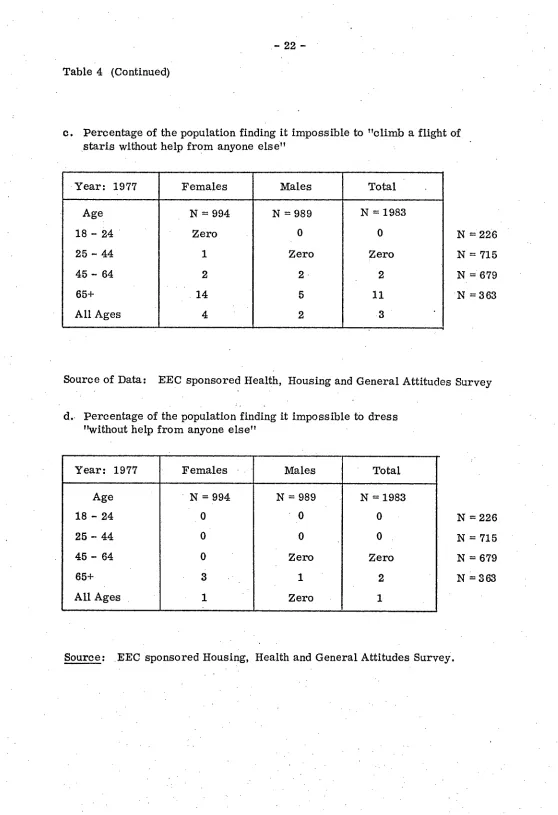
Table 4 (Continued)
c. Percentage of the population finding it impossible to "climb a flight of staris without help from anyone else"’
¯ Year: 1977 Females Males Total
Age N = 994 N = 989 N = 1983
18 - 24 " Zero 0 0
25 - 44 1 Zero Zero
45- 64 2 2- 2
65+ 14 5 11
All Ages 4 2 3
N = 226 N = 715 N = 679 N = 363
Source of Data: EEC sponsored Health, Housing and General Attitudes Survey
d.. Percentage of the population finding it impossible to dress "without help from anyone else"
Year: 1977 Females Males Total
Age ¯ N=994 N = 989 N = 1983
18 - 24 0 0 0
25 - 44 0 0 0
45- 64 0 Zero Zero
65+ 3 , . 1 2
All Ages 1 ’ Zero 1
N = 226 N = 715 N = 679 N =363
[image:27.595.15.573.3.818.2]- 23
Indicator: LONG-TER.M DISABILITY
Footnote: Table 4
(1) See Standard Footnote (a)
Indicator: ATYPICAL WORK SCHEDULE (cont.)
[image:29.821.31.799.28.584.2]Reference Population: employed persons
TABLE I :
Percentage of Employed with ~Atypical Work Schedule
i978
(percentages)
Year
1 9 78(1)
19..1980
(2)
(N = 936)
Shift Work, total:
13
of which:- fully continuous
shifts
partly continuous
shifts
rotating shifts
split shifts
Night Work
(N = 93 6)J
regularly
9occasionally
9
Work on Sundays, and Public
¯ (N = 936)"Holidays ....
regularly
31occasionally
16
, , ,,,,
I
t~ h~
-
25-Indicator: ATYPICAL WORK SCHEDULE
Footnotes: Table 1
(1) Data derived from a once off sample survey fielded in July 1978. Coverage: non-institutionalized population age 18 years and over.
TABI~ 2.
Selected individual Characteristicsz,.and Sector of Actlvitv: 1978
(percentages)
Year: 1978 Female Mal e Total
N = 200 N = 450 N = 650
18 - 24 10 14 12
25 - 44 5 21 17
45 - 64 13
65 and ove~
~
(5) 0(5) Z01(5)AGES 7 17 14
non-m=uaZ e=plo[#~s
N = 200 N = 450 N = 650
8 15 11
manual employees ’6 19 16
N’= 450
Household T~e ¯ N = 200 N = 650
one person "
single person wi~h child(ten)
couple with child(ten) e 2,1 21
childless couple .. 7 ¯I 17
other private households 15 12
N ’ 200 ’ ~ ’’ I
~ran~h q,f .Activ±~y(4)
N = 450 N = 650
agriculture O
Industry . 12 19 18
others 6 18 13
N=17 N=31 N=15 N=7 N=29; N~5~ N=0 N=I6~ N=69 N~8] N=;31 N=22~ N=394
-
27-Indicator: . ATYPICAL WORK SCHEDULE
Footnotes: Table 2
(1)
(2)
(3)
Regular skills only.
See Table 1 (1)
Supervisors, foremen (either manual or non-manual) classified as non-manual employees.
Zndicator: ATY~I6AL WORK SCHEDULE (cont.)
~ABLE 3: Percentage of ~nloved Workln~. a± Ni~.ht(I) by Selected- , | ,
Individual Characteristics and Sector of Activity: 1978
" (percentages)
i ~ear: 1978 ¯ ~Female
Make Total
N = 235 N = 701 N = 936
¯18- 24 6 9 .. 8
25 - 44 7 13 12
45 - 64
65 and over 4(5) O8(5) 7(5) ’
ALL AGES 6 10 9
Soelo-Economic Status(3) N = 235 N = 701 N = 936
self-employed agricultural o 0 0
self-employed non-agricultural 17 14
men-manual employees 8 15 12
manual employees 3 11 10
Nousehold True N =235 N = 701 N =936
one person .2
single person with child(ten)
couple with child(ren) 15 15
childless couple . -7 "6:
other private households 6 8 8
Branch of Activity (4) N = 235 . N = 701
N =936
agriculture 0 0
industry I0 9
others ’ 6 17 13
N = 185 N =407 N = 302 N=42¯
N = 184 N = i02 N = 291 N =359
N=65 N=3 N = 223 N = 100 N = 545
N = 215 N =250 N = 471
NOTES ..
(I) At least once in a specified week; please give time considered as night:
. r
.SOUROE OP DATA: EEC- sponsored Working Life and General Attitudes SurVey
29
-Indicator: Atypical Work Schedule
Footnotes: Table 3
Night work defined as those working regularly between the hours of 10 p.m. and 6 a.m.
(2) ,~Iee Table 1 (1).
(3) See Table 2 (3).
~ABLE 4: Percentage of ~mnloved Workin~ on Sundays and Public Holidays(I), bY Selected Individual Characteristics and Sector of Activity: 1978
: (percentages)
Year: 1978 Female Male " ¯ ~otal
(2) N =235 N= 701 N = 894
18 _ 24 17. 26 22
25 - 44 14 29 26
45 - 64 24 45 42
65 ,and over ¯e
A~L AGES 17 36 S1
Soclo-Economle Status (3) N ~235 N = 701 N ~936
self-employed agricultural 22 72 7O
self-employed nonragrioultural . -35 36 " 35
non-manual employees 14 21 18
manual employees 13 22 2O
Rousehold .Type "N = 235 N = 701 N =936
one ~rson -31
single person with child(ten)
.couple with chi!d(ren) 30 SO
childless couple 39 35
other’ private households 15 36 30
, J,
Branch, of Ac~ivity (4) N = 235 N = 701 ¯N=936
agriculture 68 66
industry 13 10
others 20 30 26
N=185 N=40 7 N=302 N--42 N=184 N=102 N=291¯ N-359 N=65 N~ N=223 N=100 N=545 / N=215 N=250 N=471 NOTES
(-I) At least once in a specified month.
SOURCE OF DATA: EEC sponsored Working Life and General Attitudes Survey
31
-Indicator: ATYPICAL WOiRK SCHEDULE
Footnotes: Table 4
(1) Sunday work only; includes those working regularly only (i.e., every, every other, or every third Sunday).
(2) See Table 1 (1).
(3) See Table 2 (3)
¯ . . . " .
¯ " i "
by. Soclo-Eccnomlc Status and Sex: 1978
(percentages) o (D o Pb ;a t~ o o 0 t~ t~
E
t~ Soelo-Economic Status(2) Nuisancesself-employed self-employed non-manuel skilled manual unskilled agricultural non-agrlcultural .employees employees manual employees Drau=ht Female
Nale F&M IIIKh Tempera%ure Female
Male Y&M. Low Temperature: Female
l.iale
Dusts of Different,
F&H
Moisture, t/ater Female lisle F& i.1
Female (N=9)
21 (N=26)
lO
(N--132)
(N~8) 39(N~0)
kinds (3) " l-~al s (N=175) (N=76) 9 (N=159) 4i " (N--214) (N=77) F &I-I 4 (N=184) 18 (N=102). 9 (N=291) 36 (N--252) 31 (N=107) Polluted Air Female
Hale
Vibration, Heav~ Female
(N--9)
(N=26) " (I~’=182)(N4S)
(N~(~)Shakin~ (4) llale (N=175) (N=76) (N=159)
2"5 (N=2~4)
Ik (N=77) F&H ¯ 8. (N=184) 4 (N=I02) 3 (N--291) 23 (N=252) 11 (N=107) Noise (,5) Female22
(N=26) (N=132) (N~8)
(N~0)
tlale (N=76) 44 (N=214) $3 " (N=77)
F&I-I 6 (N=184) 19 (N=102) 18 40 (N=252)
s1 (N=I07)
.U.ncomfortable l~orkin~..Female
26
(N=9)
32
(N=26) (N=132)
N~8) ¯
(N~0) l’osition (6) Halo (N=175) (N=76) .47 (N=159) 42 ¯ /N--21~) 3:} (N=77)P & 14 26 (N=184) 24 (N=102) 6 (N=291) 3 7 (N=252) 25 (N=107), Heavv Llft!n~ (7) " Female "J (IN-~)
¯ Nale 58 (N=175)
(IN=Zti) Z . (i~=iS2)
3350 (N~o)
’ ’ 29 (N=76} ,
1~ "- H[ 49 (N=184)
7 (N=t59)
3i (N=2 4)
23 (N=102) 5 (N=291) 29 (N=251) (N=77)(N=I07)
¯
I
~o t~
[image:37.821.94.799.30.586.2]Indicator:
- 33 - "
WORK ENVIRONMENT NUISANCES
Footnotes: Table 1
(2)
(3) ’
(4)
(5)
(6)
(7)
Data derived on basis of following question: mvVhich of the following circumstances is particularly stressful in your work. Only mention things that occur regularly or often" (YES/NO).
Supervisors, Foremen (either manual or non-manual) classified as non-manual employees.
Present survey: "Inhalation of dust, gases".
Present survey: "Continuous exposure to vibration and jolting of tools or machinery" used in present survey.
Present survey: "Loud and persistent noise".
Present survey: ’"Working in awkward positions, i.e., working in tiring postures frequently or for long periods (bending, kneeling, lying down, working overhead).
Present survey: heavy tools".
I
population living In dwellings with a density of Oceupa%tcn of: average number
of per~ons per room
leee%h~ 0.5
0.5 %o less than t.O
more hen 1.0 & lees titan 1.5
~.0 end
more 1.5 to less
than 2.0
2.0 to lees
than. 3.0 I-.0 1o0
!
1OO I II
I O0 (perce~ rages) (Social Concern} .R" =12 1 N = 24812
N = 149’ 7
N~OI~
I O0
N = 2018 .- 0.86
¯ N = 907 45 N = 347
17
N = 296 15
N=59 3 1977
INDOOR DWEDLINO SPACE Indicator:
Reference Population: pr:tvaCe househoi~ population
Dls%rlbu¢lgn of the l~rlvate Roueehold Popula%Ion b7 Density of ~coupationt’) of l~elling~(z). 1977.
... "~
l’.U’r P~
¯ (1] Ilum~er o1 persons per room. . (2) Prlnclpal residences. "
(3) See S~ndard Footnote (a)
~;ot:,m~ oJ, iv:~.^: EEC sponsored Housing, Health and General Attitudes Survey"
¯ !nd£ca+or: L:DO0r, D;: "LLI:W, Z~:’,C~ (con+.)
~A]~LE 2: ])enz+~’’ nf .%ccur.ation of ]~.lellinxs h-, Se!ec~,e6 Charaeterls~ies of Head of Kousehold: 1977
(6) Percentage of
house-Characteristics of Average number of holds in dwellings head of household persons per room occupled by more ~an
L
one person per room, ,," ,, ,
A_Zm (i)
..
N~__-975 %
less than 25 ¯ N =21
25,- 44 0.88 25 N = 310
45 - 64 0.85 23 N = 410
65 and over 0.57 8 N --234
ALL AGES 0.80 20
=
988
S e._.x_x Pemale 9 N = 224
’F~le "
o. 57
0.86 23 N =’764Soeio-~conomie Status (2) N
self-employed agricultural I
~44
self-employed non-agricultural 0.76 20 ’N = 259
non-manual emplcyees 0.77 12 N = 155
manual employees 0.99. 30 N = 273
ALL ACTIVE 0.85 22 N = ~87
students ¯ N=0
reclpients,of retirement and dimabillty
.pensions 0.65
Nousehcld Tvve N 978
cnepersom. 0.31 ¯ 0(5)’ N=137
single person with child(ten) $ . N=7
couple .with child(ten) 0.98 28 N = 243
childless couples 0.48 3 N = 100
other prlvate, householis 0.90 24 N = 491
po= Iv Si e (s)
961very large metr0p01it~n areas. 0.82 22 N = 202
large metropolitan areas 0.82 24 N = 106
ether urban 0.75 14 N = 208
rural 0.79 20 N = 445
Tenure Status (4) N 984
OWZZ sr , 0.77 i8 . N = 784
tenant " 0.90
27
N = 185
~ther a . N=15
Tear of D~el!In~ + , N = 983
Up to. 195 .’ . 0.74 17 . N=569
1946- 1959 .+ ¯ 0.86
" ! " I 23
N = 171
since 1961¯ 0.84 ’, 21. N = 243
Indicator: INDOOR DWELLING SPACE
Footnotes: Table 2
(D,. (2), (3), (4),
respectively.
Indicator:
[image:42.595.19.580.44.809.2]
-37-I~DOOR D%’~LLIHGSPACE (.cont.)
TABLE 3:
Percentage of the Private Household Pooulation
Livinc in ~,lellin~s Occupied b- more than one
Person net Room, b27 Selected .individual .
Characteristics: 1980
0-14
I8 - 24
25 - 44
45 - 64
65 and over
ALL AGES
Community S~ (2)
very large metropolitan-~_ areas
large metropolita~n areas
other urban
rural
population in dwellings with
more than one person per room
(percentages)
N = 1988
35
N = 227
27
N = 715
23
N = 682
10
N =364
23
¯ N = 1958
25
N = 470
26
N = 214
18
N = 391
24
N = 883
Indicator: INDOOR DWELLING SPACE
Fo0tnotes: Table 3
(I) See standard footnote (a)
(2) See standard footnote (c)
Indica:or: ACCZSS ~’.u OU~D.00R SFACi
[image:44.595.11.567.21.782.2]Reference Population: private household population
TABLE I: Percentage of I’o’:seholds in Y~lellinns -~1~.~: B~.Iconv/Terrsce and/or Private Garden, by ,",elected Characteristics of He~d of Household: 1977.
(percentages) Households in Dwellings with:
Characteristics of (5)
Head of Household Balcony/Terrace 1¯ Garden(5) l Either Balc°ny/’ Terrace or Garden
J ,. ... , ,,,
(1) (N = 975)
less than 25 (N= 21) 25 - 44 (N= 310)
.45 - 64. (N =410) 91
65 aud over (N= 234) 9O
ALL AGES 91
Soclo-Economic Status(2) (N = 844)
self-employed agricultural
self-employed non-agricultural (N=25 93
non-manual empl6yees (N=155) 92
manual employees "’ (N=273) 88
~LZ. ACTZW (N=687) 91
Students (N=0)
recipients of retirement ar.d
aisability pensions (N=157) 9O
Co.unity Sire (3) (N = 961)
very large metropolitan a=eas(N=2(
2)
88large metropolitan areas (N=106) 91
otherurban (N=208) 85
¯ ural (N=445) 94
Household Tyue (N=978)
one person (N=137) 8O
single person with ohild(ren)(N=7)
oouple with ohild(ren) (N=243) 91
childless couples (N=I00) 89
other private households (N=491) 94 ~enure status (4) (N--984)
owner (N=784) 94 ¯ r
tenant (N=185) 77
other (N=IS)
Year of I)wellin~ (N--983)
before 1945 (N=569)
S8
1945 - 1970 (N=171) 97
since 1971 (N=243) 94 ,
¯ Footnotes : Table I
For footnotes (1), (2), (3), (4~ (5), see Standard Footnotes (a), respectively.
(5) Present survey definition: Sole or shared us__~e of garden
TABLE IbiS:
IndicatOr: ^r,-,~ ~0 OUTDOOR SPACE
Percentage==pf Private Household Population in Dwellings
~ith Balcony/Terrace and/or Private Garden, by Selected
Individual Characteristics: 1980
(percentages)
Population in Dwellings with:
Individual.-CharacteristiCs.
Balcony/Terrace
Garden (1)
¯
Either Balcony/
Terrace or Garden
(2)
(N = 198S)
0-14
18 - 24
(N = 227)
89
25 - 44
(N = 715)
94
45 - 64
(N = 682)
92
65 and over
(N =364)
92
- ALL AGES
92
, p
Community Size (3)
(N =1958)
very large metropolitan areas (N=4~)
90
iarge metropolitan areas
(N =214)
93
¯ other ¯urban"
(N =391)
88
rural
(N =883)
96 .
I !
Footnotes: Table 1bis
(1) See Table 1 (p. 65) (5)
(2), (3) See Standard Footnotes (a) and (c) respectively
Indicator: ACCZSS TO OUTDOOR SPACE (cont.)
TABLE 2 : Percentage of Urban Private :{ouseholds h~vin~ access from their ~ellinz 10 az Area of (,Den Susc~/Ithin a Z~ated Time,(I) ~Z Se!ected Characteristics of Head of Household: 1977
(percentages)
Characteristics of(6)
Open Space Wgthin a Normal Walking Distance of:
.Head of Household
20Minu£es " . :
A~ (2) (N=50S)
less than 25 (N=II)
25 - 44 (N=I91) 88
45 - 64 (N=192) 90
65 and over (N=I09) 88
AL~ AQES
89Socio-Economic Status (3)
(N = 432)
self-employed agrleultura~self-employed non- [
agricultural . I(N = 57) 95 non-manual employees (N = 127) 84
manual employees
(N = 171)
87ALL ACTIVE
(N = 355)
87students
(N = o)
recipients of retirement
and disability pensions (N = 77) 92 Oomnunltv size (4) (N=513)
very large metropolitan
areas (N=200) 85
large metropolitan areas (N=105) 94
othe~ urban (N=208) 89
Househo!d Tv-oe (N=50 5) one person (N=73) " single person¯ with(N=4)
86
child (ten)
Couple wi~h child(ren)(N=l
54) ,.
84childless couples (N=45)
other private households (][=229) 91
Tenure Status(G) (N=512)
owner
"
(N~62)
89tenant
(N=141)
87o~her
(N=9)
year ,of l~ellinE (N=51!)
Up to .-1945 (N=253)
91
1946- 1959 (N=106)
. : ’. ’ ,
88 ’
cince 1960 (N=152) 86, .
NOTES .
(I) Area suitable for walking/sitting ~nd resting, e.g. a park.
Indicator: ¯ACCESS TO OUTDOOR SPACE
Footnotes: Table 2
(2),
Survey question as follows: "I would like you to tell me whether there is one (of the following) within a mile or so of here (i. e., within about 20 minutes walk):
Park or open space" etc.
¯ -:. ...
[image:50.821.227.797.21.582.2]Indicator: ACCESS TO OUTDOOR SPACE (co~i~,)
TABLE 2bis:’ PercentageI of the Urban Private Household I’opulation
having Access from their Dwelling and Within a Stated
__ .. , t ,
" "= ¯ ~L) : ....
Time to an Area qf 0pen Space, by Selected Individual
Characteristics : 1 9.77
(percentages)
\
.... ,, .,,
Open¯ Space Within a Normal Walking Distance of:
,Individual
JCharacteristics
20 rains.-
¯ . 5
(2)
(N = lO51)
, 0-14
18 " 24
(N=135)
91
¯ . . .. .
25 - 4 (N =430)
¯
87
45- 64
(N =341)
85
: 65 and over
(N =145)
88
ALL AGES
87
,... ,,, ,o
Comhunity Size (3) (N = 1072)
very large metropolitan
areas (N = 468)
85
large metropolitan areas
(N = 213)
other urban
91
(N = 391)
88
l
,]
Source of data: EEC Sponsored Housing, Health and General Altitudes Survey.
! ¢ji
Indicator: ACCESS TO OUTDOOR SPACE
Footnotes: Table 2bis
(l) See Table 2 (p. 67) (1).
PHYSICAL ENVIRONMENT
(Social Concern)
Indicator: BASIC M.IENITIES¯
¯ Reference Population: private household population(2)
TABLE I:
percentage of the Private I[ousehold Population in Dwellings with
Specific Amenities(I) 1977
(percenteges)
,.- 1950
.. 1.960
1970
1 9 77¯
piped water
flush toilet
fixed bath .
or shower (3)
(N = 1993)
74
kitchen or
kitchenette ~)
(N = 1983).
83
three ameniti~
(N = 1977)
69
NOTES
(i) Amenities should be inside the dwelling, and to %he excluslve use of the household.
SOURCE OF DATA: ’ EEC sponsored Housing, Health and General Attitudes Survey.
I
-.1
Footnotes: Table I
(i)
(2)
(s)
(4)
Sole use by respondent’s household.
See Standard Footnote (a)
Present survey wording:
Present survey wording:
(kitchen) and a fixed sink with piped water",
"Fixed bath or shower with piped water"
TABLE 2:~
49
-~ndlca~or: BASIC ~::ITIES (’cont.).
Percen~a-e of Private |{ouseholds in ~leilJn:s Lack!n~ one of .the ".Amenitiest b~; Selected Characteristics of H~ad of Household:
1977-(percentages) Characteristics of ~d of¯
Household private households in dwellings lacking:
piped water flush ~oilet fixed bath or shower(]
*,.4Z2~e(2) (N:-962) Ic~s than 25 (N = 21)
25 - 44 (N=305) 14 18
45 - 64 (N=405) 19 23
65 and over (N=231) 35 42
ALL AGES 22
Socio-~conomic Status (3tN=832)
tell’employed agricultural .
self-employed non-agricultural(,
r=254)
26 29non-manual employees (N=154) 6 8
manual employees (N=270) 17 23
ALL ACTIVE (N=677) 18 22
students (N=0)
recipients of retirement and
disability pensions (N=154) 31 39
co=reunify Size (4) (N=950)
very large metropolitam areas (i~=202) 7 8
large metropolitan areas (N=IO( 15 22
othe~ twban (N=205) 11 21
ruza! (N=43 7) 34 38
Household Ty-oe (N=965)
one person (N=13 7) 44 53
single person with child(ten)(N=7) ,¯ ’o
couple with child(ten) (N=238) 9 12
childlsss couples (N=98) 24 30
other prlvste households(N=485) 21 26
Tenure Status (5)
(N=971)
c~ez
(N=772)
20 24renan
¯
(N=184)
24 34otho.~"
(N=I5)
Year of Dwell!nz " (N--970)
Up to ~945 (N=560) 32
39
1946 - 1959. (N=168) 11 13
¯ ince 1960 (N=242) 4 5
SOURCE OF DATA: EEC sponsored Housing, Health and General Attitudes Survey
Indicator; BASIC .AMENITIES
Footnotes: Table 2
(1) See Table I (3)
~-! ISJ CA]~ EN VIRONMgNT ...
_I
.... (Social Concern) ~.
Indicator: PROXIMITY OF .,ELECTED SE.,IVICEo
Reference Population: private household population
¯
¯
[image:56.823.14.822.22.567.2]o
TABLE I: Percentag.e of the Private Household Population having Access
from their Ih.tellin~ and Within a Stated Time to Selected
Services: Urban and Rural Population(D: 1977~
(percentages)
. Year: 1980
Store satisfying daily needs G) N =1957
urban population
rural population
primary¯ School
urbanpopulation
rural population
Post Office
N=1957
urban population
rural¯population"
Public transport sto~
-urban population
rural population
normal walking distance of:(2)
0 ~ 20 minutbs ~. ~.
, , , I
97
N =
67
N = 884
: 93 N = 1073
46
N = 884
Source¯ of data: EEC sponsored Housing, Health and General Attitudes Survey
Indicator: PROXIMITY OF SELECTED SERVICES
Footnotes : Table 1
(1) Urban Rural
= all population centres over 500 persons¯ = all population centres less than 500 persons
(2) See Footnote (1) to Table 2, p. 67, for question wording.
(3) Survey wording: "Small shop selling groceries, etc. ".
53
-:Zndioator: ~HOZII-iITY OF SELECTED S].~q.VICES (cont.)
¯ TABLE 2: percentage ef the Private }louzehclds Po~ulailon }{~vin~ Access from their I~:lel!in~ :ilthin a ’Jorma! ’dal):ing Diztance of Lesz Than 20 MJnutes~)co a S’J’0?,E SATISFY!~!G DAILY ~,;EEDS,~ by Characteristics
(~f }|esd of ]!ousehold and of Individuals" 1977
(percentages) Percentage of Households Percentage of Population ¯Tear: 1980 by Characteristics of by Characteris~!cs
I
Head of Household (7) of Individuals
(3)
(N = 974)
(N = 1987)less than .25
(N~I)
(N=227)
89
25 - 44
(N=3n)
86
(N=716) 8645 - 64
(N=4O8)
82
(N=680) 8265 and over
(N=234)
83
(N=8 64) 80ALL AGES
84
84
Socio-Economic Status(4)
¯
(N = 843)
(N = 1831) self-employed agricultural
~elf-employed nonuagrieultural (N=259) 66 (N=499) 67
non-manual employees (N=~55) 99 (N-~. 15) 95
manual employees¯ (N=273) 91
(N=695) 88
ALL ACTIVE (N=687) 83 (N=1609)" 83
students
(N=0)
(N=16)recipients of retirement ~d
¯ disability pensions
(N=156)
85
(N=206) 85Co=unitySf~e (5)
(N = 960)(N = 1957)
very large metropolitan areas . (N--201) 99
(N=469)
97
large metropolitan area~
(N=105)
lOO
(N=213)
98
other urban (N=208) 97
(N= 91)
97
rural (N=446)¯ 67
(N=884)
67
Nousehold Type
(N = 977)
(N = 2004)one person
(N=137)
82
(N=138) 82single person with child(ten)
(N=7)
(N=8)
couple with child(ten)
(N=244)
89
(N=450) ¯ 89childless couples
(N=lOO)
88
(N=200) 87other private households
(N=489)
80
(N=1208) 82Tenure Status(6) (N = 983)
owner (N=784) 81 ¯ (N=i-28)6 (N = 2011)82 "
tenant . (N=184) 96 (N=358) 94
other (N=15) (N=25)
Year of Dwelling (N = 982) (N = 2011) ..
Up to 1945
(N=568) , ¯ .81 (N=I!44) 811946 - 1959 (N=170) 91 (N=3 74) 90
since 1960’ . - (N=244) 86 (N=493) 86 t
SOURCE 0F DATA: EEC sponsored Housing, Health and General Attitudes Survey
¯. , . . ¯
... \ ¯ . ...
Indicator: PROXIMITY OF SELECTEDSERVICES
Footnotes: Table 2.
(1)
(2) See Table 2 (present indicator).
(3), (4), (5), (6), (7), see Standard Footnotes (a), (b), See footnote to Table 2 (p. 67) for question wording.
’-
55-indicator: _ :..O.tIy,~TZ OF SELECT~D ~E[..’VICES (cont,)
¯ TABLE 3: Peree.nta~e of the 1’r!vate Hodsehel~s T, owulat’;ou havin~. ,~.ccess from their :.~,:e-’].!~:~-- ’.’:i’th/:: a ,e ... 1 "-"’~:’i~’" "r~-’-,-,~,,e of Lezz ’~"an
Charac~er1~t.--~ of Head of 20 Ml.nutes~° a ~0ST OFFICE, b,’ " ~ ....""~
}]ousehold ~.nd cf Individual.c: 1977
¯ . (percentages)
Percentage of Households Percentage of Popilation
’fear: 1977 by Characteristics o;~ by Characteristics Head of Household iu) of Individuals
A~ (2)
(N = 974)(N = 1987)
less than 25. (N=21) (N=227) 78
25 - 44
(N~11)
74
(N=716) 75¯45 - 64 (N=408) 70 (N=680) 71
65 and over (N=234) 69
(N~64)
65
ALL AGES 72
Socio-Economic, Status (3) (N = 843) (N = 1831) I. self-employed agricultural
¯ self-employed non-agricultural " ." (N=259) 52 (N=499) 52
non-manual employees
(N=155)
88
(N=415)
85
manual employees (N=273) 83 (N=695) 81
ALL ACTIVE (N=687) 72 (N=1609) 73
students
(N~)
(N=16)recipients of retirement an~
disability pensions (N=156) 72 ; (N=206) 70
0ore=unity Size (4)
(N = 960)
(N = 1957)
very large metropolitan areas
" 1
(N=201)
94
(N=469)
93
large metropolitan areas
(N=105)
98
(N=213)
95
other urban
(N=208)
92
(N~91)
92
rural
(N=446)
46
(N=884)
46
Household Tvoe (N = 977) (N = 2004)
75 75
¯one person (N=I3 7) (N=138)
single person with child(ten) (N=7)
(N=S)
88
couple with child(ten) (N=244) 78 (N=450) 77
childless couples (N=100) " 74 (N=200,) 71
other private households (N=489) 67 ,(N=1208) 70
¯ Tenure Statue (5) (N = 983)
¯ (N = 2011)
owner (N=784) 67
(N=1628)
69
tenant (N=184) 91
(N~58)
88
other
(N=15)
(N=25)
Year of ~¢e!l!ng (N = 982) .. (N = 2011)
Up to ~ 945 (N=568) 67 (N=1144) . 68
1946- 1959
..
(N=170)
~
81
(N~ 74) 81since 1960 ¯ (N=244) 77 . (N=493) 75 ...
Indicator: PROXIMITY OF SELECTED SERVICES
Footnotes: Table 3
(1) See Table 1 (1)
~RSONAL SAFETY [
[image:62.821.1.805.23.556.2]~ocial Concern)
TABLE 1 :
Indicator:
FEtd~ FOR PERSONAL SAFETY
Reference Population: whble population (I)
Percentage of the Population Afraid to UalkAlone...intheir
Neighbourhood at Night~2)b~ Selected Individual Characteristics
(percentages)
Year: 1977
Female
Male
Total
Age (1)
(N = 995) (N = 993) (N = 1988)
0-14
: 18 24
(N = 227)
34
4
25 - 44
(N = 716)
3 2 245 - 64
(N
= 681) 4 2 3,-65 and over ¯ (N=364)
4 3 3Community Size (2)
(N = 985).(N = 973)
(N = 1958)very large metropolitan areas (N =47
))
6
7 7large metropolitan areas (N= 214)
6 45
other
urban
. (N =391) " 2 1 1rural
(N = 883)
2 1 1"IF DATA AVAILABLE FOR OTHER YEARS, PT,EASE REPEAT TABT,E.
1977
!
!
Footnotes: Table I
(D, (3).
See Standard Footnotes¯ (a) and (c) respectively.(2)
Survey question was as follows: "How much of a problem is safety in this neighbourhood as far as the following are concerned ?"Is:
Personal safety (mugging, etc. )
Very much of a/ A bit of a / Not much of k / No problem problem ?/ problem ?/ problem ? / at all?
59
-References
Davis, E. E., Fine-Davis, M., Meehan, G. and Downey, G; Health~ housing and life in general in the European Community: Comparative multi-variate analyses of subjective social indicators. Final report to the Statistical Office of the European Communities, Luxembourg, March 1980.
Fine-Davis, M., Davis, E. E. and Bolger, N. The quality of working life in the European Community: Multivariate analysis of the Irish data. Final report to the Statistical Office of the European Communities, Luxembourg, October 1981.
Organisation for Economic Cooperation and Development. List of social concerns common to most OECD countries. Paris: Author, 1973.
Orgar~sation for Economic Cooperation and Development. Measuring social well-being: A progress report on the development of social indicators. Paris: Author, 1976.