Journal of Criminal Law and Criminology
Volume 72
Issue 3
Fall
Article 10
Fall 1981
The Strategy of Deterrence Research: A Reply to
Greenberg
Harold G. Grasmick
Follow this and additional works at:
https://scholarlycommons.law.northwestern.edu/jclc
Part of the
Criminal Law Commons
,
Criminology Commons
, and the
Criminology and Criminal
Justice Commons
This Criminology is brought to you for free and open access by Northwestern University School of Law Scholarly Commons. It has been accepted for inclusion in Journal of Criminal Law and Criminology by an authorized editor of Northwestern University School of Law Scholarly Commons.
Recommended Citation
0091-4169/81/7203-1102
THEJOURNAL OF CRIMINAL LAW & CRIMINOLOGY Vol. 72, No. 3
Copyright @ 1981 by Northwestern University School of Law Prinltedin US.A.
THE STRATEGY OF DETERRENCE
RESEARCH: A REPLY TO
GREENBERG
HAROLD G. GRASMICK*
I sincerely appreciate the attention Professor Greenberg' has de-voted to my article,2 and, of course, I agree that several causal interpre-tations are consistent with my data. As any standard statistics textbook indicates, causality cannot be demonstrated with cross-sectional data; it can only be inferred under a set of assumptions.3 Professor Greenberg questions some of my assumptions. I will address his specific criticisms, although they are not novel and could be directed toward any piece of cross-sectional survey research in the area of deterrence.4 First, I want to respond to his more general critique, summarized in his last two paragraphs. Professor Greenberg seems to imply that little has been, or could be, learned about the deterrent effect of sanctions from the type of research which I (and others) have conducted.
A MODEST RESEARCH STRATEGY
All researchers interested in deterrence realize what the ideal, "de-finitive" study would be, and all recognize that their own research falls short of this ideal. The definitive study would begin with a large sample of geographical aggregates for which characteristics of crime and pun-ishment (crime rate, arrest rate, severity of sentences) were known.5 Sur-vey data would be gathered from large samples of individuals in the aggregates to measure the average perceived certainty and severity for
* Associate Professor of Sociology, University of Oklahoma; Ph.D. University of North Carolina-Chapel Hill, 1973.
1 Greenberg, Methodological Issues in Sury Research on the Inhibition of Crime, 72 J. CRIM. L. & C. 1094 (1981).
2 Grasmick & Green, Legal Punishment, Social Disapproval and Internalization as Inhibitors of
Illegal Behavior, 71 J. GRIM. L. & C. 325 (1980).
3 H. BLALOCK JR., SOCIAL STATISTICS (2d ed. 1979).
4 Minor, Deterrence Research: Problemr of Theory and Method, in PREVENTING CRIME 21-45
(J. Cramer ed. 1978).
5 Hopefully, researchers who use aggregate data will have developed more valid
meas-ures than the Uniform Crime Reports and arrest clearance rates which have been commonly used in aggregate level research.
A REPLY TO GREENBERG
each aggregate. Furthermore, measures of possible confounding vari-ables, drawn from a variety of theories, would be obtained for both the aggregate and the individual levels. All these data would be gathered at several points in time, and a panel design would determine if, control-ling for possible confounding variables, changes in the actual character-istics of punishment produce changes in perceptions of punishment. These changes in perceptions of punishment, in turn, would be expected to produce changes in the amount of crime. Obviously, this would be a large-scale, time-consuming, and expensive research project. I have seen grant applications which propose a similar study, but I never have seen one funded.
Gibbs has recommended that we build our knowledge of deterrence processes through a series of small-scale projects which provide insights
and tentative evidence.6 In my opinion, before we invest our time (and
someone else's money) in the definitive study, deterrence researchers have at least two major tasks to accomplish through such small-scale projects as my own. First, we must develop measures of deterrence con-cepts that have maximum validity and reliability. Second, from the various theories of crime and social control, we must select and measure those concepts to be included as possible confounding variables. The intent of my article was to bring together, in a single study, the measure-ment refinemeasure-ments and some of the possible confounding variables which have emerged from previous cross-sectional survey research. I believe that these previous studies, synthesized in my own, have produced sig-nificant insights which must be incorporated into more definitive studies in the future. In particular, it is now clear that what appear to be minor discrepancies in the wording of items designed to measure perceived cer-tainty and severity of punishment will lead to major differences in con-clusions concerning the deterrent effects of perceived sanction threats. It is also evident that future attempts to estimate the magnitude of the deterrent effect must include measures of moral commitment and threat of social disapproval since these variables are related both to perceptions of sanctions and to involvement in crime.
In the study of deterrence, the major alternative to cross-sectional survey research has been aggregate level, secondary analysis. Recently, much of this research has utilized time-series data. I believe that the insights which have been gained from aggregate level deterrence re-search do not match those gained from the existing cross-sectional sur-vey research. At the aggregate level, it is difficult to refine measures of the threat of sanctions since researchers rely on data gathered by govern-ment agencies. Furthermore, decisions concerning which possible
con-6 j. GIBBS, CRIME, PUNISHMENT AND DETERRENCE (1975).
HAROLD G. GRASMICK
founding variables to include in an aggregate analysis are made, in part, on the basis of availability of data. Some of the variables available, like socio-economic status (SES) or racial composition, might be theoreti-cally important. Other theoretitheoreti-cally important variables, however, (like moral commitment and threat of social disapproval) are ignored be-cause aggregate level measures do not exist. In his own research, Profes-sor Greenberg uses time-series aggregate data but considers no variables other than arrest clearance rates and Uniform Crime Reports.7 I recog-nize that time-series aggregate data will play a major role in deterrence research, however, this research method thus far has been applied to theories shaped by the availability of data and to measures which are commonly acknowledged as inadequate. Professor Greenberg states that my research is "methodologically primitive."8 I accept this criti-cism, in comparison to the ideal research which is yet to be conducted, but I wonder which is more primitive--cross-sectional survey research aimed at theory construction and measurement refinement or time-se-ries aggregate research aimed at demonstrating causality among inade-quate measures and among variables selected for reasons other than theoretical import.
Professor Greenberg's closing statement calls for time-series survey data. In my view, which is guided by sensitivity to measurement and theory, we are not quite ready for such a study. As I indicated in the conclusion to my previous article, we have not yet explored the theoreti-cal links between the inhibitory variables used in my research and the motivational variables contained in other theories. We would use our resources more efficiently if we first developed our theory from cross-sectional research and then tested it with panel designs. The theory is not yet formulated, a point I will elaborate upon below as I address Professor Greenberg's two specific criticisms.
PATH MODEL OF PREVIOUS RESULTS
My research was designed to test for the presence of interaction effects of L (threat of legal sanctions), S (threat of social disapproval) and M (moral commitment) on I (involvement in crime, which was measured by both self-reported past illegal behavior, Ip, and estimated future involvement in illegal behavior, If). Since path analysis assumes the absence of interaction, the technique could not be used to test the core hypotheses. However, my results indicated that the interaction ef-fects were not significant with I, as the measure of the dependent
varia-7 Greenberg, Kessler & Logan,A Panel Model ofCrime Rates andArest Rates, 44 AM. Soc.
REV. 843 (1979).
8 Greenberg, supra note 1, at 1100.
A REPLY TO GREENBERG
ble. Thus, additivity can be assumed, and the following path analysis is
imbedded in Tables 2 and 4 of my original article.9
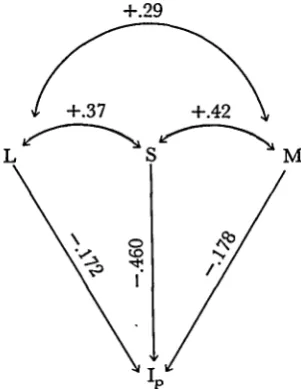
FIGURE 1
PATH ANALYSIS OF PREVIOUS RESULTS
+.29
/ +.37 +.42
L S M
The numbers on the paths from the exogenous variables to Ip are the standardized regression coefficients (Beta's, or path coefficients, from the original Table 4), while the numbers on the double-headed arrows are zero-order correlations (from Table 2). The double-headed arrows as-sert that unobserved variables, antecedent to the exogenous variables, influence L, S, and M and produce correlations among them. Readers familiar with path analysis will recognize that the coefficients in the diagram perfectly reproduce the zero-order correlations between IP
and each of the three exogenous variables (e.g., rLiP = PIpL +
rLsp1 ps + rLMplpM -= +.40).
I addressed the issue of causal order in my previous article10 by noting that, at the conceptual level, the dependent variable in cross-sec-tional survey research isfiuture illegal behavior. One's behavior in the future is expected to be influenced by present perceptions of sanctions. However, at the operational level, future illegal behavior cannot be mea-sured directly. The most commonly used indicator of future illegal be-havior in previous research has been self-reported past illegal bebe-havior
9 Grasmick & Green, supira note 2, at 333, 335.
10 Id at 332.
[image:5.454.162.313.142.337.2]HAROLD G GRASMICK
(Ip), but, as I have previously noted,I estimated future behavior (If) has been suggested as a possibly more valid indicator. In the absence of evidence of relative validities, I decided to use both Ip and If as alterna-tive measures of future illegal behavior. Therefore, at the conceptual level, there is no ambiguity in causal order: present perceptions of sanc-tions influence future involvement in crime. The problem of causal or-der which concerns Professor Greenberg occurs at the operational level to the extent that Ip and If indicate something other than future illegal behavior.
REVERSING THE CAUSAL ORDER
Professor Greenberg implies that his Figure 112 is a reversal of the causal order of the theory represented by my Figure 1 above. His ar-rows are pointed in the opposite direction, but his model ignores the assumption that unobserved variables influence L, S, and M and asserts that all the correlations among these three variables are due to their mutual dependence on Ip. Given my original assumption, a more ap-propriate "reversal" of my causal model would include a variable X which contains all unobserved variables which influence L, S, and M. Figure 2 below is such a model.
FIGURE 2
REVERSED CAUSAL ORDER
X
L S M
In this model, the predicted correlations among L, S, and M differ from Professor Greenberg's predictions. For example, the model above
predicts that rLs = PLIpPSIp + PrLxPsx. Professor Greenberg's
pre-dicted correlations13 are consistently lower than the observed
correla-tions because variables in addition to Ip are contributing to the
correlations among the three inhibitory variables. In fact, he raises this issue in his discussion of possible sources of spuriousness and suggests
variables which might be contained in X.14
11 Id at 331.
12 Greenberg, supra note 1, at 1096.
13 Id. at 1095-96.
14 Note that in the diagram, all the correlation between X and Ip is assumed to result from their mutual relationships with L, S, and M. If this assumption were relaxed and a
[image:6.454.161.302.338.436.2]A REPLY TO GREENBERG
With zero-order correlations from cross-sectional data, it is impossi-ble to distinguish between Figures 1 and 2 above. Both would be consis-tent with the data. However, if Ip is an indicator of future involvement in crime, as I intended it to be, then Figure 2 is not plausible since it proposes that future behavior influences present levels of L, S, and M.
THE ROLE OF UNOBSERVED VARIABLES
Professor Greenberg's second specific criticism15 is that some
unob-served variable(s) might be producing spurious relationships between IP and the three inhibitory variables. This is an issue in any piece of re-search, whether the data are cross-sectional or time-series. Professor
Greenberg represents the possible sources of spuriousness as X and makes a series of assumptions about coefficients in his Figure 2.16 The assumptions he chooses, of course, are those which imply spuriousness.
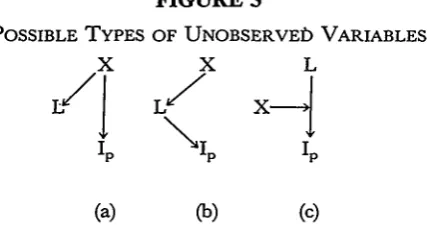
[image:7.454.120.334.331.446.2]I do hope that researchers in the future will add variables to the modl I presented in my article. In fact, that is the objective of my own current research. These other variables, however, are not necessarily sources of spuriousness. They could be incorporated into the model in several ways, three of which are depicted in Figure 3.
FIGURE 3
POSSIBLE TYPES OF UNOBSERVEb VARIABLES
X X L
IP \ 1IP IP
(a) (b) (c)
Figure 3(a) is a simplified version of Professor Greenberg's Figure 2 and suggests that some variable X, antecedent to both L and Ip, is pro-ducing a spurious relationship. Figure 3(b), on the other hand, suggests that some variable X is related to Ip but only through L as an interven-ing variable. Currently, I am in the process of preparinterven-ing a manuscript comparing 3(a) and 3(b) with gender as variable X. It has frequently been observed that females are less involved in illegal behavior than males, a finding which is replicated in my data set for most of the eight
double-headed arrow drawn between X and Ip, the predicted correlations would change but still would not equal Professor Greenberg's predictions.
15 Greenberg, supra note 1, at 1096.
16 Id. at 1097.
HAROLD G. GRASMICK
offenses.17
My data also indicate that females tend to score higher on each of the three inhibitory variables for most of the offenses. It is possi-ble, as Figure 3(a) and Professor Greenberg suggest, that the threat of legal punishment is related to involvement in crime only because both of these are strongly influenced by gender. On the other hand, the data might fit Figure 3(b) and indicate that gender is related to involvement in crime because females tend to score higher on the three inhibitory vari-ables. The results of the log-linear analysis I am conducting will enable me to distinguish between these two possibilities.
Figure 3(c) proposes a conditional relationship, or interaction ef-fect. The threat of legal sanctions influences involvement in crime only under certain conditions of variable X. In the conclusion of my article, I outlined such a model by suggesting that the three social control vari-ables might influence involvement in illegal behavior only when motiva-tion to engage in that behavior (X) is present. In a more recent article, a colleague and I explored this hypothesis with tax-cheating as the depen-dent variable. Our results indicate that each of the three inhibitory variables is related to tax-cheating onl' in the group of respondents who score high on our measure of motivation to cheat on their taxes. Re-spondents who are not motivated do not cheat, regardless of their scores on the inhibitory variables L, S, and M.'s The relationships between the inhibitory variables and involvement in crime are much stronger in the subgroup of motivated individuals than in the total sample. There-fore, previous studies which have not isolated the motivated respondents probably have underestimated the deterrent effect of sanction threats among those individuals whose behavior is influenced by such threats.
CONCLUSION
My article was not intended to be the definitive study of deterrence. That is a more long-term goal of everyone doing research in this area. I hope my article, Professor Greenberg's comment, and my reply will help others build on what has been done to increase our understanding of the
process of social control.
17 These eight illegal activities were: theft of property worth less than $20, theft of prop-erty worth $20 or more, gambling illegally, cheating on tax returns, intentionally inflicting physical injury (battery), littering, illegal use of fireworks within the city limits, and driving while under the influence of alcohol. Grasmick & Green, supra note 2, at 330.
18 Scott & Grasmick, Deterrence and Income Tax Cheating, 17 J. APPLIED BEHAVIORAL ScL
72 (1981).