Learning Sciences Dissertations Department of Learning Sciences
Fall 1-10-2020
Using Blended Learning to Improve the Mathematics
Using Blended Learning to Improve the Mathematics
Achievement of Students with High Incidence Disabilities in an
Achievement of Students with High Incidence Disabilities in an
Alternative Education School
Alternative Education School
Zachary G. Johnson Georgia State University
Follow this and additional works at: https://scholarworks.gsu.edu/ltd_diss
Recommended Citation Recommended Citation
Johnson, Zachary G., "Using Blended Learning to Improve the Mathematics Achievement of Students with High Incidence Disabilities in an Alternative Education School." Dissertation, Georgia State University, 2020.
https://scholarworks.gsu.edu/ltd_diss/10
This Dissertation is brought to you for free and open access by the Department of Learning Sciences at
ScholarWorks @ Georgia State University. It has been accepted for inclusion in Learning Sciences Dissertations by an authorized administrator of ScholarWorks @ Georgia State University. For more information, please contact
MATHEMATICS ACHIEVEMENT OF STUDENTS WITH HIGH INCIDENCE
DISABILITIES IN AN ALTERNATIVE EDUCATION SCHOOL, by ZACHARY G.
JOHNSON, was prepared under the direction of the candidate’s Dissertation
Advisory Committee. It is accepted by the committee members in partial fulfillment of the requirements for the degree, Doctor of Philosophy, in the College of Education & Human Development, Georgia State University.
The Dissertation Advisory Committee and the student’s Department Chairperson, as
representatives of the faculty, certify that this dissertation has met all standards of excellence and scholarship as determined by the faculty.
______________________________ ______________________________
David E. Houchins, Ph.D. Kris Varjas, Psy.D.
Committee Chair Committee Member
______________________________ ______________________________
Tracy McKinney, Ph.D Eliseo Jimenez, Ph.D.
Committee Member Committee Member
______________________________ Date
______________________________ Brendan Calandra, Ph.D.
Chairperson
Department of Learning Sciences
_____________________________ Paul A. Alberto, Ph.D.
Dean
AUTHOR’S STATEMENT
By presenting this dissertation as a partial fulfillment of the requirements for the advanced
degree from Georgia State University, I agree that the library of Georgia State University
shall make it available for inspection and circulation in accordance with its regulations
governing materials of this type. I agree that permission to quote, to copy from, or to
publish this dissertation may be granted by the professor under whose direction it was
written, by the College of Education and Human Development’s Director of Graduate
Studies, or by me. Such quoting, copying, or publishing must be solely for scholarly
purposes and will not involve potential financial gain. It is understood that any copying
from or publication of this dissertation which involves potential financial gain will not be
allowed without my written permission.
NOTICE TO BORROWERS
All dissertations deposited in the Georgia State University library must be used in
accordance with the stipulations prescribed by the author in the preceding statement. The
author of this dissertation is:
Zachary George Johnson Department of Learning Sciences
College of Education and Human Development Georgia State University
The director of this dissertation is:
David E. Houchins, Ph.D. Department of Learning Sciences
College of Education and Human Development Georgia State University
Zachary G. Johnson
658 Gresham Ave SE, Atlanta, GA 30316
EDUCATION
Doctor of Philosophy | Georgia State University | December 2019 Education of Students with Exceptionalities
Master of Education | Georgia State University | May 2011 Education of Students with Behavior/Learning Disabilities
Bachelor of Arts | Georgia State University | May 2006 Anthropology
PROFESSIONAL EXPERIENCE
West Georgia University (07/2019-Present)
Adjunct Faculty Member; Special Education Department
Georgia State University (2012 – 2018) Doctoral Graduate Research Assistant
Independence High School (2010-2012)
Lead Teacher (EBD) 9-12 Grade Math and Science
Sweet Apple Elementary School (2009-2010) Teacher (EBD) 5th Grade
UNIVERSITY INSTRUCTION AND SUPERVISION
Instruction
Graduate Teaching Assistant, EXC 6590: Functional and Social Methods for Students with Behavior/Learning Disabilities. Spring, 2013. Spring 2019. Georgia State University
Instructor, EXC 6590: Functional and Social Methods for Students with Behavior/Learning Disabilities. Spring, 2014. Georgia State University
Graduate Teaching Assistant, EXC 7170: Methods for Teaching Lifeskills to Students with Behavior and Learning Disabilities. Spring 2014. Georgia State University
Instructor, EXC 4020: Characteristics and Instructional Strategies for Students with Disabilities. Fall, 2017. Georgia State University
Field Experience II, Field Experience Supervisor, Spring 2014. Fall 2018. Georgia State University
FELLOWSHIPS
Project LEADERS (Leaders in Exceptionalities, Alternative and Delinquency-related Environments through Research and Scholarship) Fellowship. U.S. Department of Education, Office of Special Education Programs. Georgia State University (CFDA 84.32D), (2012 -2018)
PUBLICATIONS AND MANUSCRIPTS
Schwab, J. R., Johnson, Z. G., Ansley, B. M., Houchins, D. E., & Varjas, K. (2015). A literature review of alternative school academic interventions for students with and without disabilities. Preventing School Failure: Alternative Education for Children and Youth, 1-13. doi:10.1080/1045988X.2015.1067874
Houchins, D. E., Oakes, W. P., & Johnson, Z. G. (2016). Bullying and students with disabilities: A systematic literature review of intervention studies. Remedial and Special Education, 37(5), 259-273. doi:
https://doi.org/10.1177/0741932516648678
PRESENTATIONS
Johnson, Z. G., Schwab, J.R.,Ansley, B.M., Houchins, D.E., & Varjas, K. (April 2014). Academic barriers and facilitators in an alternative school: Poster Presentation. Council for Exceptional Children: National Conference, Philadelphia, PA.
Pressley, M., Houchins, D., & Varjas, K., Johnson, Z. & Kane, C. (October, 2016). Teachers recognizing signs of trauma in students with EBD: Preliminary results from a qualitative interview study. Presentation at Teacher Educators for Children with Behavior Disorders (TECBD) of CEC conference, Tempe, AZ.
Johnson, Z.G., Houchins, D., Pressley, M., Varjas, K., & Jiminez, E. (October, 2016). A comparison of two blended learning models of math instruction for students in alternative education settings. Presentation at Teacher Educators for Children with Behavior Disorders (TECBD) of CEC conference, Tempe, AZ.
SERVICE
Guest Reviewer for the journal of Teacher Education and Special Education (T.E.S.E) (October, 2012)
USING BLENDED LEARNING TO IMPROVE THE MATHEMATICS ACHIEVEMENT OF STUDENTS WITH HIGH INCIDENCE DISABILITIES IN AN
ALTERNATIVE EDUCATION SCHOOL
by
Zachary G. Johnson
Students with high incidence disabilities in the public school system often
perform multiple grade levels below their typically-developing peers in mathematics
achievement. These students exhibit lower levels of on-task behavior that limits their
access to effective instruction, thus requiring instructional interventions that personalize
learning, differentiate materials, and ultimately promote academic engagement. In recent
years, the use of technology-mediated and computer-assisted instruction has shown to
have positive results with students with disabilities. Blended learning, an intervention that
combines face-to-face instruction with computer-based instruction, has been shown to
improve the on-task behavior and achievement of students with disabilities. In Chapter
One, a systematic review of the literature was conducted in an effort to locate blended
learning math studies for secondary-level students with disabilities and to assess the
scientific rigor of those studies. Twelve intervention studies were synthesized and
categorized in three major areas: (a) online- and computer-based curricula for
independent practice/instruction, (b) media-based interventions with video prompting,
and (c) strategy instruction. Blended learning intervention studies that found positive
results in math achievement and on-task behavior of students with disabilities utilized a
station-rotation format. Additionally, studies that met the high standards of special
education research (CEC, 2014) saw stronger gains for student math achievement. In
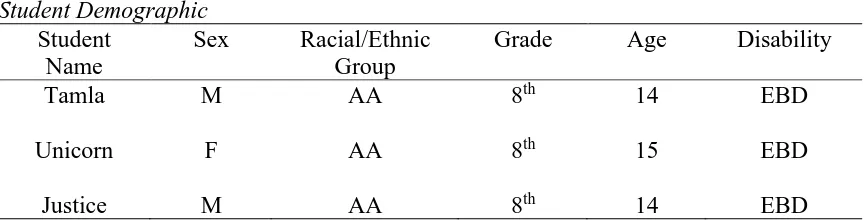
Chapter Two, blended learning was implemented with three middle school students with
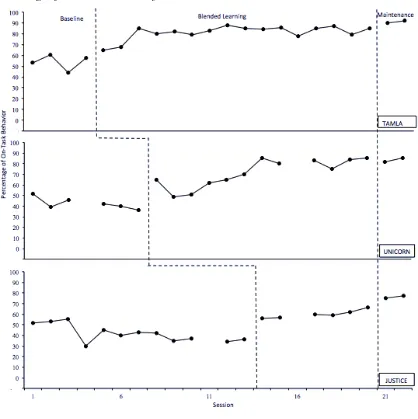
emotional behavior disorders in a therapeutic setting. Using a multiple baseline across
participants single case design, this study examined the relationship between blended
of station-rotation blended learning. Math achievement, measured through the AIMSweb
curriculum-based math probes, improved for two of three student participants. Social
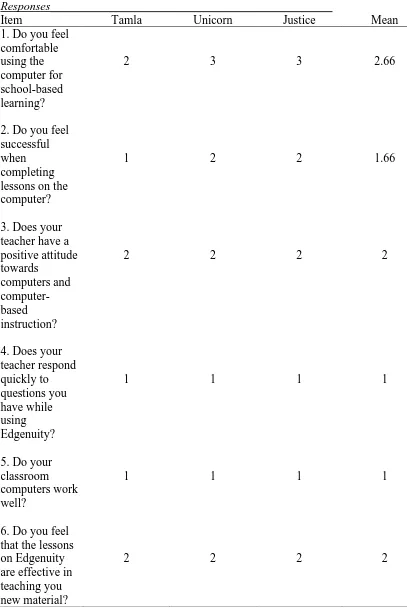
validity questionnaires revealed that students and teacher enjoyed the blended learning
intervention; however, continued use depended on properly functioning technology.
Future research in the area of blended learning math instruction should strive to
accurately measure on- and off-task behavior under the computer-based condition.
Additionally, researchers should develop measurements of math achievement that
accurately assess the content that is taught during instruction.
ACHIEVEMENT OF STUDENTS WITH HIGH INCIDENCE DISABILITIES IN AN
ALTERNATIVE EDUCATION SCHOOL
by
Zachary G. Johnson
A Dissertation
Presented in Partial Fulfillment of Requirements for the
Degree of
Doctor of Philosophy
in
Education of Students with Exceptionalities
in
Department of Learning Sciences
in
the College of Education and Human Development
Georgia State University
Copyright by Zachary G. Johnson
I would like to dedicate this dissertation to my wonderful parents, Sheila Zachariah and
Sam Johnson. Your unconditional love and unwavering support guided me along this
journey. Additionally, I would like to dedicate this dissertation to my nieces Ela and
Anya, and my soon-to-be-born son. Always know that if your heart is in the right place,
ii
Many people have been instrumental in providing support and encouragement
throughout this dissertation process. First and foremost, I would like to thank my
advisors. Dr. Houchins, thank you for believing in me from the very beginning. I
appreciated your guidance, and toughness, throughout this process. Even though I cringed
every time I saw another round of your edits, I am confident and proud of the final
manuscript. Dr. Varjas, thank you for your continued support; you were as much of a
counselor as you were an advisor and for that I am grateful. Lastly, to my dissertation
committee members Drs. Jimenez and McKinney, thank you for sticking with me and
providing insightful and constructive feedback.
To my Project LEADERS cohort, this would have been an insurmountable task
without you. Drs. James Schwab, Brandis Ansley, and Weke Andrews, I will cherish the
times we spent in class, in the office, and traveling and presenting (and partying) at
conferences. Drs. Mora Pressley and Carrie Powell, your support during the final stages
of this project were paramount in getting me across the finish line. This was a crazy time
in our lives and I couldn’t have asked for a better group of people to walk with me.
Remember, keep moving forward and Matricize, Matricize, Matricize!
To my amazing family, thank you from the bottom of my heart. I am so blessed to
have had you all in my corner. Amit and Priya, I couldn’t have asked for better siblings.
You gave me your shoulders to cry on and firm accountability when I needed it the most.
Mom and Dad, even through all my complaining and self-doubt, you assured me that I
was on the right path and that I could accomplish anything. To my cousins, in-laws, and
iii
but we made it through together. You stood by my side through thick and thin. When I
wanted to give it all up and throw in the towel, you were there to nudge me in the right
direction. You believed in me even when I didn’t believe in myself. There is no way I
could have done this without you and I am eternally grateful to you for your strength. I
iv
LIST OF TABLES………..…....v
LIST OF FIGURES……….…….vi
1 A Literature Review of Blended Learning Studies for Secondary-Level Students With High Incidence Disabilities………...……1
Methods………..…….9
Results………...13
Discussion……….36
Limitations and Future Directions……….45
Conclusions………...49
References……….50
2 Improving Student On-Task Behavior and Teacher Engagement Through Station Rotation Blended Learning ……….……….64
Methods………74
Results………..…...89
Discussion………..…...…92
Limitations and Future Directions………..…...97
Conclusions………..…….99
References………...108
v
Table 1.1 Blended Learning Math Intervention Studies………..18
Table 1.2 Intervention Studies Using CEC Quality Indicators………...28
Table 2.1 Teacher Demographics……….101
Table 2.2 Student Demographics………..102
Table 2.3 On-task Behavior Means, SD, and NAP……….103
Table 2.4 Teacher Social Validity Responses………..104
vi
Figure 2.1 Intervention Outcomes: Student On-task Behavior……….106
STUDIES FOR SECONDARY-LEVEL STUDENTS WITH HIGH INCIDENCE
DISABILITIES
Increasingly, attention has been placed on the academic achievement for all
students, including students with high incidence disabilities (e.g., emotional behavior
disorder, learning disability, mild intellectual disability). The achievement gap between
students with disabilities (SWD) and typically developing students is of particular
concern considering that low academic achievement can limit success in school,
postsecondary education attainment, employment, and independent living (Test et al.,
2009). Although recent reports have suggested slight gains in achievement for SWD in
mathematics and reading (National Assessment of Educational Progress [NAEP], 2013),
the achievement gap remains significantly large between SWD and their peers.
Researchers have noted that SWD often present challenging social and academic
behaviors that can dramatically reduce their access to effective instruction in the
classroom (Aron & Zweig, 2003; Lehr, Moreau, Lange, & Lanners, 2012; McCall, 2003).
The Individuals with Disabilities Education Act (IDEA, 2004) and the Every Child
Achieves Act (2015) have drawn more attention to the academic achievement of SWD
and called for the use of evidence-based practices (EBP) to positively impact social and
academic performance in the K-12 settings.
One instructional practice that has the potential to increase student on-task
behavior and academic achievement is the use of computer-based instruction (CBI;
technology-2013). Early examinations of CBI in special education classrooms found that it offered a
streamlined approach to providing personalized instruction for students based on
individual needs, strengths, and weaknesses (Fitzgerald, Koury, & Mitchem, 2008). Some
of the benefits of using CBI with SWD included: (a) adjusting the level and pace of
instruction; (b) immediate and corrective feedback; (c) establishing clear and attainable
goals; and (d) ease of outcome and formative data (Fitzgerald, Koury, & Mitchem;
Means, Toyoma, Murphy, & Bakia, 2013). Due to the increased focus and extensive
research on the use of CBI in the past few decades, researchers have compiled literature
reviews examining its use specifically with SWD (Kagohara et al.; Vasquez & Straub).
Two literature reviews have examined the use of CBI with SWD (Kagohara et al.,
2013; Vasquez & Straub, 2012). Vasquez and Straub conducted an extensive review of
the online and distance-education intervention literature for SWD. They found six
empirical studies conducted between 2005 and 2010. Of the six included studies, three
were conducted in the K-6 grade setting (Englert et al., 2005; Englert et al., 2007; Yong
& Ping, 2008) while the remaining three were conducted at the high school level (Bozdin
et al., 2007; Izzo et al., 2010; Savi et al., 2008). Participant sample sizes ranged from 12
to 287 and included students with learning disabilities (LD), emotional behavior disorder
(EBD), hearing impairments, and those students considered to be at-risk for disability and
academic failure. One study (16.7%; Yong & Ping) looked specifically at synchronous
online instruction (no delay in the transfer of information similar to watching a live
lecture) while the remaining five studies (83.8%; Bozdin et al.; Englert et al., 2005;
studies focused on outcome measures related to reading, writing, and science; no studies
looked at mathematics achievement. Although only three studies (Englert et al., 2007;
Savi et al; Yong & Ping) found statistically significant findings in favor of experimental
(online instruction) groups compared to traditional textbook-based learning groups, all
studies reported increased rates of on-task behavior. In a review of 15 studies examining
the use of mobile technology instruction for students with developmental disabilities,
Kagohara et al. (2013) reported only one study that focused on academic learning
outcomes (Kagohara, Sigafoos, Achmadi, O’Reilly, & Lancioni, 2012) while the
remaining 14 focused on communication skills, leisure, and employment. In the
single-case academic study (Kagohara, Sigafoos, Achmadi, O’Reilly, & Lancioni), researchers
were interested in teaching two elementary-level students with Asperger’s syndrome and
attention deficit hyperactive disorder (ADHD) to improve their writing by using an iPad
to run spell-check software. During the intervention, participants were exposed to
instructional videos on the iPad; results of the study revealed that students maintained
100% usage of spell-check procedures once video-modeling was removed. Researchers
from these 15 studies reported positive findings pertaining to social behaviors such as
improved communication skills; however, limited conclusions were drawn regarding the
impact on academic achievement. Although mobile technology was used to deliver both
communication skills and academic instruction, the use of instructional technology has
advanced and is being used in ways that combine face-to-face instruction with CBI.
Research in the use of technology-rich environments combined with independent
students (Halverson et al., 2017).
Blended Learning
BL, loosely defined as the combination of face-to-face and CBI (Staker & Horn,
2012), has emerged as the predominant and preferred model of technology-mediated and
computer-assisted instruction (CAI) in the K-12 education setting nationwide (Halverson
et al., 2017; Watson, 2008). Unfortunately, due to the rapid rate of technological
advances and instructional technology integration, it can be difficult to identify adoption
rates of BL in K-12 classrooms. According to Horn and colleagues (2011), K-12 students
enrolled in online courses topped 4 million as of 2010. Surveying national school
districts, Picciano and Seaman (2009) found that 75% of districts reported the use of
online or BL. In 2014, Watson and colleagues found that 28 states indicated they were
using fully online K-5 curricula. Additionally, seven states reported the use of
supplemental online instruction for grades K-5. Unfortunately, when looking for similar
adoption rates of BL models of instruction for SWD, limited research exists regarding the
use and efficacy of BL models of instruction for this population. Although specific
findings regarding current rates of adoption in the special education classroom are
limited, the National Center for Education Statistics (NCES), in 2013, reported that at
least half of the national average of SWDs (7.2%) were enrolled in BL or virtual school
programs between 2011 and 2012 (Gulosino & Miron, 2017). Although initial reviews
and meta-analyses of BL focused primarily on college-level students (Bernard,
Borokhovski, Schmid, Tamim, & Abrami, 2014; Kirkwood & Price, 2014), current
definitions of BL complicate the systematic search of literature.
BL has been presented in various forms over the years based on specific settings,
grade levels, and content areas of instruction. The widely accepted definition of BL is the
combination of teacher-led face-to-face instruction, conducted within a brick-and-mortar
facility, and online- or CBI (Staker & Horn, 2012). Over the years BL, or hybrid
instruction, has taken on different forms; two of the most common formats of BL are the
station-rotation and flipped-classroom models. The flipped-classroom model, pioneered
primarily in postsecondary and undergraduate college courses (Means, Toyoma, Murphy,
& Bakia, 2013; Rooney, 2003), allows the student to navigate instructional content on
their own, away from a brick-and-mortar facilities through online- or CBI, combined with
independent or group classwork with teacher/instructor oversight (Staker & Horn). The
station-rotation model, usually conducted within one particular classroom, involves the
use of small-group centers (or stations) within the classroom that include teacher-led
content instruction, individual remediation, and independent or group practice with one
or more stations utilizing online- or computer-based resources or assignments (Staker &
Horn). Notwithstanding specific forms or methods of implementation, BL has shown
encouraging results with social (Barbour & Reeves, 2009; Haydon et al., 2012;
McDougal, Morrison, & Awana, 2012) and academic outcomes (Bottge, Ma, Gassaway,
Toland, Butler, & Cho, 2014) for students in the K-12 setting.
The use of BL has been shown to positively impact instruction in the following
ways: differentiating instruction (Dziuban et al., 2006); personalized learning
Reeves, 2009; Halverson et al., 2017;) academic achievement (Bottge, Ma, Gassaway,
Toland, Butler, & Cho, 2014; Means, Toyama, Murphy, Bakia, & Jones, 2009); and,
on-task behavior or academic engagement (Barbour & Reeves; Haydon et al., 2012;
McDougal, Morrison, & Awana, 2012). Researchers have examined the corpus of
empirical research in this area in an effort to establish BL as an EBP for students in the
K-12 system; however, little evidence exists as to the effects of BL on academic and
behavioral outcomes for SWD.
Although previous research in BL has focused on students with and without
disabilities, few literature reviews disaggregated findings for SWD. Lo and Hew (2017)
conducted a comprehensive review of the literature in an attempt to locate empirical
research regarding the use of flipped-classroom BL instruction for K-12 students
conducted between 1994 and 2016. Their extensive search yielded a total of 15 studies, of
which 11 studies were comparison studies that compared the BL condition to a traditional
method of instruction. Two of the comparison studies compared flipped-classroom
conditions to modified or different versions of flipped-classrooms (Lai & Hwang, 2016;
Wang, 2016); nine studies (Bhagat et al., 2016; Chao et al., 2015; Chen, 2016; Clark,
2015; DeSantis et al., 2015; Huang & Hong, 2016; Kirvan et al., 2015; Schultz et al.,
2014; Tsai et al., 2015) compared student academic achievement and engagement in
flipped-classrooms to traditional teacher-led conditions. Of the nine comparison studies,
five studies (55%) reported statistically significant findings in favor of the
flipped-classroom group while the remaining four studies (45%) found no significant differences
task behavior of participants, three studies (Bhagat et al.; Chao et al.; Wang) reported an
increase in student motivation and two studies specifically reported an increase in
academic engagement (Clark; Snyder et al., 2014). However, researchers cautioned
generalized interpretations of these findings given that many interventions were
implemented with short durations (e.g., four weeks) and positive outcomes may have
been due to the novelty of using new technology in the classroom (Clark).
Means and colleagues, in two separate meta-analyses (Means, Toyama, Murphy,
& Bakia 2013; Means, Toyama, Murphy, Bakia, & Jones, 2009), examined the effects of
comparison studies looking at online-instruction, partial online blended instruction, and
face-to-face instruction. In 2009, Means et al. conducted a review of 46 studies, yielding
51 effect sizes, which had been conducted since 2004 and included participants ranging
from 8th grade to undergraduate-level college courses. Analysis of the 51 effect sizes
revealed that 28 effects dealt purely with online interventions while 23 provided effects
for BL conditions compared to BAU conditions. Ultimately, they found that classes with
online learning, whether fully online or blended, produced stronger academic outcomes
than those classes taught entirely through face-to-face instruction (main effect size for all
51 contrasts +0.24, p < .001). In a follow up meta-analysis, Means et al. (2013) examined
50 effect sizes found across 45 studies comparing fully online, partial online BL, and
face-to-face instruction. Study participants ranged from age 13 to 44 and included
students in the K-12 system up through graduate school. Although authors reported a
moderate effect of BL compared to BAU (Q = 3.25, p < .001), when looking at the seven
Although Lo and Hew (2017) and both Means et al. studies (2009; 2013) found
positive results regarding the use of BL over traditional means of instruction, limited
findings can be drawn regarding the effects on SWD. There is a clear dearth of research,
specifically literature reviews and meta-analyses, concerning the impacts of BL on the
mathematics achievement and behavioral outcomes for SWD in BL conditions in the
K-12 school system. Thus, the purpose of this review was to locate and examine those BL
mathematics interventions that were used specifically with SWD in the K-12 school
system.
Rationale for Literature Review
The use of BL through online- and CBI can be used to provide teachers with a
means for differentiating instruction, personalizing learning for SWDs, and can improve
academic achievement (Means et al., 2009) and engagement (Barbour & Reeves, 2009).
There has been a considerable increase in the use of online- and computer-based curricula
to provide mathematics instruction to students in the United States (Halverson, Spring,
Huyett, Henrie, & Graham, 2017). Picciano and Seaman (2009), looking at school
districts nationwide, determined that at least 75% of districts reported students receiving
online- or blended instruction (Horn, Staker, Hernandez, Hassel, & Ableidinger, 2011).
Considering that SWD often display negative behaviors that interfere with academic
achievement and engagement (Aron & Zweig, 2003; Lehr, Moreau, Lange, & Lanners,
2012; McCall, 2003), special education teachers should use evidence-based interventions
(Bottge, Ma, Gassaway, Toland, Butler, & Cho, 2014) and academic engagement
(Haydon et al., 2012; McDougal, Morrison, & Awana, 2012). Unfortunately, many of the
recent systematic literature reviews and meta-analyses failed to identify specific BL
interventions that were used for mathematics instruction with SWDs. The purpose of this
literature review was to identify and examine specific BL interventions that were used to
deliver mathematics instruction to secondary-level SWD. The primary research questions
were “What experimental, quasi-experimental, and single-case design BL mathematics
interventions have been conducted with secondary-level SWD?” and “What was the
quality of BL mathematics intervention studies conducted with SWD?”
Method
A systematic review of experimental, quasi-experimental, and single-case design
interventions of BL mathematics studies for SWD was conducted. In order for a study to
be considered for this review, it had to meet the following criteria: (a) the study was
published in English; (b) the participants were enrolled in public schools in grades 6-12;
(c) the intervention specifically mentioned BL or a mixture of CBI and face-to-face
instruction; (d) the participants included students with high incidence disabilities (e.g.,
EBD, LD, other health impaired [OHI], mild intellectual disability [MID]); (e) results
were disaggregated for SWD; (f) at least one outcome measure related to mathematics
achievement; (g) the research was an experimental, quasi-experimental, or single case
design study; (h) the study was in a peer-reviewed journal; and (i) the study was
conducted within the United States. The initial search was carried out using the following
Information Science & Technology Abstracts (ISTA), MEDLINE, MEDLINE with Full
Text, Primary Search, PsycARTICLES, Psychology and Behavioral Sciences Collection,
PsycINFO, and Vocational and Career Collection. The initial search was limited to those
that were published between the years of 1980 and 2018 in order to identify all research
regarding the use of BL and the use of CBI with SWD. Results were limited to
peer-reviewed academic journals. Search terms and combinations included: blended learning
OR "hybrid learning" OR "station rotation" OR "flipped classroom" OR "enhanced
anchored instruction" OR "online learning" OR "online instruction" OR "e-learning" OR
"computer-assisted instruction" OR "computer-based instruction" AND student* with
disabilit* OR "special education" OR "learning disabilit*" OR "emotional behavior
disorder" OR "special education" AND k-12 OR "public school*" OR "middle school*"
OR "high school*" OR "secondary" OR "elementary school*." In addition to the
electronic search conducted using online databases, a hand search was conducted with
seven journals that commonly report studies related to technology use in the classroom
and SWD (Journal of Special Education Technology; Behavioral Disorders; Journal of
Educational Technology & Society; Computers & Education; Online Learning;
International Journal of in Mathematics, Science, and Technology; The Journal of
Special Education; Exceptional Children; Journal of Emotional and Behavioral
Disorders; Remedial and Special Education). After the hand search of available
publications, a comprehensive search of pre-publication articles was conducted with
those journals that offer online-first access including: Exceptional Children, Journal of
online.sagepub.com website.
Finally, a search of Online-First, in-press, and e-journal articles was conducted in
October of 2018. Specific top-tier journals were searched because they regularly publish
high quality academic intervention research pertaining to SWD (i.e., Exceptional
Children, Journal of Emotional and Behavioral Disorders, Remedial and Special
Education, Journal of Special Education Technology, Behavioral Disorders). One
additional study met the inclusion criteria for study analysis. Initial electronic database
search yielded 944 results. Three hundred thirty-one (n = 331) articles were removed
from the list due to repeat entries. The resulting sample included 612 articles.
One additional researcher, familiar with special education research, was trained
how to select appropriate intervention studies by the primary researcher. In addition to
reviewing the requirements for inclusion and exclusion, both researchers examined the
first 10 articles together to ensure that studies were being analyzed in the same way.
Inter-observer agreement (IOA) was calculated by dividing the number of agreements by
the total number of cases then multiplying that number by 100.
In the first round of inclusion/exclusion, both researchers independently reviewed
the title and abstracts of studies to determine if they were intervention studies and
whether or not the focus of the study was mathematics instruction. Articles were
excluded for the following reasons: research-to-practice or policy papers (n = 188),
non-mathematics content (n = 97), English/Language Arts (n = 93), literature reviews and
meta-analyses (n = 53), international (n = 19), correlational (n = 30), or qualitative
discussion.
During the second round of coding, both researchers independently read abstracts
and titles to determine if the studies focused on the correct grade-level, disability
eligibility, or any other inclusion/exclusion parameters that were missed in the previous
round of coding. Fifteen studies were removed because they focused on elementary-level
students, four studies addressed disabilities that were not included in this review, and four
studies were correlational studies. In the second round of coding, agreement between the
two researchers was 94%; 100% agreement was reached after discussing differences.
During the last round of coding, 14 studies were read thoroughly to determine if
all inclusion criteria were met and if the intervention could be considered BL (some
combination of computer- or media-based instruction and face-to-face instruction). Two
studies were not considered to be BL and one was removed because it did not contain
outcome measures related to mathematics achievement. During the final stage of coding,
IOA was 100%.
Once the 12 articles were identified for inclusion in this review, they were further
analyzed and coded for methodological rigor. In order to establish the extent of
methodological rigor, the standards of evidence-based practice in special education,
described by the Council for Exceptional Children (CEC; 2014) were used. The primary
researcher reviewed the rubric for quality indicators provided by the CEC with the
additional researcher; requirements of each indicator were discussed in order to clarify
any ambiguity. The primary researcher created an Excel checklist that contained the
discussed all discrepancies until they reached 100% agreement.
Results
The results of this systematic review of literature are presented in two stages: (a)
synthesis and comparison of specific intervention parameters and outcomes; and (b)
analysis and assessment of methodological rigor based on the CEC (2014) quality
indicators (see Tables 1.1 and 1.2).
Twelve studies were located that met the inclusion criteria. Of the 12 studies, five
studies (41.6%) were single-case design studies and seven studies (58.3%) were group
comparison studies. In an effort to effectively synthesize BL and technology enriched
instructional practices, studies were organized based on how technology was used during
instruction: (a) BL using online- and computer-based curricula instruction/practice, (b)
media-based interventions with video prompting, and (c) technology-mediated strategy
instruction (see Table 1.1).
Online- and Computer-Based Curricula for Instruction/Practice. Three studies
specifically looked at the use of technology and CAI for instruction and practice: one
study compared BAU against CAI combined with face-to-face instruction (Billingsley,
Scheuermann, & Webber, 2009), another study compared the use of an online assessment
and intelligent tutoring program against a BAU condition (Koedinger, McLaughlin, &
Heffernan, 2010), while the third study compared the use of traditional worksheets
against iPad-delivered worksheets (Haydon et al., 2012). Billinglsey and colleagues
(2009) were interested in comparing the effectiveness of three instructional conditions:
alternating treatment single-case design study, the mathematics achievement of 10 SWD
was assessed using teacher-created curriculum-based assessments (CBAs). After
exposing students to each condition over the course of 9 weeks, visual analysis of
outcome data for each participant related to percent of correct answers on teacher-created
mathematics probes showed a clear preference for the combined condition. Similarly,
Koedinger and colleagues (2010) compared the impacts of using the ASSISTments
web-based intelligent mathematics tutoring system to traditional mathematics instruction with
textbook-based instruction over the course of one school year. Mathematics achievement
of 255 sixth and seventh grade SWD was assessed using the Massachusetts
Comprehensive Assessment System (MCAS, 2007). In addition to the overall
mathematics achievement measured by the standardized assessment, the researchers were
also interested in measuring the amount of program usage by both students and teachers.
Regarding the pretest-posttest standardized assessment scores, main effects were noted
for condition (treatment vs. control) and student group (regular vs. special education);
treatment differences for special education students were statistically significant, F(1,
1235) = 11.44, p < .001. Haydon et al. compared the use of iPad-delivered worksheets to
the traditional method (paper-and-pencil) worksheet with three SWD in an AES; student
correct responses on mathematics worksheets increased from between 2.55 to 3.93 from
the traditional worksheet to iPad worksheet condition. Additionally, Haydon and
colleagues observed and reported data pertaining to student active engagement and
conditions (see Table 1.1 for details).
Media-based Interventions with Video Prompting. Seven studies (Bottge et al.,
2004; Bottge et al., 2006; Bottge et al., 2007; Bottge et al., 2010; Bottge et al., 2014;
Bottge et al., 2015; Saunders, Spooner, & Davis, 2018) specifically looked at the effects
of media-based interventions with video prompting on the mathematics achievement of
middle and high school SWD. One such intervention, enhanced anchored instruction
(EAI), is an instructional strategy that utilizes computer-based interactive lessons,
CD-ROM videos, and applied hands-on projects in an effort to improve student
problem-solving and computation skills (Bottge, Rueda, & Skivington, 2006). Four of the EAI
studies compared the use of EAI to business-as-usual (BAU; Bottge et al., 2004; Bottge
et al., 2007; Bottge et al., 2014; Bottge et al., 2015). One study (Bottge et al., 2004) found
mixed results when comparing EAI groups to BAU; results from the word problem test
yielded a significant main effect in favor of the BAU group (F(1 , 83) = 9.30, p = .003, ŋ2
= 0.10) while results from the video problem test showed a statistically significant main
effect in favor of the EAI group (F(1 , 67) = 17.32, p = .000, ŋ2 = 0.21). Using a group
comparison (Bottge et al., 2007), researchers found statistically significant effect sizes in
favor of EAI groups in both the Fractions of the Cost test (t = 5.08, p < .001, Cohen’s d =
1.08) as well as the problem-solving test (ES = .56, p < .01). Utilizing a single-case
design, Saunders and colleagues (2018) looked specifically at three students with MID
and examined the effects of video-prompting and finger-counting on the basic operation
real-world problems. Participants were exposed to video-simulated real-world problems
the change amount, and (e) reading and writing of the question. In addition to finding the
correct answer, student responses were broken down to progressive tasks in order to
achieve the required response; correct responses and steps of the task analysis increases
across all sessions and percent of non-overlapping data (PND) was 100%. Regardless of
the specific type of video-prompting or real-world application, students with high
incidence disabilities demonstrated increased mathematics achievement through this use
of BL across a majority of the studies.
Strategy Instruction. Two single case design studies (Bouck et al., 2017; Sheriff
& Boon, 2014) specifically looked at the instruction of a particular strategy, through the
use of BL, to impact student mathematics achievement. Bouck and colleagues (2017)
were interested in the effects of teaching middle school students with LD, OHI, and MID
to use virtual manipulatives. This strategy is closely tied to the
concrete-representational-abstract (CRA) framework. Students were instructed to use the Fraction Tiles app to
virtually manipulate equivalent fractions, drawing the equivalent fractions with
paper-and-pencil, and then completing mathematics questions related to those fractions. Sheriff
and Boon (2014), on the other hand, taught students to use computer-based graphic
organizers using the Kidspiration 3 software to solve one-step word problems. Three
middle school students with MID participated in the study and were trained on how to
complete computer-based graphic organizers and to use them to answer word problems.
In both studies, mathematics achievement was assessed using the independent practice
work completed by the students. Bouck and colleagues used the results from the Fraction
high incidence disabilities. Bouck and colleagues found that all three students using the
VRA framework increased percentage of correct responses with an average mean of
84.7% and a Tau-U of 98%. Similarly, Sheriff and Boon found that students using the
computer-based graphic organizer intervention increased the number of correct responses
with an overall mean of 47.9% and a PND of 100%. All six students under both strategy
instruction conditions improved their mathematics achievement scores related to one-step
word problems and equivalent fractions.
CEC Quality Indicators
Indicator 1: Context and Setting. All 12 studies (100%) located in this review met
the requirements for context and setting. Eight studies (66.6%) were conducted in public
middle schools (Bottge et al., 2004; Bottge et al., 2010; Bottge et al., 2014; Bottge et al.,
2015; Bouck et al., 2017; Koedinger, McLaughlin, & Heffernan, 2010; Saunders,
Spooner & Davis, 2018; Sheriff & Boon, 2014) while one study (8.3%) was conducted
exclusively with SWD in 6th grade (Bottge et al., 2004). One study (8.3%; Bottge et al.,
2007) was conducted across various schools including middle and high schools in grades
6-12; the remaining three studies (25%; Billingsley, Scheuermann, & Webber, 2009;
Bottge et al., 2006; Haydon et al., 2012) were conducted in high school grades ranging
from 9th through 12th grade. Of the four high school studies, one study (8.3%) was
Table 1.1 Features of Blended Learning Mathematics Studies for Students with Disabilities
Study Context and Setting Participants/ Intervention Agent Independent Variable(s) and Dosage; Implementation Fidelity Research Design Outcome Measures/ Dependent Variable(s) Results Billingsley, Scheuermann, & Webber (2009)
1 Public high school self-contained
classroom
N = 10; ED, LD, OHI, TBI; gr
9-11; 14-17 yrs Classroom
teachers; Teacher training
not described.
(1) Direct teach (2) Computer-assisted instruction (CAI) using
OdysseyWare
(3) Combined direct teach and CAI 3 sessions for each condition over 9 weeks
Fidelity not reported
Alternating-treatments single-subject
Mathematics learning: assessed using teacher-created curriculum-based assessments
(CBAs), baseline probes covered nine objectives to be
covered during intervention; intervention probes were 20
questions covering 10 objectives; probe was also
used as post-intervention measure.
Mean scores for each participant across direct
teach, CAI, and combined condition respectively: Clay (70, 10, 80), Crane (90, 95, 95), Lupita (60, 53, 93),
Thaddeus (70, 40, 53), Manny (5, 27, 42), Bryan (73, 50, 73), Chad
(58, 58, 80), Junior (47, 58, 53), Tyrene (95, 58, 78), and Hank (38, 67,
78). Effect sizes: CAI 0.696, direct teach 0.767,
Bottge, Heinrichs, Mehta, Rueda, Hung, & Danneker (2004) 1 public middle school; Upper Midwest 4 math classes Teacher 1 class
28% disabilities Teacher 2 class
9% disabilities
N = 93, n = 17 SWD; LD, SL,
OHI; gr 6 2 mathematics teachers; 9-26 yrs experience; teacher training not described. Enhanced Anchored Instruction (EAI) and
Text-based instruction
(TBI) No description of
dosage/exposure Observation notes and video recorded sessions, researcher observed 100%
sessions with IOA conducted 10% of the
time 1: group, quasi-experimental 2: longitudinal, multi-level, natural variation design (intervention group only)
Fraction computation test
(FCT), 18-item, addressed add and subtract simple fractions, mixed numbers with and without renaming,
Cronbach’s alpha .98, interrater reliability 99%.
Word problem test (WPT), written at fourth grade level, tested ability to solve single-
and multi-step word problems, content mirrored instruction in EAI and TBI conditions, Cronbach’s alpha .97, interrater reliability 99%.
Video problem test (VPT), solving video-presented construction problem, tested
ability to: compute money, indicate lengths, convert lengths, combine lengths, and
calculate costs, Cranbach’s alpha .80, interrater
reliability 94%.
Hovercraft problem test
(HPT), performance-based assessment, students had to show how to build rollover cage out of PVC pipe by:
calculating money, add/subtract fractions, and determine costs of materials,
Cronbach’s alpha .94, interrater reliability 91%.
FCT: significant interaction between class
and type of instruction,
F(1, 77) = 4.14, p = .04, η2= .05.
WPT: main effect for type of instruction in favor of TBI, F(1, 83) = 9.30, p = .003, η2 = .10,
but not for class, F(1, 83) = 1.43, p = .23, η2 = .02.
VPT: main effect for type of instruction in favor of EAI, F(1, 67) = 17.32, p = .000, η2 = .21,
but not for class, F(1, 67) = 0.05, p = .83, η2 =
.00, or for class by type of instruction, F(1, 67) =
0.96, p = .33, η2 = .01.
HPT: main effect for type of instruction in favor of the EAI group,
F(1, 33) = 6.98, p = .01, η2 = .17, and for session, F(2, 33) = 10.32, p = .00, η2 = .385, but not for
type of instruction by session, F(2, 33) = 0.289, p = .75, η2 = .02.
Bottge, Ma, Gassaway, Toland, Butler, & Choo (2014)
31 public middle schools; Metropolitan Southeast region 15 EAI schools and 16 BAU schools All sessions conducted in resource special education rooms
N = 335, MID OHI EBD SLD,
gr 6-8, age not reported; 49 Special education teachers responsible for intervention implementation,
average 11 yrs special education experience; 2-day summer workshop training conducted by middle school teacher familiar with EAI intervention.
EAI: computer-based interactive lessons, video-based anchored problems,
and hands-on applied projects, areas of focus
include Ratios and Proportional Relationships, Number
System, Statistics and Probability, and
Geometry
BAU: teachers followed regular school math
textbook-based curriculum, objectives in
BAU classrooms paralleled those of the
EAI units
Quasi-experimental group design
FCT, 18-item, addressed add and subtract simple fractions,
mixed numbers with and without renaming, Cronbach’s alpha .98, interrater reliability 99%.
PST-R, 48-item test assesses grade 6-8 concepts in number
operations, measurement, problem solving, and representation, internal consistency alpha .90 and interrater reliability 95%.
ITBS: standardized test subtests that measure operations with whole numbers, fractions, decimals,
and combination of these.
FCT: EAI students over BAU students on all 10 subscales. EAI students
gained about one standard deviation more
than BAU students PST: Significant effect
was found in favor of EAI with the ES approaching moderate
(0.39). ITBS: statistically significant improvement
from pretest to posttest in both instructional groups (ES = 0.56, p <
.01). Bottge, Rueda, Grant, Stephens, & Laroque (2010) 3 public middle schools; Metropolitan region in Pacific Northwest
N = 54; LD, EBD, OHI; gr
6-8; age not reported 1 special education teacher at each
EAI
Informal Instruction +
EAI: three instructional units related to addition/subtraction of fractions using Bart’s Pet
Project, Fraction of the
Pretest-posttest cluster randomized experiment.
FCT, 18-item, addressed add and subtract simple fractions,
mixed numbers with and without renaming, Cronbach’s alpha .98, interrater reliability 99%.
FCT: Informal group scored significantly more
on posttest (16 points). Formal group scored 11 more points on posttest.
Self-contained classrooms District 1 14.1% SWD school; average14 yrs teaching experience, all three taught EAI
for one year prior to study.
2-day EAI
training provided by primary author.
Cost, and Hovercraft Challenge
Formal Instruction + EAI: same as previous condition but Bart’s Pet
Project replaced with explicit instruction 24 days of instruction
Observations, daily logbooks
PST-Revised, 48-item test assesses grade 6-8 concepts
in number operations, measurement, problem solving, and representation, internal consistency alpha .90 and interrater reliability 95%.
Iowa Tests of Basic Skills
(ITBS): standardized test subtests that measure operations with whole numbers, fractions, decimals,
and combination of these. .
from pre- to posttest (ES = 1.16)
ITBS: no significant findings between formal
and informal group regarding pre-to posttest
scores.
Bottge, Rueda, LaRouque, Serlin, & Kwan (2007)
3 public middle and 1
high school self-contained
classrooms
N = 100, LD EBD CD S/L OHI, gr 6-12, age not reported;
4 special education teachers, range 3-37 years SPED teaching, 2-day training on EAI implementation. EAI
Kim’s Komet Instruction: video-based anchor problem designed to help students develop informal
understanding of pre-algebraic concepts (i.e., linear functions, line of best fit, variable, rate of change, reliability)
BAU followed the Connected Math Project
textbook material addressed survival math
skills Mixed method. Pretest-posttest control group with switching replications.
Kim’s Komet Problem-Solving Test (KKPST): tests concepts
taught in Kim’s Komet measuring NCTM standards;
students have to understand figures, construct and interpret
tables/graphs, identify relationships, and make predictions. Items weighted
based on contribution to overall solution. Concurrent validity correlation coefficient
= .52.
ITBS: standardized test subtests that measured operations with
whole numbers, fractions, decimals, and combination of
these.
KKPST: main effects for test wave F(2,128) = 64.43, p < .001, η2 = .50
and test wave-by-instruction interaction
F(2, 128) = 33.32, p < .001, η2 = .34 were
statistically significant. EAI student mean scores
increased significantly compared to control (t = 5.08, p < .001, Cohen’s d
= 1.08).
Bottge, Rueda, & Skivington (2006) 1 Public charter transition school (CTS), alternative high school for students at-risk for behavior issues 2 connected classrooms administrator, counselors, and special educators on staff
N = 17, EBD LD ADHD, gr 9-12, age not reported; court-involved
(98%), substance abuse (90%), homeless
(24%); 2 CTS teachers and 1 university
instructor.
EAI One-group nonequivalent dependent variables design with multiple measures in multiple waves.
FCT, 18-item, addressed add and subtract simple fractions, mixed numbers with and without renaming, Cronbach’s
alpha .98, interrater reliability 99%.
KKPST: tests concepts taught in Kim’s Komet measuring NCTM standards; students have to understand figures,
construct and interpret tables/graphs, identify relationships, and make predictions. Items weighted
based on contribution to overall solution. Concurrent validity correlation coefficient
= .52.
ITBS: standardized test subtests that measure operations with
whole numbers, fractions, decimals, and combination of
these.
FCS: elevated achievement for wave 2 compared to wave 1 (pre
and post instruction),
t(15) = 7.93, p < .001, and for wave 3 compared to wave 1 (maintenance),
t(15) = 6.87, p < .001. KKPST: higher achievement for wave 3 compared to wave 1 (pre
and post instruction),
t(15) = 9.21, p < .001, but not for wave 2 compared to wave 1 (no instruction), t(15) = 1.94,
p = .07 ITBS: paired-samples t-
tests indicated no differences in achievement in computation, t(16) =
0.07, p = 0.94, or in problem solving, t(16) =
Bottge, Toland, Gassaway, Butler, Choo, Griffen, & Ma
(2015) 24 public middle schools; Metropolitan and rural Southeast region comparable across ethnicity, free reduced lunch, and disability rates (specific numbers not provided) Intervention conducted in 25 inclusive math classrooms
N = 248 (n = 134 SWD), MID
OHI EBD SLD, gr 6-8, age not
reported; 25 special education teachers with an average teaching experience of 10.5 years; 2-day 14-hour summer training, recorded sessions so that
teachers could access videos
during intervention.
EAI: computer-based interactive lessons, video-based anchored problems,
and hands-on applied projects, areas of focus
include Ratios and Proportional Relationships, Number
System, Statistics and Probability, and
Geometry
Business as usual (BAU)
Condition: teachers followed regular school
math textbook-based curriculum, objectives in
BAU classrooms paralleled those of the EAI units. Teachers and
students also used technologies, such as computers and interactive
whiteboards, along with manipulatives
Pretest-posttest, cluster-randomized group design
FCT, 18-item, addressed add and subtract simple fractions,
mixed numbers with and without renaming, Cronbach’s alpha .98, interrater reliability 99%.
PST-R, 48-item test assesses grade 6-8 concepts in number
operations, measurement, problem solving, and representation, internal consistency alpha .90 and interrater reliability 95%.
Iowa Tests of Basic Skills
(ITBS): standardized test subtests that measure operations with whole numbers, fractions, decimals,
and combination of these.
FCT: interaction term was statistically significant for students with MD, γ03 = 11.11, p
= .03. Statistically significant treatment effect for EAI students without MD for the FCT,
γ02 = 8.44, p = .001, ES = 0.61. PST: statistically significant treatment
effects for EAI over BAU both with MD, γ02
= 3.98, p = .02, ES = 0.47, and without MD, γ02 = 2.65, p = .02, ES =
0.38.
ITBS: no difference for students with MD by treatment condition, γ02
= 0.34, p = .46, ES = .08.
Bouck,
Bassette, Shurr, Park, Kerr, & Whorley (2017) 1 public middle school; rural Midwest region total school population 439, 26% eligible for free reduced lunch, 8%
N = 3, LD, OHI, MID, gr 7-8,
12-14 yrs; 3 members of
the research team conducted
all intervention sessions in one-on-one format;
Virtual-representational-abstract (VRA):
app-based virtual manipulative, drawing (representational), and only the math problem (abstract), prompts and cues provided as needed, intervention consisted of nine learning sheets (each
stage of VRA had three)
Multiple-probe across participants single-case
design
Researcher-created probe: probe assessed percent accuracy in solving five
problems related to equivalent fractions.
Cora: increased performance on probes
from baseline (M = 0; range = 0) to intervention (M = 80%;
range = 40-100%). Drew: increased performance on probes
from baseline (M = 36.7%; range = 20-40%)
special education all sessions carried out in
the hallway outside of self-contained classroom training was conducted by primary author and lesson format was modeled.
1-2 sessions per week over 15 weeks Two observers conducted
IOA on 33% of all sessions at 100%, implementation fidelity
was assessed using intervention checklists
93.3%; range = 80-100%). Evan: increased performance on probes
from baseline (M = 11.4%; range = 0-40%)
to intervention (M = 94%; range = 60-100%).
Haydon, Hawkins, Denune, Kimener, & McCoy (2012) Public alternative school; Midwest United States 1 high school mathematics classroom Alternative school for grades 2-12 with approximately 65 students
N = 3; ED; gr 9-12; 17-18 yrs;
1 classroom teacher, 4 yrs
teaching experience, masters certification in mathematic instruction; Mobile learning technology (iPads) and
traditional worksheets 40 minutes per day for 15
sessions 94.6% agreement on
100% of classroom observations
Alternating treatment single-case
design
Number of correct responses per minute: recorded number
of problems answered accurately during each
60-second interval. Active engagement: operational definition involved writing, raising hand, choral responding, reading aloud, talking to
teacher/peer about assignment, and placing finger/scrolling on iPad. Momentary time sampling
direct observation.
Number of correct responses: All students
increased from worksheet condition to iPad condition; average increase was 3.23, 3.93, and 2.55 for Sue, Jim, and Andy respectively. 100% of iPad data points
exceeded highest worksheet data point.
Engagement: All students displayed close
to 100% engagement during the iPad condition
Koedinger, McLaughlin, & Hefferenan (2010) 4 public middle schools; metropolitan Northwest region Treatment School A 22%
SWD, School B 19% SWD, School C 23%
SWD, Comparison School D 19%
SWD
N = 1,240; n = 260 SWD;
specific disability eligibilities not described; 7th gr;
age not reported. 42 classroom teachers were responsible for
intervention implementation.
ASSISTments: online assessment and tutoring
curriculum that broke down requisite skills and content knowledge. Using
student performance, program provided remediation when student
missed concepts. In addition to the provision of scaffolded remediation,
students were able to request hints when they
encountered difficulty. Program collected data throughout curriculum
used by the teacher to modify instruction
Quasi-experimental group study; no
random assignment
Massachusetts Comprehensive Assessment System (MCAS): Comprehensive standardized assessment covering grades
3-8.
A 2 × 2 ANCOVA with condition (treatment vs. control) and student group (regular vs. special
education) as factors and pre-test as a covariate revealed main effects for
condition, F(1, 1235) = 12.3, p < .001, and student group, F(1, 1235) = 119.4, p < .001, and an interaction effect between condition and
Saunders, Spooner, & Davis (2018) 1 public middle school; Metropolitan region in the Southeast School served 1,128 students; 38% free and reduced lunch sessions conducted in conference room attached to self-contained classroom
N = 3; MID; gr 7-8; 13-14 yrs
2 doctoral students implemented intervention; between 6 and
16 yrs MID experience;
training not specifically mentioned.
Video-prompting: Video-simulation problems
using the Camtasia
software; 285 real-world math problems filmed and
recorded by third author covering additional and
subtraction change problems. Videos were narrated and contained: (a) context statement, (b) initial set description, (c) action stated, (d) change amount stated, and (e) question written and read
aloud Multiple-probe across participants single-case design Researcher-created probes. Visual confirmation of the participants’ ability to solve a
video-prompted real world problem. Sessions contained 4
addition or subtraction questions broken in to 6 steps
for a total of 24 tasks: (a) viewing video problem, (b)
identifying initial set, (c) demonstrating the change action, (d) identifying change amount, (e) solving and stating
ending amount, and (f) orally stating amount and unit.
Brad: increased performance on probes from baseline (M = 10.5;
range = 7-13) to maintenance (M = 23.25;
range = 21-24). Heather: increased performance on probes from baseline (M = 4.75;
range = 4-6) to maintenance (M = 22.7;
range = 20-24). Benito: increased performance on probes from baseline (M = 3.1;
range = 0-6) to intervention (M = 16.5;
range = 7-24). Visual analysis of data
Sheriff & Boon (2014) 1 public middle school; Rural Southeast sessions conducted in self-contained special education classroom total school size 816 students, 41% free reduced lunch and 13% special education
N = 3; MID; gr 6-8; 13-14 yrs;
1 special education teacher and 2 paraprofessional
Computer-based graphic organizers using the
Kidspiration 3 software. Graphic organizers contained text of a word
problem and template with boxes and the result
set arranged as a math equation 8 weeks IOA on 100%
paper-and-pencil probes and 100% sessions observed using procedural checklist Multiple-probe across participants single-case design Teacher-generated worksheets containing nine one-step word
problems; 3 addition, 3 subtraction, and 3 multiplication problems. Problems only involved one step and did not include any
extraneous data.
Sandy: increased performance on probes from baseline (M = 2.75;
range = 2-3) to maintenance (M = 6.5;
range = 6-7). Ken: increased performance on probes from baseline (M = 1.8;
range = 1-2) to maintenance (M = 6.67;
range = 6-7). Nathan: increased performance on probes from baseline (M = 1.88;
range = 1-2) to maintenance (M = 6.67;
range = 6-7). Visual analysis of data
show functional relationship between
digital graphic organizers and word
problem accuracy.
Table 1.2 Methodological Rigor by Quality Indicator
Intervention Study
Quality Indicator
Billingsley, Scheuermann
, & Webber (2009)
Bottge et al. (2004)
Bottge et al. (2006)
Bottge et al. (2007)
Bottge et al. (2010)
Bottge et al., (2014)
Bottge et al., (2015)
Context and setting 1/1 1/1 1/1 1/1 1/1 1/1
1/1
Participants 2/2 2/2 2/2 2/2 2/2 2/2
2/2
Intervention agent 1/2 2/2 1/2 2/2 2/2 2/2
2/2
Description of practice 2/2 2/2 2/2 2/2 2/2 2/2 2/2
Implementation fidelity 3/3 2/3 3/3
2/3 3/3 3/3 3/3
Internal validity 4/6 5/6 6/6 6/6 6/6 6/6
6/6
Outcome measures/
dependent variables 6/6 6/6 6/6 6/6 6/6 6/6 6/6
Data analysis 1/1 2/2 2/2 2/2 2/2 2/2 2/2
Quality Indicators Met
(%) 6/8 (75) 6/8 (75) 7/8 (87.5) 7/8 (87.5) 8/8 (100) 8/8 (100) 8/8 (100)
Methodological Rigor by Quality Indicator
Quality Indicator Bouck et al.
(2017)
Haydon et al. (2012)
Koedinger, McLaughlin & Heffernan
(2010)
Saunders, Spooner, & Davis (2018)
Sheriff & Boon (2014)
Total of Each Indicator
Interobserver Agreement
(%)
Context and setting 1/1 1/1
1/1 1/1 1/1 12/12 100
Participants 2/2 2/2 0/2 2/2 2/2 11/12 100
Intervention agent
1/2 2/2 1/2 1/2 2/2 8/12 95.83
Description of practice
2/2 2/2 1/2 2/2 2/2 11/12 95.83
Implementation fidelity
3/3 2/3 1/3 3/3 3/3 8/12 94.4
Internal validity
6/6 6/6 4/6 5/6 5/6 7/12 96.29
Outcome measures/
dependent variables 5/5 6/6 5/6 5/5 5/5 11/12 98.6
Data analysis 1/1 2/2 2/2 1/1 1/1 12/12 100
Quality Indicators Met
(%) 7/8 (87.5) 7/8 (87.5) 2/8 (25) 6/8 (75) 7/8 (87.5) 97.6