Strength Behaviour of Pervious Concrete
Revathy SJ*, Anusree.L**, Sethuparvathy S** ,Lenin Babu S**
* Assistant Professor,Civil Engineering Department, Vidya Academy of Science and Technology , Technical campus
** Assistant Professor,Civil Engineering Department, Vidya Academy of Science and Technology , Technical campus
DOI: 10.29322/IJSRP.9.01.2019.p85103 http://dx.doi.org/10.29322/IJSRP.9.01.2019.p85103
Abstract- One among the main reason for water not soaking into the soil is the construction of impervious surfaces. A simple solution to this problem is the construction of pervious surfaces. Pervious concrete are special type of concrete with high porosity. In this paper, we mainly tested the strength of conventional and pervious concrete with same volume , same water cement ratio and aggregrate cement ratio
Index Terms- Porosity, compression strength , modulus of elasiticity, Void ratio, splitting tensile strength
I. INTRODUCTION
Large amount of rainwater ends up falling on impervious surfaces like sidewalks , streets rather than soaking into the soil .This creates imbalance and causes erosion , floods . A simple solution to avoid these problems is to stop constructing impervious surfaces which blocks the movement of water. Hence the concept of pervious concrete or porous pavement , a material that offers inherent durability and low life cycle cost came into existence.Portland cement pervious concrete (PCPC) is very popular and design with high void content (15-25%). the pervious concrete have no fine aggregrate content. It also has interconnected voids and because of that water will percolate and spread in all direction which is not possible if those joints are not interconnected
II.SCOPEOFTHESTUDY
The use of the pervious concrete has increased significantly But there are number of ares that need additional work to improve the properities of pervious concrete.To ensure this , we conducted various tests to study the strength with varying size range of coarse
aggregate and checked the permeability of pervious concrete with increase in coarse aggregate size
II. MATERIALSUSED
The materials are collected locally near our area
1)ORDINARY PORTLAND CEMENT: OPC of 53 grade with flyash was used. It is mixed with water and quarry dust and coarse aggregate to make conventional Concrete and mixed with coarse aggregate only to make pervious Concrete.
2)QUARRY DUST: It is the byproduct of the crushing processess in quarrying activities. Quarry dust passes through 4.75mm sieve was taken.
III. PROPERITIES OF MATERIALS
1)ORDINARY PORTLAND CEMENT :Standard Consistency , Initial Setting Time and Fineness Modulus were determined for OPC taken. The standard Consistency of Cement was obtained as 39% .Table 1 shows the variation of consistency obtained.
Table 1 : Variation of Consistency
Sl No Percentage of water Quantity of water added Penetration of Plunger (mm)
1 28 112 17
2 30 120 15
3 33 132 12
4 35 140 10
5 39 156 7
The initial setting time of the cement was obtained as 50 minutes which is greater than nominal value of 30 minutes
Specific Gravity of cement was determined in Le-Chatelier Apparatus and the value obtained as 3.15.
Fineness of cement is measured by sieving it on standard sieve . The proportion of cement of which the grain sizes are larger than the specified mesh size is thus determined. The value obtained was 9 %. According to IS specification, the percentage weight of residue shall not exceed 10%.
2)QUARRY DUST : The tests Conducted for quarry dust includes Void Ratio test,Bulking of aggregrate,Fineness modulus.
Figure 1: Bulking of Quarry Dust
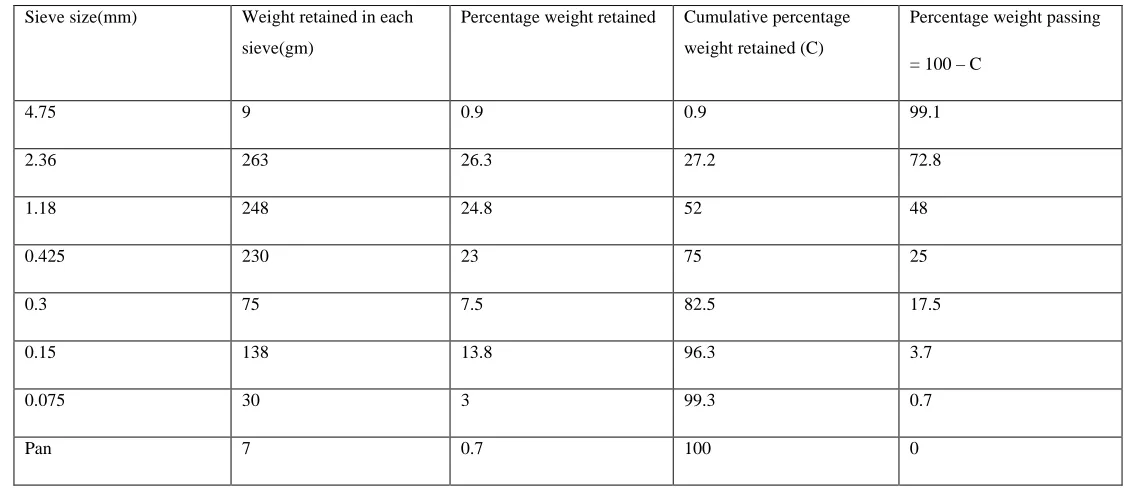
Fineness Modulus as 4.33 was obtaiined from sieve analysis(Table 2)
Table 2: Sieve Analysis
Sieve size(mm) Weight retained in each
sieve(gm)
Percentage weight retained Cumulative percentage
weight retained (C)
Percentage weight passing
= 100 – C
4.75 9 0.9 0.9 99.1
2.36 263 26.3 27.2 72.8
1.18 248 24.8 52 48
0.425 230 23 75 25
0.3 75 7.5 82.5 17.5
0.15 138 13.8 96.3 3.7
0.075 30 3 99.3 0.7
Pan 7 0.7 100 0
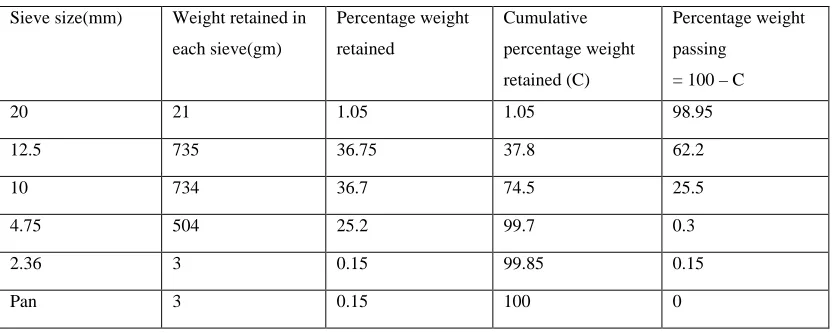
3)COARSE AGGREGATE: Fineness modulus was determined from sieve analysis . The table 3 and Figure 2 shows the findings for the fineness modulus of coarse aggregate.
34.71
51.55 55.56 45.84
38.48
0
0 10 20 30 40 50 60
0 5 10 15 20
%
O
F
BULK
ING
% OF WATER ADDED
[image:3.612.22.588.400.644.2]Table 3: Sieve Analysis of Coarse Aggregate
Sieve size(mm) Weight retained in
each sieve(gm)
Percentage weight
retained
Cumulative
percentage weight
retained (C)
Percentage weight
passing
= 100 – C
20 21 1.05 1.05 98.95
12.5 735 36.75 37.8 62.2
10 734 36.7 74.5 25.5
4.75 504 25.2 99.7 0.3
2.36 3 0.15 99.85 0.15
Pan 3 0.15 100 0
Figure 2: Particle Size Distribution Curve
The aggregate impact value was obtained from impact testing machine . It was obtained as 29.9 % . According to IS specification it should not be greater than 30 %
The specific gravity of aggregate is obtained by determinig the ratio of the weight of a given volume of aggrgate to the weight of equal volume of water .It was obtained as 2.72 . according to IS specification the specific garvity is in between 2.5 -3
V .METHODOLOGY AND MIX DESIGN
The methodology of the work is as follows:
1)Collection of materials : Suitable materials are collected by means of sieve Analysis
2)Selection of Mix Design
0.15 0.3 25.5
62.2 98.95
0 20 40 60 80 100
0.1 1 10 100
%
F
INER
[image:4.612.99.515.75.242.2]4)Preparation of Concrete mix and specimen
5)Curing
6)Laboratory Tests
Mix design is process of selecting proper material with their proper proportions to produce a concrete which will not only be economical
but also fulfill its job requirements.Here we estimated the amount of materials required for casting pervious concrete and conventional
concrete. The mix design we selected is M20 with mix proportion 1:2:4. Normal concrete is prepared in this ratio with aggregate size
ranging from 10 to 20 mm. Pervious concrete casted with aggregate size ranging from 10 to 20 mm in the proportion 1:0:4 is compared
with the convention concrete mix on the basis of same cement to coarse aggregate ratio as 1:4. Another mix of pervious concrete was
prepared with coarse aggregate size ranging from 20 to 31.5 mm and is compared with first proportioned pervious concrete.
VI . LABORATORY TESTS
1)Slump Test:
Slump cone is used in this test.The mould is placed on a smooth, horizontal, rigid and non-absorbant surface. The mould is then filled
in four layers, each approximately 1/4th of the height of the mould. Each layer is tamped 25 times by the tamping rod taking care to
distribute the strokes evenly over the cross section. The tampings are provided vertically and freelly. After the tamping of top layer, the
top surface is struck off and level with a trowel and tamping rod. Then the mould is removed from the concrete immediately by raising
it slowly and carefully in a vertical direction. This allows the concrete to subside.The difference in level between the height of the mould
and that of the highest point of the subside concrete is measured. This difference in height in ‘mm’ is taken as SLUMP OF CONCRETE.
2)Compaction Test :
The compaction factor apparatus is cleaned and oiled.The weight of the empty cylinder is noted (W1).The empty cylinder and mould is
kept in position.The sample of concrete to be tested is placed in the upper hopper with a trowel. Fill the concrete upto the brim of the
hopper and open the trap-door. So that concrete falls into the lower hopper.The trap-door of lower hopper is opened. So that the concrete
falls into the cylinder at the bottom.The excess concrete above the top level of cylinder iswiped clean.The cylinder filled with partially
compacted concrete is weighted (W2).The partially compacted concrete is poured back and the cylinder is refilled with the same sampli
of concrete mix in 3 layers. Each layer is tamped 25 times using tamping rod to get fully compacted concrete.The top surface is levelled
and the outside of the mould is wiped clean. The weight of cylinder with fully compacted concrete is taken (W3).The compaction factor
= 𝑊𝑊2−𝑊𝑊1
𝑊𝑊3−𝑊𝑊1
3)Compressive Strength Test
The compressive strength test is conducted on cubical specimen after 7days,14 days and 28 days of curing. Cubes are tested
for calculating compressive stress on 7th day,14th day and 28th day. Take cubical specimens of size 150*150*150mm from the curing
tank.Place the specimen in the compression testing machine in such a way that, the casted portion should not face the loading
surfaces.Apply load without shock in a specific rate of loading.Apply the load in the same rate until the specimen breaks.Note the
maximum load taken by the specimen.Repeate the procedure for other cubical specimens.Calculate the compressive strength of each
specimen.Final compressive strength of concrete cube is the mean value compressive strength of each cubical specimen.
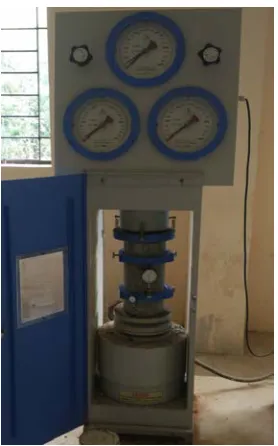
Take the cylindrical secimen from the curing tank after 28 days of curing.Clean the suface of specimen using damp cloth.Attach the
compressometer to the cylindrical specimen in such a way that the cylinder will project equally in both sides compressometer.Place the
specimen with compressometer in the compression testing machine.Apply load continuously at uniform rate of loading.Apply the load
until some redings are noted from the compressometer in approximately equal intervel of loading in the compression tesing
machine.Deformation is calculated by multiplying the compressometer reading to its least count i.e, 0.002mm.The deformation divided
by the gauge length of compressometer i.e, 150mm will give the stain value.The corresponding loads divided by the area of cylinder
i.e, 𝜋𝜋𝜋𝜋²
4 where ‘d’ is the diameter of cylinder will give the stress value.Plot stress – strain graph which is in parabolic shape.The slope of
[image:6.612.237.376.205.428.2]the straight line portion of the graph will give modulus of elasticity value.
Figure 3: Modulus of Elasticity Test
5)Void Ratio Test
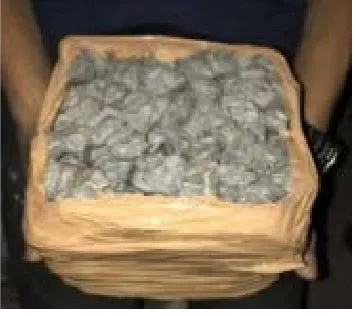
The void ratio of Pervious Concrete is measured on 28th day after casting and curing of Pervious Concrete in following steps:
Pervious Concrete cube is wrapped up with polythene covering all its vertical faces and bottom face and leaving only the top face
open.To make sure that Pervious Concrete cube is watertight; it is further wrapped up with tape covering all its vertical faces and bottom
face.Cube covered on its five faces and open at top face is placed on a flat horizontal surface and water is poured from the top.
To make sure that covering polythene does not expand due to lateral pressure of water it is pressed by hands while water is being poured.
Water is poured till all the voids are filled and water surface matches with the top face of Pervious Concrete.
Once pouring of water is stopped and all voids are filled, Pervious Concrete is turned upside down and all the water is allowed to drain
out of Pervious Concrete cube and collected into a container.Volume of water collected in container is measured and it is equal to the
volume of voids in cube, using it and volume of Pervious Concrete cube, void ratio is foundout.
Figure 4: Void Ratio Test
VI.RESULTS AND DISCUSSION
1) Variation Of Slump :
The slump test was conducted on conventional concrete mix and pervious concrete mix with both having coarse aggregate size ranging
from 10 to 20 mm. pervious concrete prepared with this aggregate size (10 to 20mm) are represented as pervious concrete 1 and the
other pervious concrete with coarse aggregate size 20 to 31.5 mm is represented as pervious concrete 2.TAble 4 shows the variation of
[image:7.612.86.514.419.505.2]slump values.
Table 4: Variation of slump value
TYPE OF CONCRETE SLUMP VALUE (mm) TYPE OF WORKABILITY
Conventional 6 Stiff
Pervious concrete 1 0 Stiff
2)Variation of Compaction Factor
The compaction factor test was also conducted on conventional concrete mix and pervious concrete 1 mix.The obtained results are
shown in Table 5.From that we can see that compaction factor for the CC is slightly higher than PC1 by a value of 0.03. So as per IS
specification we can identify the type of workability of these concrete mixes.
Table 5:Variation of Compaction Factor
TYPE OF CONCRETE COMPACTION FACTOR TYPE OF WORKABILITY
Conventional concrete 0.83 Stiff Plastic
[image:7.612.108.496.615.702.2]3 ) Variation of Compressive Strength
The compressive strength test was conducted on cubical specimens. We conducted the test in the cubical concrete specimens
after the 7th , 14th and 28th days of curing. Single cubes are used for finding out the compressive strength at 7th , 14th and 28th days. Figure
5 represent the variation of compressive Strength.
Figure 5: Variation of Compressive Strength
4)Variation of Modulus of Elasticity
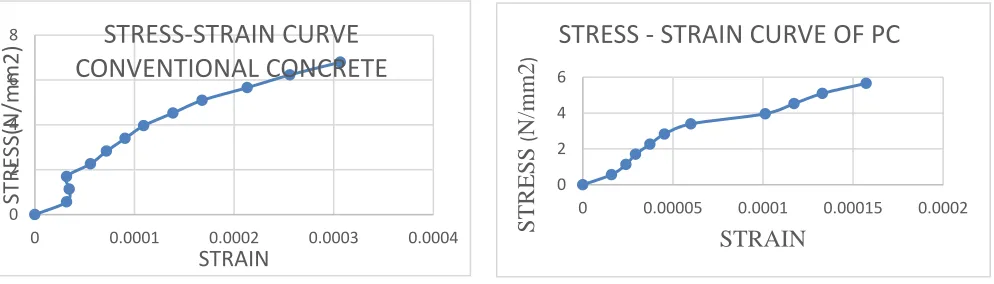
The modulus of elasticity test was conducted on cylindrical concrete specimen of 300mm height and 150mm diameter. The stress –
strain graph for each concrete mixes are drawn and the modulus of elasticity value is calculated by taking the slope of the straight
portion of graphs.Figure 6 represent the stress strain curve of (a) normal concrete (b) Pervious Concrete
[image:8.612.192.454.134.288.2]Figure 6: Stress Strain curve (a) normal Concrete (b) Pervious Concrete
5)Variation of Void Ratio
Void ratio test was conducted on pervious cubes of size 150*150*150 mm after 28 days of curing. Void ratio is the factor which determines the permeability of pervious concrete. Table 6 shows the variation of void Ratio
Table 6 : Variation of Void ratio
Type of concrete Weight before
addition of water.
Weight after addition of water.
Volume of voids (Vv).
3
Void ratio = 𝑽𝑽𝑽𝑽
𝑽𝑽𝑽𝑽∗ 𝟏𝟏𝟏𝟏𝟏𝟏. 14.4 17.6 24 14.13 17.06 23.5 9.6 11.73 16
7TH DAY 14TH DAY 28THDAY
co m pr es siv e s tr eng th (N /mm2)
cc Pc1 Pc2
0 2 4 6 8
0 0.0001 0.0002 0.0003 0.0004
ST
RE
SS(
N/
mm2
)
STRAIN
STRESS-STRAIN CURVE
CONVENTIONAL CONCRETE
0 2 4 60 0.00005 0.0001 0.00015 0.0002
STR
ESS
(N
/mm2
)STRAIN
[image:8.612.40.537.402.544.2]Pervious concrete 1.
7.267 8.165 8.98*10-4 26.61%
Pervious concrete 2.
7.863 8.986 1.123*10-3 33.27%
VII .CONCLUSION
The results shows that, both the conventional concrete and pervious concrete mix 1 has almost same rate of gain of strength.
From the laboratory tests and analysis, following conclusion were arrived.
Slump test is conducted on conventional concrete and pervious concrete mix having coarse aggregate size 10 to 20 mm and it
shows there is no change in the type of workability of the concrete mixes from normal concrete mix.
Compaction factor test is conducted on both the conventional concrete and pervious concrete 1 and the results shows the workability
of concrete mixes are same.
Compressive strength of both the conventional concrete and pervious concrete 1 are almost same. Because the strength offered by
the quarry dust to the conventional concrete is less when compared to river sand.
The characteristic compressive strength of CC is 24 N/mm2 and that of PC1 is 23.4 N/mm2.
Modulus of elasticity value is also almost same for both CC and PC1 and it is little higher for CC. The obtained Modulus of
elasticity of both cc and pc1 satisfies the condition 5000* √(fck)
Void ratio of Pervious Concrete mix 2 is higher than that of pervious concrete mix 1. Hence the permeability of PC2 will be
higher than PC1.
The compressive strength of PC1 is higher than that of PC2. The strength reduction of PC2 is due to the increase in the void ratio and porosity. Hence it can be concluded that, as the size of coarse aggregate increases, the void ratio increases and strength decreases.
REFERENCES
[1] Darshan S.Shah/Pervious Concrete: “New Era For Rural Road pavement” / International Journal of Engineering Trends and Technology /Volume 4 August 2013. [2] Vikram/ “Experimental Study of Pervious Concrete Pavement”/International Journal for Research in Applied Science & Engineering Technology /volume 3 July 2015.
[3] Alessandra Bonicellia / “Improving Pervious Concrete Pavements for Achieving More Sustainable Urban Roads”/World Multidisciplinary Civil Engineering-Architecture-Urban Planning Symposium /Volume 1 2016.
[4] Maniarasan.S.K, Nandhini.V, Kavin.G, Kavin Kumar.T.R/ “Study on Characterization of Pervious Concrete for Pavements” /International Journal of Research in Engineering and Applied Sciences (IMPACT FACTOR – 5.088)/ Volume 5, Issue 4(April, 2015).
AUTHORS
First Author – Revathy S J, MTech, Vidya Academy of science and Technology Technical Campus , Kilimanoor and [email protected]
Second Author –Anusree L,MTech, Vidya Academy of science and Technology Technical Campus , Kilimanoor and [email protected]
Third Author – Sethuparvathy S, MTech, Vidya Academy of science and Technology Technical Campus , Kilimanoor and [email protected]