SRJIS/BIMONTHLY/SURESH G. ISAVE (1521-1532)
NOV-DEC, 2015, VOL-3/21 www.srjis.com Page 1521 A STUDY OF STUDENT-TEACHERS’ USE OF BROWSING
Suresh G. Isave
Associate Professor, Tilak College of Education, Pune
1. Introduction:
Its era of technology. Students are techno savvy. Especially students of B.Ed. course who start their admission process by filling online application form. Many students having smart phones. Educationists always want to use ICT for education, so they are interested to know about the use of ICT by students. Browsing skill is first level of use of ICT. Most of users start the use of internet by browsing. Its comparatively easy skill. So researcher selected the area of use of browser by students, to know their e-skill level. Researcher collected this data as a part of Ph.D. research. The purpose was to find the status of the use of ICT by student-teachers of B.Ed. course. Further, researcher would use this for the development of the e-content which will helpful to acquire them different e-skills.
2. Objectives :
i) To the Availability of browsing resources with student-teachers. ii) To know the names of browser student teachers us.
iii) To indentify the purpose of student-teachers of browsing. iv) To know the frequency of browsing of student-teachers. v) To find out the difficulties in browsing by student-teachers. 3. Research Questions:
Q1. What browsing resources are available with student-teachers? Q2.Which browsers are used by the student-teachers?
Q3. What is the purpose of browsing?
Q4. How frequently student-teachers browse?
Q5. What are the difficulties faced by student-teachers in browsing?
SRJIS/BIMONTHLY/SURESH G. ISAVE (1521-1532)
NOV-DEC, 2015, VOL-3/21 www.srjis.com Page 1522 4. Operational Definitions:
i) Student-teacher – Students who admitted for B.Ed. one year course of Savitribai Phule Pune University in the academic year 2014-15, with English medium.
ii) Browsing – Searching information on the internet by using search engines. 5. Scope:
The results of the study are applicable to student-teachers of B.Ed. course of Savitribai Phule Pune University.
6. Method :
Survey method from descriptive research has been used for the research.
7. Sample : The data was collected from 498 student teachers of B. Ed. students from 10 English Medium college affiliated to Savitribai Phule Pune University, Pune. The student teachers were selected by random sampling.
8. Tool of Data Collection :
The survey questionnaire was developed by the researcher. There were 10 MCQs and one open ended question in the questionnaire covering various aspects of use of browsing
9. Data Analysis :
The analysis of the data collected from questionnaire was done by using two techniques. Closed ended questions were analyzed by Percentages and open ended questions were analyzed by Grounded Theory approach. The analysis has been presented in tabular and graphical form.
[image:2.595.144.487.557.629.2]Q1.Do you use internet?
Table 1 : No of student-teachers using Internet
Sr.
No. Course No. of responses Percentage
1 Yes 308 62%
2 No 190 38%
SRJIS/BIMONTHLY/SURESH G. ISAVE (1521-1532)
NOV-DEC, 2015, VOL-3/21 www.srjis.com Page 1523 62%
38%
Yes No
Figure1 : No of student-teachers using internet facilities Observation:
308 of student teachers uses internet and 190 student-teachers not use internet. Interpretation:
Most of the student-teachers of B. Ed. course use internet. Some of them not use internet.
[image:3.595.168.420.65.253.2]Q.2 Do you have owned personal computer?
Table No. 2: Computer owners
Sr.
No. Course No. of responses Percentage
1 Yes 77 15%
2 No 231 47%
3 Not using internet 190 38%
Total 498 100%
Observation:
77 students-teachers i.e. 15% of student-teachers had their own personal computer, 231 student-teachers i.e. 47% student-teachers not having personal computers.
Interpretation:
Majority of the student-teachers not owned personal computers.
SRJIS/BIMONTHLY/SURESH G. ISAVE (1521-1532)
[image:4.595.125.491.425.559.2]NOV-DEC, 2015, VOL-3/21 www.srjis.com Page 1524 If yes, specify the personal computer.
Table 2.1: Type of computer
Sr.
No. Course No. of responses Percentage
1 Desktop 35 7%
2 Tablet 10 2%
3 Laptop 22 4%
4 Notebook 10 2%
Not using Computer 190 38%
Total 498 100%
Observation:
35 student-teachers (7%) had desktop computers, 22 student-teachers (4%) had laptop, 10 student-teachers (2%) had tablet pc and 10 student-teachers 92%) had notebook computers.
Interpretation:
Majority of student-teachers from student-teachers having own computers had desktop computer.
Q.3 Where do you access internet? (tick more than one option, if applicable) Table 3 : Place of access the internet
Sr.
No. Responses No. of Respondents Percentage
1 Home 48 10%
2 Cyber Cafe 148 30%
3 Mobile 92 18%
4 Tablet 20 4%
5 Other 00 00%
Not using internet 190 38%
Total 498 100%
Observation:
148 students-teachers i.e. 30% of student-teachers used internet from cyber cafe, 92 students-teachers i.e. 18% of student-teachers used internet from mobile phone, 48 teachers i.e. 10% of student-teachers used internet from home, 20 students-teachers i.e. 4% of student-students-teachers used internet from tablet pc.
Interpretation:
SRJIS/BIMONTHLY/SURESH G. ISAVE (1521-1532)
NOV-DEC, 2015, VOL-3/21 www.srjis.com Page 1525 47%
15% 38%
[image:5.595.140.488.113.388.2]Yes No Not using internet Q.4 Do you have smart phone?
Table 4 : Having Smart Phone
Sr.
No. Responses No. of Respondents Percentage
1 Yes 138 28%
2 No 170 34%
3 Not using internet 190 38%
Total 498 100%
Figure 4 : student-teachers with smart phone Observation:
138 students-teachers i.e. 28% of student-teachers had a smart phone, 170 students-teachers i.e. 34% of student-teachers did not have smart phone.
[image:5.595.142.488.562.650.2]Interpretation: Most of the student-teachers did not have smart phone. Q5. Do you have internet on mobile?
Table 5 : Internet on mobile
Sr.
No. Responses No. of Respondents Percentage
1 Yes 121 24%
2 No 187 38%
3 Not using internet 190 38%
SRJIS/BIMONTHLY/SURESH G. ISAVE (1521-1532)
[image:6.595.184.447.63.269.2]NOV-DEC, 2015, VOL-3/21 www.srjis.com Page 1526 Figure 5 : Student-teachers mobile with internet
Observation:
121 students-teachers i.e. 24% of student-teachers had internet on their mobile phone, 187 students-teachers i.e. 38% of student-teachers did not have internet in their mobile.
Interpretation:
Most of the student-teachers did not have internet on mobile. Q6.Which search engine do you use for search?
Table 6 : Use of Search engine
Sr.
No. Responses
No. of
Respondents Percentage
1 Google 246 50%
2 Yahoo 46 9%
3 MSN 12 12%
4 Other 4 1%
5 Not using internet 190 38%
Total 498 100%
47%
15% 38%
[image:6.595.118.512.462.581.2]SRJIS/BIMONTHLY/SURESH G. ISAVE (1521-1532)
[image:7.595.163.472.66.269.2]NOV-DEC, 2015, VOL-3/21 www.srjis.com Page 1527 Figure 6 : Use of search engine by student-teachers
Observation:
246 student-teachers (50%) did search by using Google search engine tool. 46 student-teachers (38%) did search by using yahoo search engine.
12 student-teachers (2%) did search by using MSN search engine. 4 student-teachers (1%) did search by using other search engine.
190 student-teachers (38%) did not respond the question because they didn’t use
internet.
Interpretation:
Most of the student-teachers used Google search engine.
Other search engines i.e. yahoo, MSN etc were used by some teacher educators. Student-teachers who not used internets ever were not responded to answer these
questions.
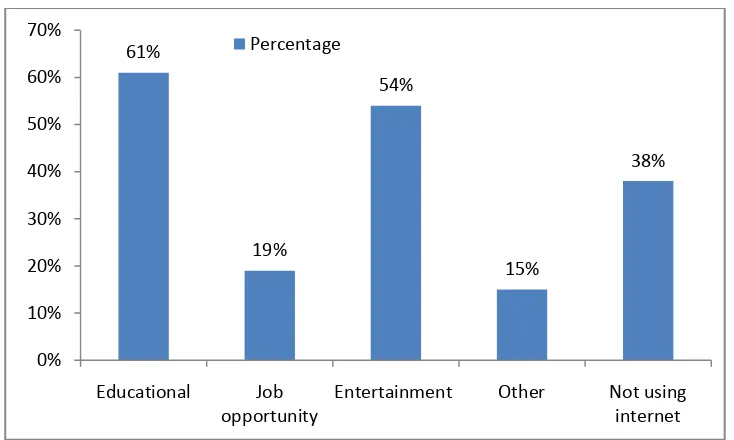
Q.7 What is your purpose of browsing? (Please tick one or more options if required)
Table 7 : Purpose of browsing
Sr.
No. Responses
No. of
Respondents Percentage
1 Educational 303 61%
2 Job opportunity 93 19%
3 Entertainment 297 54%
4 Other 73 15%
5 Not using internet 190 38%
Total 498 100%
Google, 50%
Yahoo, 9% MSN, 12%
Other, 1%
Not using internet, 38
%
[image:7.595.114.517.607.729.2]SRJIS/BIMONTHLY/SURESH G. ISAVE (1521-1532)
[image:8.595.133.500.73.293.2]NOV-DEC, 2015, VOL-3/21 www.srjis.com Page 1528 Figure 7 : Purpose of browsing of student-teachers
Observation:
303 student-teachers (61%) did browsing for educational purpose. 93 student-teachers (19%) did browsing for job opportunity.
297 student-teachers (54%) did browsing for entertainment purpose 73 student-teachers (15%) did browsing for other purpose
Interpretation:
Most of the student-teachers did browsing for educational and entertainment
purpose.
Some of the student-teachers did browsing for job search and other purposes.
Q.8 Which of the following facilities of smart search you can use? (Please tick one or more options if required)
Table 8 : use of facilities of smart search
Sr.
No. Responses
No. of
Respondents Percentage
1 Advance search 23 5%
2 Search filter 8 2%
3 I m feeling lucky 00 00%
4 Specific file search by type 7 1%
5 Search in different languages 3 1%
6 Video search 48 10%
7 News search 36 1%
8 Book search 32 6%
9 Voice search 20 4%
10 None of above 40 8%
Not using internet 190 38%
Total 498 100%
61%
19%
54%
15%
38%
0% 10% 20% 30% 40% 50% 60% 70%
Educational Job opportunity
[image:8.595.115.514.575.764.2]SRJIS/BIMONTHLY/SURESH G. ISAVE (1521-1532)
NOV-DEC, 2015, VOL-3/21 www.srjis.com Page 1529 Observation:
23 student-teachers (5%) used advanced search feature in browsing. 8 student-teachers (2%) used search filter feature in browsing.
No student teachers used “I am feeling lucky’ feature in the browsing.
7 student-teachers (1%) used ‘specific file search by type’ feature in the browsing. 3 student-teachers (1%) used ‘search in different languages’ in the browsing. 36 student-teachers (7%) used ‘news search feature’ in the browsing.
32 student-teachers (6%) used ‘book search’ feature in the browsing. 20 student-teachers (4%) used ‘voice search’ feature in the browsing.
40 student-teachers (8%) used none of the feature of the smart browsing mention
above.
Interpretation:
Many student teachers used advance search, video search, news search, book
search and voice search these features of smart browsing.
Search by file type, search in different language, search filter etc feature used
by few student teachers.
I am feeling lucky’ feature not used any student teachers.
Many student-teachers not used any feature mentioned in the options.
Figure 8 : Use of facilities of smart search 5%
2%
0% 1% 1%
10% 1% 6% 4% 8% 0% 2% 4% 6% 8% 10% 12% Advance search Search filter
SRJIS/BIMONTHLY/SURESH G. ISAVE (1521-1532)
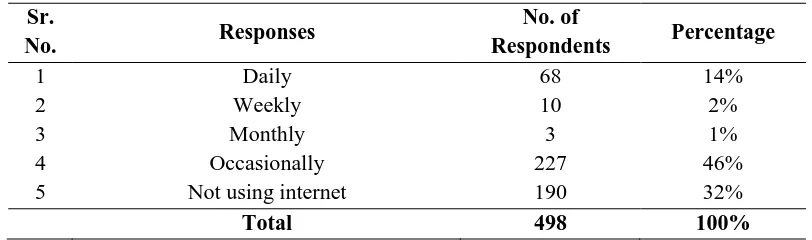
[image:10.595.112.518.117.237.2]NOV-DEC, 2015, VOL-3/21 www.srjis.com Page 1530 Q.9 How frequently you do internet browsing?
Table 9 : Frequency of internet browsing
Sr.
No. Responses
No. of
Respondents Percentage
1 Daily 68 14%
2 Weekly 10 2%
3 Monthly 3 1%
4 Occasionally 227 46%
5 Not using internet 190 32%
Total 498 100%
Figure 9 : Use of facilities of smart browsing by student-teachers Observation:
68 student-teachers (14%) did internet browsing daily. 10 student-teachers (2%) did internet browsing weekly. 03 student-teachers (1%) did internet browsing monthly. 227 student-teachers (46%) did internet browsing occasionally.
Interpretation:
[image:10.595.109.501.423.553.2] Most of the student teachers did not internet browsing occasionally. Many student-teachers did internet browsing daily.
Figure 10 : Frequency of browsing 14%
2% 1%
46%
32%
0% 10% 20% 30% 40% 50%
SRJIS/BIMONTHLY/SURESH G. ISAVE (1521-1532)
NOV-DEC, 2015, VOL-3/21 www.srjis.com Page 1531 Q.10 Which difficulties you face in the use of browsing facilities, please give
[image:11.595.103.537.143.498.2]details.
Table 10: Difficulties in the use of browsing
Sr.
No. Major categories Associate concepts Interpretation
1 Difficulties related to hardware
- Outdated machines. Processors speed
-Most of student teachers said due to the inadequate hardware some of
the facilities cannot be use. E.g. video search.
2 Difficulties related to software
- Lack of updates operating system.
- Older version of browser - Compatibility of browser.
-Student teachers faced difficulty to open some program due to lack of
plug in, in proper version, some program opens in a specific browser, which also causes not to
open a particular program.
3 Difficulty related to skill
- Unaware of all features of smart search. - Learning by trial and error
Student-teachers not aware about the facilities. So they learnt to operate features when they had a
need of it. Most of the student teachers were not undergone
training.
4 Difficulties related to data
- Connectivity - Time
Most of the student teachers expressed that they were consumed more time which was expected due
to the less connectivity.
5 Content - Authenticity
- Amount of content
- Most of the student teachers faced the difficulty to get the adequate and proper content from the huge
amount of data.
- It was a difficult job to confirm the authenticity of the content browsed.
10. Findings :
On the basis of data analysis, following findings of the research questions are drawn as follows :
Q1.-What browsing resources are available with student-teachers? Ans.- Most of the student-teachers did do browsing online. Q2.Which browsers are used by the student-teachers?
Ans.- Most of the student-teachers used Google search engine. Q3. What is the purpose of browsing?
Ans.- Most of the student-teachers were not able to make use of various features of smart search.
Q4. How frequently student-teachers browse?
SRJIS/BIMONTHLY/SURESH G. ISAVE (1521-1532)
NOV-DEC, 2015, VOL-3/21 www.srjis.com Page 1532 Q5. What are the difficulties faced by student-teachers in browsing?
Ans.- Most of the student-teachers were faced difficulties in the browsing due to lack of adequate hardware, software and lack of formal training of browsing.
11. Discussion of the findings:
Student-teachers does browsing. So teacher-educators can give assignments where they can be expected to browse. New trends, new methodology, pedagogy etc. can be given student teachers to search. Some modules can be designed where student-teachers can browse. The findings of the present study would also be used to design curriculum of teacher education course and MOOCs. The study may provide ground report of the level of the use of browsing by the student-teachers.
Reference
Best, John W. & Kahn James V. (2006). Research in education. Prentice-Hall of
India Pvt. Ltd., New Delhi.
Oberoi, Pawan Kumar. (2013).Research methodology. Global Academic
Publisher and Distributers. New Delhi.
Nachimuthu, K.; Vijayakumari, G..(2007). Quality Issues and Standards of
E-Content. Journal of Educational Technology, v4 n3 p8-12 Oct-Dec 2007.
UNESCO.(2009). Guide to measuring information and technologies (ICT)
in education. Institute for Statistics, UNESCO.P.O. Box 6128, Succursale