1
Analysis of the e-Government stage model evaluation using SWOT-AHP method
Shareef, M. Shareef
School of Computing, IT and Engineering University of East London, UK
Hamid Jahankhani
School of Computing, IT and Engineering University of East London, UK
Elias Pimenidis
School of Computing, IT and Engineering University of East London, UK
Abstract
Electronic government is no longer optional but essential for states attempting for better services to their citizens. Citizens are the centre of the government system and play a key role in making e-government successful and of course with the e-government's policies. The paper aims to evaluate the proposed stage model based on various criteria that identified by SWOT analysis method. Analytic Hierarchy Process (AHP) method will be merged with SWOT analysis method in order to identify the probability of the elements of the proposed model for implementation.
Keywords: Evaluation, E-government, AHP-SWOT, multi-criteria, e-government stage model.
1. Introduction
The utilisation of e-government continues at a massive cost and pace in the public sector and a vital field of research is the evaluation of the system. E-government is no longer just an option now but a necessity for government administrations aiming for better performance. Owing to the significance of e-government, the importance of evaluating the e-government model cannot be overemphasized. With the rapid development of the e-government it becomes critical to investigate in e-government evaluation criteria. The aim of this paper is to identify appropriate method of evaluation procedure for proposed e-government stage model.
2 argument is that, should we adopt the same objectives or criteria that have been used for developed countries or use different?
Initially, it is important to mention to the needs for initiating e-government system. E-government became inevitability for government authorities and public sectors. The system will provide services to the citizens effectively and efficiently through the use of ICT means. Therefore, it is essential for governmental authorities think on e-government initiative in order to satisfy their community and their welfare life particularly in developing countries to follow the developmental revolution. The e-government is essential for developing countries in order to reduce the complex transaction procedures and, also to reduce the cost thus, avoid any need for bribing to speed-up the processing at their transaction.
In general, e-government is a procedure of performing business between the government and the public through the use of computerized systems and other alternative channels (Shareef et al. 2010a). However, e-government is not only digitizing information and publishing on the web, while improving the quality of public services (shareef et al. 2010b), for doing so, awareness about supply construction and the demand side is crucial.
The author has examined various e-government stage models (Shareef, 2011) in the literature from (2000-2010, see previous chapter) in order to identify deficiencies, failures, and success factors of the models. Nevertheless, these models seem to vary from each other as they are based on different perspectives and use somewhat a variety of metaphors of e-government (Shareef, et. al. 2011; Nour et al. 2008; Siau & Long, 2005). The author also analysed one of the top ten implemented e-government systems in the world that of the UK (Shareef, et. al. 2011) in order to find out the key similarities of the objectives to adopt e-government stage model in the Kurdistan Region of Iraq (KRI).
3 list of key components| elements that would be required to develop a new more appropriate model for this research.
1- Citizen-centric based approach.
2- Potential use of multi-channel delivery of services.
3- Encouragement of citizens in engaging in e-government, following interaction stage. 4- Government should create a transparent competitions environment amongst various
telecommunication companies to provide supreme services to the public.
5- Automation, development, and digitization of back-office of certain institutions at the early stage.
6- Citizens’ awareness campaign, to involve cooperation amongst government entities with civil society institutions, and improve citizens’ knowledge (reduce knowledge divide) of the system.
7- The development of an appropriate legal framework for e-government implementation to establish a coherent system and supported by public to success the system.
8- Create and adopt mechanisms to make citizens aware of how utilize the new system and also develop a strategic road map to encourage stakeholders to utilize e-system.
9- Deploy the IT literacy in education curriculums in educational establishments, and IT skills training for government, citizens, and employees in order to reduce the digital divide.
10-Effective transition between e-government development stages.
11-Discipline and rigor in management process and public administration.
12-Non-intervention from politicians in government administration, particularly in developing countries. With no monopolising companies by politicians.
13-Government should also allocate a reasonable fiscal budget to implement e-government system
14-Training workshops for citizens involved in various stages of the development process voluntarily.
15-Cooperation between government establishments (inter and intra-establishments).
16-Involve academics, local government’s officers and other stakeholders’ view points in the project.
4 18-Publishing a portal with multilingual usage of (local, national and international
languages).
Based on the above key points that have been revealed through comprehensive analysis of various government stage models (Shareef, 2011; Shareef, et.al. 2011), the author proposed an e-government stage model for regional e-government in developing countries. These factors are vital for consideration for initiating an e-government in developing countries, due to various aspects such as; culture attitude, education level, political process, legal framework and, others. The proposed e-government stage model comprises six stages based on citizen-centric approach namely; Initial, Information, Interaction, Enhancement, Transaction, and Integration stage. Then, the proposed model will be evaluated in order to find out the potential and the capability for implementation. Identifying measures of the evaluation procedure is essential to success the process. Therefore, it is important to identify a method to meet the required objectives such as cost-effective establishment, economic development, and accountability to reduce corruption, transparency and equal opportunity of the entire stakeholders.
This paper aims to evaluate the proposed e-government model by integrating SWOT Strength, Opportunities, Weakness, and Threats analyses method and AHP Analytic Hierarchy Process. SWOT method is used as a tool to analyse both supply and demand side to achieve a systematic approach and support for a decision situation. Selecting e-government stage model with SWOT analysis is hard, in which various qualitative facets must be taken into consideration (Kahraman, et. al. 2008). These types of facets are almost unclear and linguistic instead of being precise value. Therefore, it is crucial to use AHP to describe these types of complexity in evaluation processes. Analytic Hierarchy Process (AHP) method will be applied in order to evaluate SWOT factors systematically and commensurate their intensities which has also the ability of taking these factors into consideration in a hierarchical structure.
2. Method for the evaluation of e-government model
5 evaluation methodology as a method that can help system developers in evaluating the utility and usability of their systems. The key elements of the evaluation plan are data, users, tasks and metrics (Morse, 2002).
In addition, the main objectives of information management systems or any other complicated application is to run the system, incorporating new attribute and, assigning resources to obtain system aims in timely manner. The availability of these resources should make the process of evaluating systems more accurate. Some scholars identified evaluation criteria as follow (Kokkinaki, et al. 2005).
1- A reliable design 2- Easy and secure access
3- Trustworthy and correct content that is regularly updated 4- Emphasis on requirements and needs of potential users, and 5- Usability
3. Evaluation methodology
Generally, the real world is complex, various factors might involve to an issue and there might be diverse view points to consider for tackling it. This implies it’s frequently hard to understand the actual problem or find out the origin cause. Through all these hassles and confusions frequently surrounding problems, identifying suitable solution might sometimes look almost unfeasible. Therefore, it is essential to find out a suitable and accurate method to employ it, in order to evaluate the system in an accurate manner. In regards to government system the evaluation of government stage models has been relatively less investigated. Most studies on evaluating e-government systems have focused mainly on the individual elements or components within a model such as; planning, strategies, service provision, ICT projects, with little or no in depth evaluation of e-government stage model as a whole. In addition, this domain has not been investigated sufficiently from the view point of system acceptance.
6 international level. However, the author thinks that evaluating a system in some cases prior to implementation is important, otherwise will be waste of budget if evaluated after implementation. Increasingly, contributors investing in e-government projects are persevering that the funded projects use qualitative and quantitative method to measure the results and influence of projects. However, Key Performance Indicator (KPI) is a method used for measuring a progress accomplishment of a partial or final objective, also used to measure progress and returns of a project. However, benchmarking is a process in which institutions assess and evaluate some facets of their functions in regards to best practices or the best achievement in the same sector. It also permits institutions to build up their plans on how to apply such best practices if not enhance their performance in regards to the best in the field.
Strength, Weakness, Opportunities and, Threats (SWOT) analysis method has been widely used as a tool for planning and analysing strategic actions over the past decade. This method can also be used in identifying environmental relationships and enable an institution to relate to its environment and help to grow business strategies. SWOT analysis originally explained by Learned et al. (1969) as a key tool for tackling complex strategic issues by decreasing the quantity of information to enhance decision making. However, Wheelan and Huger (1998) applied SWOT to determine gaps and matches between resources and the business situations in their popular business policy and strategy. Glaister & Flashaw (1999) initiated that SWOT analysis is one of the best method used in strategic planning in the UK companies. Furthermore, the SWOT analysis method can also be used to evaluate the proposed framework against best practice frameworks in developing countries (Backus, 2001; Kahraman, et al. 2007; Mousavi, et al. 2010).
Kahraman, et al. (2007) applied SWOT analysis method for implementing e-government action plan in Turkey. Moreover, this analysis method has also been used by practitioners and marketing business in which counted as popular method for strategic issues and business marketing to assess alternative and complex decision issues. This method also used by individuals as such, Ames, & Runco, (2005) which employed a SWOT analysis to see why certain contractors were successful. The method has been used by organizations in order to compare two firms or evaluating various companies.
7 SWOT analysis method to analyse the strategies and mission of two non-profit organizations in the United States. Hai (2008) used SWOT analysis method to obtain the best strategy alternatives for the Taiwanese Small and Medium Enterprises. Helms & Judy (2010) reviewed a number of literatures in the last decade of SWOT usage and classified the levels and types of applications. According to Helms and Judy (2010) table 1 illustrates numbers of academic researches on SWOT usage for planning strategic issues which covers management, product development, marketing, business, student decision-making and others.
year 1999 2000 2001 2002 2003 2004 2005 2005 2007 2008 2009 Total No of
studies
5 10 4 8 8 13 18 12 29 22 12 141
Table 1 Reference journal articles referencing SWOT analysis (source, Helms & Judy, 2010)
Some of the researchers argue that SWOT analysis method is oversimplified (Kay, 1993, 1999). Therefore, the managers and decision makers make a mistake in using this method because of simplicity (Haberberg, 2000). However, (Baker, 2000; Piercy and Giles 1989) proponents of the simplicity of the method and Baker, (2000) stated that the institutions can use the method efficiently and evaluate the issues based on consumer’s perception.
Soft Systems Methodology (SSM) is a method that is used to evaluate systems and solves the real life issues. For example, Winklhofer (2002) used SSM to illustrate a real world case study for information analysis in order to evaluate information system throughout the organizational change. There are other methods have been broadly used to evaluate systems or projects such as ELECTRE which is stand for (Elimination and Choice Expressing Reality) is a widely known evaluation method that can be used to assist decision-making activities which add in both qualitative and quantitative criteria (Wang and Triantaphyllou 2006; Huang & Chen 2005). The Technique for Order Preference by Similarity to Ideal Situation (TOPSIS) method has been developed by Huang and Yoon (1981) as an alternative to (ELECTRE) for order preference by similarity to ideal solutions.
8 planning. Pohekar, & Ramachandran, (2004) reviewed and analysed more than 90 published papers in order to address and find out the best method for system evaluation. They revealed that AHP followed by outranking methods PROMETHEE and ELECTRE is the best method. Zeleny (1982) used Compromise Programming (CP) method for evaluation and Keeny & Raiffa (1976) also used Multi-attribute utility theory (MAUT).
Furthermore, Multi-objective optimization method is a broadly used method in energy planning, energy resource allocation and, electric utility applications (Lootsma et al. 1990). Decision Support System (DSS) is a system that support computer based techniques for assisting the decisions (Turban, 1995). Multi-criteria decision making (MCDM) method also an approach to produce a compromise solution. It is a compromise in that the decision maker has traded-off the weights of the alternatives according to the decision maker’s understanding of the issue atmosphere, experience, and even biases. These are handled by the AHP via the answers to the pair-wise comparison questions. Other decision makers with their own weights might choose another solution (Bodin & Gass, 2003).
Vahidniaa, et al. (2008) applied fuzzy AHP analysis and α-cut- based method to make decision
tools especially in the issues with spatial nature or GIS-based. Ayag, (2005) combined a fuzzy set theory with AHP method to evaluate a new product development process. Moreover, there is also Expert Choice software that can be used to evaluate the systems and assist managers and decision makers to select best choice based on their criteria. There is a large literature dedicated to the use of AHP, which is one of the best methods has been widely used since 32 years ago to tackle a wide range of multi-criteria decision issues (Bodin & Gass, 2003). This method has been used by many researchers, decision makers to resolve decision-making issues in project selection (Dey & Gupta, 2001). In the next section the AHP will be discussed in detail.
3.1 The fundamental concept of the Analytic Hierarchy Process (AHP)
9 developing the AHP prior the decision to utilise 1-9 scales (Saaty 1980). Eventually, Saaty deduced that 1-9 scale work perfectly in its ability to cover both qualitative and quantitative information as needed by the pair-wise comparison form of the AHP.
The AHP assists the decision maker to handle the critical aspects of an issue into a hierarchical structure similar to a family tree. This method is not only assists the decision makers to find out the best decision, but also presents a clear justification for the choices made. AHP is applied to find out the weights of the criteria and determine the final solution weights of the choice with respect to the criteria. The main purpose of employing an AHP is to recognize the best alternative and also determine a ranking of the alternatives when all the decision criteria are considered at the same time (Saaty, 1980).
One of the main advantages of this method is the ease of use in which it deals with multiple criteria. In spite this method is easier to understand and it can effectively capture both qualitative and quantitative data. AHP is considered due to it consists in a systematic approach based on breaking the decision issues into a hierarchy of inter connected elements (Ayag, 2005). Since this method has been explored, the number and diversity of applications have been employed this method and developed very fast specifically in the information systems field. Number of Universities program includes AHP courses to teach their students and to know how to make best decision based on multi-criteria in their job activities particularly in business world (Bodin & Gass 2003).
Literature also demonstrates that AHP is the best method used to evaluate the system in which selects the best one amongst the complex criteria structure in various level. This method is used for ranking decision alternatives and choosing the best alternatives that meets his/her requirements criteria (Taylor, 2004) by evolving a numerical score to position each decision alternatives according on how well fit each alternative. Shahrabi, et al. (2007) stated that the use of AHP as a substitute of another multi-criteria technique because of the following basis:
1- Decision making involve both quantitative and qualitative criteria 2. A great number of criteria can be considered
3. A flexible hierarchy can be constructed based on the problem.
10
3.2 The calculation technique of AHP
[image:10.595.111.455.220.371.2]The first step in the AHP procedure is the decomposition of a complex issue into a structure (hierarchy) with the aim criteria (Boroushaki & Malczewski, 2008) at the top of the structure. The criteria and sub-criteria allocated at levels and sub-levels of the structure, and decision alternatives or comparisons at the bottom of the structure, as depicted in figure 1.
Figure 1 AHP structure (Hierarchy) of decision issue
3.2-1 Pair-wise comparison
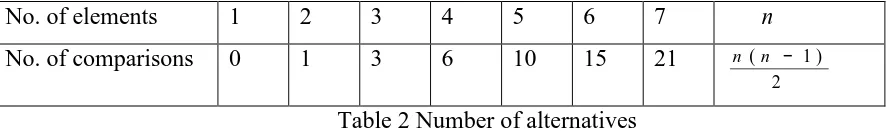
Pair-wise comparison can be explains as the procedure of comparing units in pairs to find out which one is selected. In other words, for each unit or entity of the hierarchy the entire entities which are associated in the low hierarchy are compared in pair-wise. We can observe from figure 1 that the number of comparisons or alternatives is a combination of the number of entities or elements based on that, the number of comparisons in figure 1 is three which is shown in table 2.
No. of elements 1 2 3 4 5 6 7 n
No. of comparisons 0 1 3 6 10 15 21
2 ) 1 (n − n
Table 2 Number of alternatives
The main aim of calculation technique is to make a reciprocal matrix comparison expressing the relative values of a set of attributes. The comparisons are used to structure a matrix of pair-wise comparisons called the judgement matrix or square matrix M (Coyle, 2004). For instance, let considernelements to be compared D1,D2,...Dn are indicated to the relative or priority weight
Criteria or attributes level
[image:10.595.54.499.577.643.2]11 of D with respect to i Djby aijand form a square matrixM =(aij) of order n with the constraints
thataij =1/aij, fori≠ j, andaii =1, all i , such a matrix is said to be a reciprocal matrix. In other
words if aijis the element of row i column j , the lower diagonal is filled by employing this formula be aji =1/aij the weight of n elements. For instance if aij =3 it implies that i is moderately important than j or i 3 times important than j This is called crisp evaluation (Ramik & Korviny, 2010). The structure of the matrix illustrated as follows:
……….… (1)
Where M = comparison pair-wise reciprocal matrix,
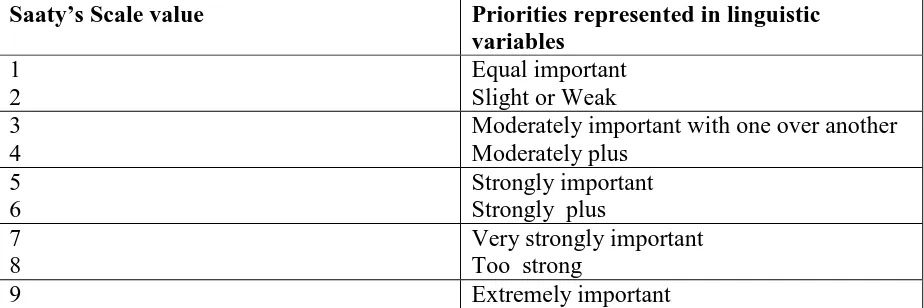
To find out the relative selection fornelements of the hierarchy matrix, the Saaty’s fundamental scale of value from 1-9 is used to consider the intensity priority between two elements and, using the verbal scale associated with the 1–9 scale as shown in table 3.
Saaty’s Scale value Priorities represented in linguistic
variables
1 2
Equal important Slight or Weak 3
4
Moderately important with one over another Moderately plus
5 6
Strongly important Strongly plus 7
8
Very strongly important Too strong
[image:11.595.52.514.433.587.2]9 Extremely important
Table 3 Saaty’s scales for pair-wise comparison (Saaty, 2008)
The linguistic variables and ratio scale values are used for weighting tangible and intangible elements. The values of 2, 4, 6, and 8 are selected to specify compromise values of importance. To calculate relative weights of elements in each pair-wise comparison matrix, the Eigen value method can be employed. To compute Eigen vector or priority vector i.e. if we have a matrix three by three. We totalise each column of the matrix, then we divide each element of the matrix with the total of its column, then we have to normalise relative weight.
D1 D2 ……… Dn D1
1
a
12 ………a
1nD2
1 a
/
12 1 ……….…a
2n12 To normalise Eigen vector, row elements will be summed then divided by number of elements in the same row, in other words taking the average value. The Eigen vector demonstrates relative weights amongst the objects that we compare. In this comparison method some inconsistencies may accrue and is usual. For instance when M contains inconsistencies, the estimated priorities can be achieved by employing the M matrix as the input. The relative weights( A of matrix M are ) obtained from the following equation:
0 )
(M −
λ
maxI q= ……… (2)Where M is the reciprocal matrix? max
λ
is the biggest Eagan value of matrix,q is its correct Eigen value, and I is the unit matrix of sizen.
The Eigen value (
λ
max) can be obtained by summing of products between each element of Eigen vector multiplied by the total of columns of the reciprocal matrix. Every Eigen value is scaled to total up to one to get the priorities. In other words the sum of all elements in Eigen value (priority value) is one. Inconsistency may occur whenλ
max moved away from nthis is because of the inconsistency responses in pair-wise comparisons. Saaty (1977) proved that the biggest Eigen value is equal to the number of comparisons(λ
max =n). Therefore, the matrix M should be examined for consistency by using consistency index CI as illustrated in equation 3.) 1 (
) ( max
− − =
n n
CI
λ
………. (3)One of the critical steps of AHP method is to create the comparison matrixes. However, when the number of alternatives increases, more comparisons between alternatives required. This might easily cause the excess of the consistency of the model. Therefore, a consistency check is required for the pair-wise comparison matrix (Saaty, 1992).
The consistency index is used in order to check whether the judgment of decision makers is consistent with respect to a comparison matrix. In other words, this index is important for the decision maker to assure him that his/her judgments were consistent and that the final decision is made well. While CI depends onn, then should calculate consistency ratio CR as shown in equation 4:
RI CI
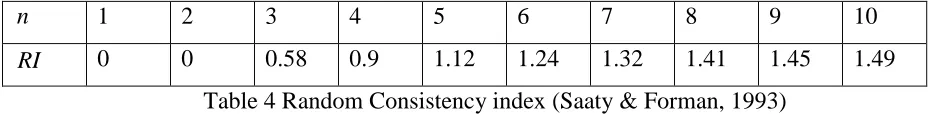
13 Saaty proposed that CI used to compare with the appropriate consistency index which is called Random consistency index(RI . In other words, he randomly generated reciprocal matrix in order ) to find random consistency index to observe if it is about 0.1 or 10% or less. The random CI is illustrated in table 4.
n 1 2 3 4 5 6 7 8 9 10
[image:13.595.50.519.163.220.2]RI 0 0 0.58 0.9 1.12 1.24 1.32 1.41 1.45 1.49
Table 4 Random Consistency index (Saaty & Forman, 1993)
The matrix will be consistence and acceptable if consistency ration is less than 0.1 or(CR≤0.1), if not we have to revise the subjective judgement.
In order to obtain the overall rating for the alternatives as depicted in equation 5: (Vahindina, et al. 2008).
∑
==
j k ej s ij s
i
a
a
A
, i =1,..., n ………. (5)Where A = total weight of site i , is s
ij
a = weight of alternative (site) i associated to criterion map j ,
e j
a = weight of criteria j , k = number of criteria, i = number of alternative
4. SWOT-AHP analysis methods for evaluation
14 Using AHP method will offer a quantitative measure of significance of each factor on decision making (Kurttila et al. 2001). The structure of conducting these integration methods is addressed in the four steps below (Wickramasinghe, and Takano, 2009):
4.1 Step 1: SWOT analysis is conducted:
The summary of the proposed e-government stage model is shown in figure 3 and more details can be found in (Shareef, 2011). In this section the SWOT analysis method of the provider and demand side of the proposed e-government stage model will be addressed of the sake of the evaluation procedure. This method includes systematic thoughts and inclusive identification of factors relating to a new technology, management or planning and products (Kahraman, et. al. 2008).
Figure 3 E-government stage model
Figure 3 illustrates SWOT analysis which identifies the factors of Strengths, Weaknesses, Opportunities and Threats of the proposed e-government stage model.
Functions /Technology
Strategic plan Techno. Infrastructure Security& financial
Strategic road map, improve the quality of the internet, technological preparation Information publication on the web in sufficient manner
One-way communication, information availability 24/7 bases, G2C, G2B, G2E Public awareness campaign, e-mail, leaflet, TV, seminars
Two-way-communication, Citizen’engagement &participation
E-public, e-participation, vertical & horizontal
15
Strengths
What strengths be able to achieve objectives
Opportunities
What opportunities be able to employ 1-S1: Citizen-centric based approach in terms
of participation (Stage 2-6)
2-S2: Front/back office automation for certain
institutions at the early stage (stage 3).
3-S3: Efficient management procedures (Stage 1-6).
4-S4: Public awareness campaign to aspiration of enabling and encouraging citizen to
participate (stage 4)
5-S5: Usability of multi-channel to delivery of services (stage3).
6-S6: Availability of main portal with sub-portals and, with multi-lingual (stage 2)
1- O1: ICT infrastructure and enhance quality of internet (stage1).
1- O2: Cost effectiveness in distributing information and collaboration amongst various government institutions (stage 2-6).
3- O3: The development of an appropriate legal framework for e-government implementation (stage1&2).
4-O4: Participation of academics and private company in developing of software applications (stage1-6).
5- O5: Role of IT academy in training public and deploy the IT literacy in educational institutions (stage 4).
6-O6: Funding support by external (international) institutions (stage 1-4).
Weaknesses
What weaknesses required to deal with it
Threats
What threats required to be aware of 1- W1: Lack of support from top levels of
administrational authorities.
2-W2: Lack of IT skills among stakeholders 3-W3: Lack of collaboration amongst institutions.
4- W4: Disparity between planned
government’s authority and public’s demands. 5-W5: Extensive procedure which necessitates various iterations.
1- T1: Intervention from politicians in government administrations, and monopolising companies by politicians.
2- T2: Call for change individual's attitudes and social cultures.
3-T3: Division between government and citizens. 4-T4: Decentralised internet governance.
5-T5: Securing personal information privacy and their confidentiality.
Figure 3 SWOT analysis methods for proposed e-government model
4.2 Step2. AHP method is combined with SWOT analysis:
[image:15.595.55.513.47.514.2]16 Figure 4 Hierarchical structure of SWOT combined with AHP of e-government stage model
It is useful to consider many factors; the number of pair-wise comparisons in AHP rises exponentially with the number of factors. Hence, the current process leaded four factors of strengths, four weaknesses, eight opportunities, and five threats, but in this case only four factors of each SWOT group will be used from figure 3. It is essential to note that according to (Saaty, 1986) the number of factors in the analysis categories should not exceed 10 factors under each SWOT group and this is the main shortage of the AHP. However, this made the user to avoid overlapping and carelessness when building the SWOT matrix.
In level one there will be one comparison matrix communicates to pair-wise comparisons between significant objectives with respect to aim of the evaluation (Boroushaki & Malczewski, 2008). The comparison matrix of the first has the size of 3 by 3, to identify the most significant objective, and use its values as a scaling factor. The next level pair wise comparisons between SWOT factors are
A
Aim (A): evaluation of the proposed e-government modelSO1: Cost-effective establishment. SO2: Transparency and accountability to reduce corruption and provide equal opportunity of the entire stakeholders. SO3: Economic development.
Significant Objectives (SO)
SO1 SO2 SO3
Strengths S
Weaknesses W
Opportunities O
Threats T
S2 S1
S3
S4
W1
W2
W3
W4
O1
O2
O3
O7 O6 O5 O4
T5 T4 T3 T2 T1
S
W
O
T
f
ac
to
17 performed within each individual SWOT group with respect to the objectives, and identifies scaling factors for the next level. Making the comparisons based on the Saaty’s scale to consider the intensity priority between two elements and, using the verbal scale associated with the 1–9 scale as illustrated in table 3. In addition, it has the ability to cover both qualitative and quantitative information as required by the pair-wise comparison form of the AHP. With these comparisons as the input, the local priorities of the factors are computed by Eigen value method as explained in section (3.2). These priorities imitate the decision makers’ view point of the relevant importance of the factors. The next level’s pair wise comparisons conducted to select the highest value factor within the group. Consequently, the comparison matrix of the first and second levels comprises on the sizes of 3 by 3 and 4 by 4 respectively.
Regarding the first level, the pair wise comparison consists of a matrix with size of 3 by 3, and then calculates the factors by dividing each element of row by the sum of each column of the objectives. Then, normalises the Eigen vectors by averaging the value of the factors across the new rows, in other words adds each new row and divided by number of factors which is three in this case. Pair-wise comparison matrix for objectives with respect to the aim is depicted in table 5.
Criteria/Factors SO1 SO2 SO3
SO1 1 35 3
SO2 1/5 1 1/7
SO3 1/3 7 1
Total 1.53 13 4.14
Table 5 pair wise comparison of the three objectives criteria
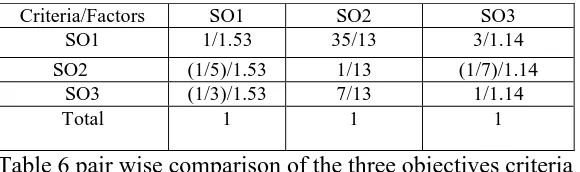
Calculate the factors by dividing each row by the sum of each column of the objectives.
Criteria/Factors SO1 SO2 SO3
SO1 1/1.53 35/13 3/1.14
SO2 (1/5)/1.53 1/13 (1/7)/1.14
SO3 (1/3)/1.53 7/13 1/1.14
[image:17.595.155.445.495.581.2]Total 1 1 1
Table 6 pair wise comparison of the three objectives criteria
18
Criteria/Factors SO1 SO2 SO3 Scaling factor
SO1 1 5 3 0.587615946
SO2 1/5 1 1/7 0.080486152
SO3 1/3 7 1 0.331897902
[image:18.595.117.484.58.131.2]Total 1.53 13 4.14 1
Table 7 pair wise comparison of the three objectives criteria
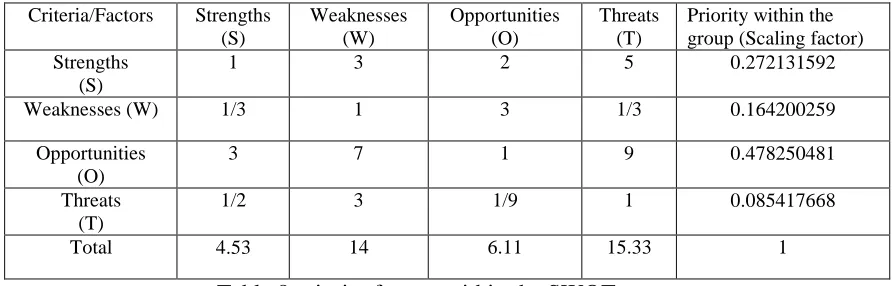
Likewise, the same procedure will be followed for second level which is SWOT factors comparisons of the SWOT group, which is illustrated table 8.
Criteria/Factors Strengths (S)
Weaknesses (W)
Opportunities (O)
Threats (T)
Priority within the group (Scaling factor) Strengths
(S)
1 3 2 5 0.272131592
Weaknesses (W) 1/3 1 3 1/3 0.164200259
Opportunities (O)
3 7 1 9 0.478250481
Threats (T)
1/2 3 1/9 1 0.085417668
[image:18.595.74.520.233.376.2]Total 4.53 14 6.11 15.33 1
Table 8 priority factors within the SWOT group
4.3 Step 3 Pair-wise comparisons conducted with respect to three objectives and four SWOT groups.
The three objectives (SO1, SO2, and SO3) were subjected to pair wise comparison at the second level will be calculated. The SWOT group (strengths, weaknesses, opportunities, and threats) were rated using objectives criteria with respect to five intensity ratings which is shown in table 3, equal important, moderately important, strongly important, very strongly important and extremely important. We calculate the SWOT factors with respect to each objective. Figures 9, 10, and 11 shows the calculation of SWOT factors with respect to all three significant objectives.
Criteria/Factors S W O T Local weight
S 1 3 5 7 0.272131592
W 1/3 1 1/5 1/3 0.164200259
O 1/5 5 1 7 0.478250481
T 1/7 1/5 1/7 1 0.085417668
Total 1.67 9.2 6.34 15.33 1
[image:18.595.77.520.592.716.2]19 Figure 10 shows the calculation of SWOT factors with respect to second significant objective (SO2).
Criteria/Factors S W O T Local weight
S 1 1/3 1/5 5 0.308239
W 3 1 7 5 0.477408
O 5 1/7 1 5 0.133049
T 1/5 1/5 1/5 1 0.081304
Total 9.2 1.67 8.4 16 1
[image:19.595.74.522.277.411.2]Table 10 pair wise comparison of the SWOT group with respect to SO2
Figure 11 shows the calculation of SWOT factors with respect to third significant objective (SO3).
Criteria/Factors S W O T Local weight
S 1 5 9 3 0.308239
W 1/5 1 3/3 3 0.477408
O 1/9 3 1 3 0.133049
T 1/3 1/3 1/3 1 0.081304
[image:19.595.69.525.277.412.2]Total 1.64 9.33 10.66 10 1
Table 11 pair wise comparison of the SWOT group with respect to SO3
Similarly, level three of the hierarchical structure of evaluation process will be achieved. The pair wise comparisons of factors within the four SWOT groups are conducted as shown in tables 12, 13, 14, and 15.
Criteria/Factors S1 S2 S3 S4 Local weight
S1 1 3 2 5 0.558
S2 1/3 1 3 1/3 0.2630
S3 3 7 1 9 0.1218
S4 ½ 3 1/9 1 0.0564
[image:19.595.66.522.487.621.2]Total 4.53 14 6.11 15.33 1
Table 12 priority factor or local weight of the strengths in SWOT group
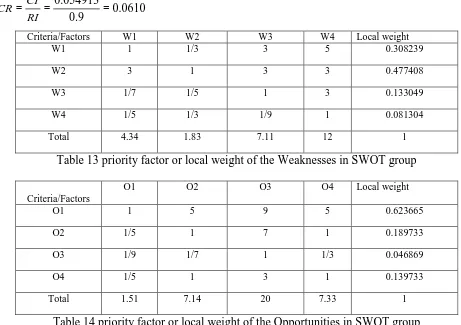
Next, we calculate local weight or priority factor for all of the weaknesses, opportunities and threats, similar to the first level as shown in table 13, 14, and 15. In addition, to obtain consistency index and consistency ratio, equation 3 and 4 will be used as shown below:
max
λ
=(0.558)( 4.53)+( 0.2630)( 14)+( 0.1218)( 6.11)+( 0.0564)( 15.33)max
20 054913 . 0 3 4 -4.164 ) 1 ( ) ( max = = − − = n n CI
λ
According to table 4, random consistency index (RI is 0.9 )
0610 . 0 9 . 0 054913 . 0 = = = RI CI CR
Criteria/Factors W1 W2 W3 W4 Local weight
W1 1 1/3 3 5 0.308239
W2 3 1 3 3 0.477408
W3 1/7 1/5 1 3 0.133049
W4 1/5 1/3 1/9 1 0.081304
Total 4.34 1.83 7.11 12 1
Table 13 priority factor or local weight of the Weaknesses in SWOT group
Criteria/Factors
O1 O2 O3 O4 Local weight
O1 1 5 9 5 0.623665
O2 1/5 1 7 1 0.189733
O3 1/9 1/7 1 1/3 0.046869
O4 1/5 1 3 1 0.139733
[image:20.595.61.522.132.457.2]Total 1.51 7.14 20 7.33 1
Table 14 priority factor or local weight of the Opportunities in SWOT group
Criteria/Factors T1 T2 T3 T4 Local weight
T1 1 3 5 5 0.543596
T2 1/3 1 3 3 0.244222
T3 1/5 1/3 1 1/3 0.076281
T4 1/5 1/3 3 1 0.135901
[image:20.595.76.521.487.622.2]Total 1.73 4.66 12 9.33 1
Table 15 priority factor or local weight of the Threats in SWOT group
21 value of the corresponding scaling factor of the SWOT group. The sum of all global priorities becomes one, which will be explained more in depth in the next section.
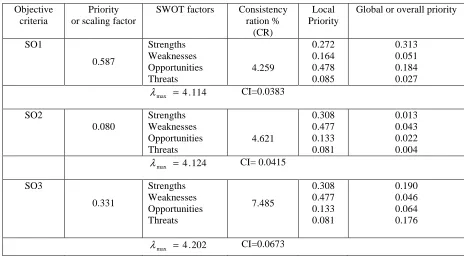
4.4 Step 4. The results are employed in the evaluation process.
In this step the aim to the evaluation of the proposed model process comes in the numerical values for the factors. New aims may be set, priorities defined and such implementations planned as take into account the primary factors. These calculations have been carried out using Excel program and also can be done by “Expert Choice software”.
In this step the overall or global priorities of objectives and SWOT groups will be performed by multiplying the local priority by the value of the corresponding scaling factor of the SWOT group. Also the calculation will be the same as the above for all of the other factors such as strengths weaknesses, opportunities and threats with their consistency index and consistency ratio.
Objective criteria
Priority or scaling factor
SWOT factors Consistency ration %
(CR)
Local Priority
Global or overall priority
SO1 0.587 Strengths Weaknesses Opportunities Threats 4.259 0.272 0.164 0.478 0.085 0.313 0.051 0.184 0.027 114 . 4 max = λ CI=0.0383 SO2 0.080 Strengths Weaknesses Opportunities Threats 4.621 0.308 0.477 0.133 0.081 0.013 0.043 0.022 0.004 124 . 4 max =
λ CI= 0.0415
[image:21.595.64.528.302.558.2]SO3 0.331 Strengths Weaknesses Opportunities Threats 7.485 0.308 0.477 0.133 0.081 0.190 0.046 0.064 0.176 202 . 4 max = λ CI=0.0673
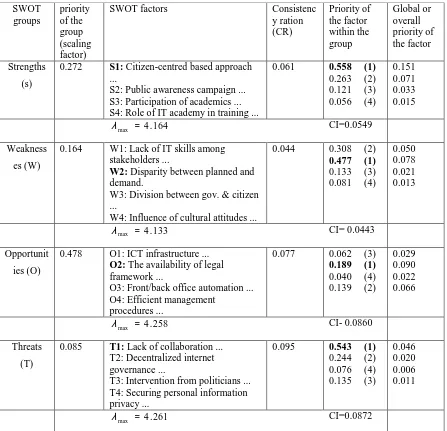
22 SWOT groups priority of the group (scaling factor)
SWOT factors Consistenc
y ration (CR) Priority of the factor within the group Global or overall priority of the factor Strengths (s)
0.272 S1: Citizen-centred based approach ...
S2: Public awareness campaign ... S3: Participation of academics ... S4: Role of IT academy in training ...
0.061 0.558 (1) 0.263 (2) 0.121 (3) 0.056 (4)
0.151 0.071 0.033 0.015 164 . 4 max = λ CI=0.0549 Weakness es (W)
0.164 W1: Lack of IT skills among stakeholders ...
W2: Disparity between planned and demand.
W3: Division between gov. & citizen ... W4: Influence of cultural attitudes ...
0.044 0.308 (2) 0.477 (1) 0.133 (3) 0.081 (4)
0.050 0.078 0.021 0.013 133 . 4 max =
λ CI= 0.0443
Opportunit
ies (O)
0.478 O1: ICT infrastructure ... O2: The availability of legal framework ...
O3: Front/back office automation ... O4: Efficient management
procedures ...
0.077 0.062 (3) 0.189 (1) 0.040 (4) 0.139 (2)
0.029 0.090 0.022 0.066 258 . 4 max =
λ CI- 0.0860
Threats
(T)
0.085 T1: Lack of collaboration ... T2: Decentralized internet governance ...
T3: Intervention from politicians ... T4: Securing personal information privacy ...
0.095 0.543 (1) 0.244 (2) 0.076 (4) 0.135 (3)
[image:22.595.52.499.54.485.2]0.046 0.020 0.006 0.011 261 . 4 max = λ CI=0.0872
Table 17 the priority weights of the categorised factors within their global priority values of SWOT factors
5. Discussion
23 model. Numerical results, the priorities of SWOT criteria are of use when formulating or choosing model. It is important to compare the demand and supply side and their possible relationship, due to all factors are at the same, on the numerical scale.
[image:23.595.156.445.365.543.2]From figure (5a and 5b) it can be seen that the values of both strength and opportunity factors are higher than both weaknesses and threats in which their data are shown in table16. It can also be seen that strengths are the most important factors of the e-government stage model with respect to both (SO1&SO3) cost-effective establishment and economic development. That leads to the fact that the importance of both demand and supply side in the initiation of e-government. It can also be seen that opportunity factors to be able to be used, are important of the proposed e-government stage model with respect to the entire objectives (SO1, SO2, and SO3). On the other hand, the weakness and threat factors are low with respect to the first and second significant objectives (SO1 and SO2). The threat factors that required be aware of, are also low in comparison to the opportunity and strengths factors. Hence, the overall result shows the feasibility of the proposed stage model for implementation.
24 Figure 5b interpretation of the output of paire wise comparison of SWOT factors with respect to the
objectives.
Figure 6 the overall score of SWOT groups and its factors
From figure 6 it can be seen the overall score of the SWOT factors, in which shows that strengths factors has the highest score (0.604) amongst SWOT factors and then opportunities factors (0.207) with less score of weaknesses and threats in comparison to strengths and opportunities.
Howevere, in figure 7 can be seen that the high value of the strengths and opportunities factors are predominate and also shows that there are no particular threats or weaknesses that could influence the failuer of e-government stage model for implementation in comparison to strengths and opportunities.
[image:24.595.158.441.288.464.2]25 Figure 7 interpretations of the pair wise comparisons of SWOT groups and its factors
This research revealed that the results of the integration of both SWOT and AHP decision support were promising for implementation. Forming pair wise comparisons empowers the decision maker to think over the weights of the criterion or factors and to analyse the circumstances more accurately and in more concentration.
6. Conclusion
Electronic government is no longer optional but essential for states attempting for better services to their citizens. Citizens are the centre of the government system and play a key role in making e-government successful and of course with the e-government's policies. This paper applied the SWOT analysis method to identify the priority factors (strengths and opportunities) and to concentrate on the most important factors of e-government. The SWOT group incorporated various factors, some of these factors are tangible and others are intangible. Thus, the satisfaction levels would be very difficult to measure. Therefore, AHP method has been used to provide a quantitative measure of significance of each factor on decision making.
26 This evaluation offers guidelines for practitioners and policy makers alike also suggested paths for further research. The key findings presented in this paper have implications for other regional governments in developing countries. The combination of SWOT-AHP has not been yet used in evaluating e-government stage model in the literature; which is the promising contribution to this research.
The author believes that a similar evaluation process can be applied on the other e-government models where the benefits or model acceptance dimensions are a mix of tangibles and intangibles and where judgment is difficult if not impossible. The SWOT-AHP method can be changed by using other different methods such as Fuzzy AHP-SWOT, SWOT-TOPSIS, SWOT-ELECTRE, or SWOT-Scoring and others.
References
Al Hujran, O., and Shahateet, M. (2010) ‘Citizen Adoption of eGovernment Initiatives in
Developing Countries: A Case Study of Jordan’. the 10th European Conference on e-Government, 17-18 June 2010, Limerick-Ireland.
Al-Omari, H. (2006) ‘E-Government Architecture In Jordan: A Comparative Analysis’, Journal of Computer Science, Vol. 2, Issue 11, pp 845-852.
Ames, M., and Runco, A. M. (2005) ‘Predicting Entrepreneurship from Ideation and Divergent Thinking’, Creativity and Innovation Management, Vol. 14, Issue 3, pp 311–315.
Ayag, Z. (2005) ‘A fuzzy AHP-based simulation approach to concept evaluation in a NPD environment’, IIE Transactions, Vol.37, Issue 9, pp 827 – 842.
Backus, M. (2001) ‘E-governance and developing Countries: Introduction an examples’, research report, available at: http://www.ftpiicd.org/files/research/reports/re port3.pdf, Accessed on
16/08/2010.
Baker, M. J. (2000) ‘Marketing Strategy and Management’, 3rd edition, New York: Plagrave.
Baum, C., and A., Di Maio (2001) ‘Research Note: Gartner’s Four Phases of E-Government Model’,Tutorials, TU-12-6113, Nov. 21, Available
at:www.aln.hha.dk/IFI/Hdi/2001/ITstrat/Download/Gartner_eGovernment.pdf, Accessed on 03/06/2009.
Bodin, L., and Gass, I. S. (2003) ‘On teaching the analytic hierarchy process’, Computers & Operations Research, Vol. 30, pp 1487-1497.
27 Brans, J.P., Vincke, P.h., and Mareschal, B. (1986) ‘How to select and how to rank projects: the PROMETHEE method’, European Journal of Operations Research, Vol. 24, pp 228–38.
Ciborra, C. & Navarra, D. (2005) ‘Good Governance, Development Theory, and Aid Policy: Risks and Challenges of EGovernment in Jordan’, Information Technology for Development, Vol 11, No. 2, pp 141-159.
Coyle, G. (2004) ‘The Analytic Hierarchy Process (AHP)’, New York: Pearson Education.
Dey, P. K., and Gupta, S. S. (2001) ‘Feasibility analysis of cross country pipeline projects: A quantitative approach’, Project Management Journal, Vol.32, Issue 4, pp 50–58.
Glaister, K. W., and Flashaw, J, R. (1999) ‘Strategic Planning still going strong’, Long Range Planning, Vol. 32, No 1, pp 107-116.
Haberberg, (2000) ‘Swatting SWOT, Strategy, Planning society’, Available at: http://www2.wmin.ac.uk/haberba/SwatSWOT.htm, Accessed on: 10/09/2010
Hai, H. L. (2008) ‘Assessing the SMEs’ Competitive Strategies On The Impact Of Environmental Factors: A Quantitative SWOT Analysis Application’, WSEAS Transactions on Information Science and Applications, Volume 5, Issue 12, pp 1701-1710.
Higginbottom, M. J., and Hurst, K. (2001) ‘Quality assuring a therapy service’, International Journal of Health Care Quality Assurance’, Vol. 14 Issue: 4, pp.149 – 156.
Helms, M. M., and Judy, N. (2010) ‘Exploring SWOT analysis – where are we now? A review of academic research from the last decade’, Journal of Strategy and Management, Vol. 3 Iss: 3, pp.215 – 251.
Huang, C. W., and Chen, H. C. (2005) ‘using the ELECTRE ii method to apply and analyze the differentiation theory’, Proceedings of the Eastern Asia Society for Transportation Studies, Vol. 5, pp, 2237-2249.
Huang, C.L., Yoon, K., (1981) ‘Multi attribute decision making: methods and applications’, New York: Springer-Verlag.,
Information Development (InfoDev), (2008) ‘The Introduction to E-Government’, Chapter 10: Monitoring and Evaluation, available at: http://egov.infodev.org/en/Section.110.html, accessed on 08/09/2010.
Kahraman, C., Demirel, N. C., and Demirel, T. (2008) A SWOT-AHP application using Fuzzy concept: E-government in Turkey, [Book chapter], Springer Science plus Business media, LLC. In, Weirhrch,H. (1982) The SWOT matrix-a tool for situation analysis, Long Range Planning, 15(2), pp. 54-66.
28 Kay, J. (1999) ‘strategy and the delusion of Grand Design’, Financial Times, mastering strategy: Resource Based Strategy, part one 27september, [online] Available at:
http://www.johnkay.com/1999/09/27/mastering-strategy-resource-based-strategy/, Accessed on: 13/09/2010.
Kay, J. (1993) ‘foundation of corporate successes’, Oxford: Oxford University press.
Keeny, R.L., Raiffa, H. (1976) ‘Decisions with multiple objectives: Preferences and value tradeoffs’, New York: Wiley.
Kokkinaki, I. A., Mylonas, S., and Mina, S. (2005) ‘E-government Initiatives in Cyprus’, e-Government Workshop, Brunel University, West London UB8 3PH, UK, available at:
http://www.iseing.org/egov/eGOV05/Source%20Files/Papers/CameraReady-25-P.pdf, accessed on: 12/09/2010.
Kurttila, M., Pesonen, M., Kanga, J., and Kajanus, M. (2000) ‘Utilizing the analytic hierarchy process (AHP) in SWOT analysis-a hybrid method and its application to a forecast-certification case’, Forecast Policy and Economics, Vol.1, pp 41-52.
Layne, K., and Lee J. (2001) ‘developing fully functional E-government: A four stage model, Government Information Quarterly vol. 18, pp 122–136.
Learned, E. P., Christiansen, C. R., Andrews, K. and Guth, W. D., (1969) ‘Business policy: Tax and Cases’, Irwin: Homewood, IL.
Lootsma, F.A., Boonekamp, P.G.M., Cooke, R.M., Van, and Oostvoorn, F. (1990) ‘Choice of a long term strategy for the national electricity supply via scenario analysis and multi-criteria analysis’, European Journal of Operational Research, Vol. 48, pp 189–203.
Mohammad, H., Almarabeh, T., and Abu Ali, A. (2009) ‘E-government in Jordan’, European Journal of Scientific Research, Vol.35, No.2, pp.188-197
Ministry of Information and Communications Technology (MOICT), (2006) ‘The Hashemite Kingdom of Jordan, Ministry of Information and Communications Technology’, [online] available at: http://www.moict.gov.jo/e_gov_strategy/e-Government%20Strategy.pdf,
Accessed on 11/09/2010
Morse, L. E.. (2002) ‘Evaluation Methodologies for Information Management Systems’,D-Lib Magazine, Vol. 8, N0 9, Available at: http://www.dlib.org/dlib/september02/morse/09morse.html, Accessed on: 20/09/2010
Mousavi, S. A, Pimenidis, E., and Jahankhani, H. (2010) ‘Five Stage Development Framework for Electronic Government’, the 10th European Conference on e-Government, 17-18 June 2010, Limerick-Ireland
29 Nour, M. A., AbdelRahman, A. A., and Fadlalla, A. (2008) ‘A context-based integrative framework for E-Government initiatives’, Government Information Quarterly, Vol. 25, Issue 3, pp 448-461.
Piercy, N., and Giles, W. (1989) ‘ Making SWOT analysis Work’, Journal of marketing intelligence and planning, Vol. 7, No 5/6, pp 5-7
Pohekar, D. S., Ramachandran, M. (2004) ‘an Application of multi-criteria decision making tosustainable energy planning-A review’, Renewable and Sustainable Energy Reviews, Vol. 8, pp 365–381
Ramik, J., and Korviny, P. (2010) ‘Inconsistency of pair-wise comparison matrix with Fuzzy elements based on geometric mean’, Fuzzy sets and systems, Vol. 161, Issue 11, pp 1604-1613.
Saaty, T.L. (2008) ‘Decision making with the analytic hierarchy process’, Int. J. Services Sciences, Vol. 1, No. 1, pp.83–98.
Saaty, T.L. and Forman, E.H. (1993) ‘The Hierarchon – A Dictionary of Hierarchies’, Pittsburgh, PA: RWS Publications
Saaty, T.L. (1992) ‘Decision making for leaders’, Pittsburgh: RWS Publications.
Saaty, T.L. (1977) ‘A scaling method for priorities in hierarchical structures’, Scandinavian Journal of Forest Research, Issue 15, pp 234-281
Saaty, T. L. (1980) ‘The analytic hierarchy process’, New York: McGraw-Hill.
Shahrabi, S. M., Pariazar, J., and Zaeri, S. M. (2007) ‘Project Selection by Using Fuzzy AHP and TOPSIS Technique’, World Academy of Science, Engineering and Technology, Vol. 30, pp 333-338
Shareef, S. (2011) Cultivating Transparency and Trust by Adopting E-Government Model in Regional Governments in Developing Countries: The Case of Kurdistan Region of Iraq (KRI), the World Kurdish Congress (WKC) conference, 7-9 October 2011, Amsterdam, Netherlands.
Shareef, S. Jahankhani H. and Dastbaz, M. (2011) ‘E-Government Stage Model: Based on Citizen-Centric Approach in Regional Government in Developing Countries’, International Journal of Electronic Commerce Studies. In press
Shareef, S. Arreymbi, J. Jahankhni. H. and Pimendis, E. (2010a) ‘mutli-channel delivery of services: initial pace towards m-government: the case of Kurdistan region of Iraq’, proceeding of the Advance in Computing and Technology, January 2010, pp54-63, ISBN: 978-0-9564747-0-4 Shareef, S. Pimenidis, E., Arreymbi, J., and Jahankhani, H. (2010b) ‘Vision of Electronic
Government Implementation in the Kurdistan Region of Iraq ‘, the 10th European Conference on e-Government, 17-18 June 2010, Limerick-Ireland.
30 Siau, K., and Long, Y. (2005) ‘Synthesizing e-government stage models - a meta-synthesis based on meta-ethnography approach’, Industrial Management + Data Systems, vol. 105, Issue, 3/4, pp, 443-458.
Taylor, B. W., (2004) ‘Introduction to Management Science’, New Jersey: Pearson Education Inc.
Turban, E., (1995) ‘Decision support and expert system’, Prentice Hall, New York
United Nations, (2008) ‘UN E-Government survey 2008: from E-Government to connected governance’, Department of Economic and Social Affairs Division for Public Administration and Development Management New York: United Nations, p 35
Vahidniaa, M.H., Alesheikhb, A., Alimohammadic, A., and Bassirid, A. (2008) ‘Fuzzy Analytical Hierarchy Process in GIS application’, The International Archives of the Photogrammetry, Remote Sensing and Spatial Information Sciences, [Online], Available at:
http://www.isprs.org/proceedings/XXXVII/congress/2_pdf/4_WG-II-4/15.pdf, Accessed on: 11/08/2010
Villinger, D. N. (2009) ‘Analyzing non-profit organizations: managerial frameworks and evaluation’, Journal of Global Business, Vol. 3, No. 1, pp 61-66
WICKRAMASINGHE, V. and TAKANO, S. (2009) Application of Combined SWOT and Analytic Hierarchy Process (AHP) for Tourism Revival Strategic Marketing Planning: A Case of Sri Lanka Tourism, Journal of the Eastern Asia Society for Transportation Studies, Vol.8, pp 1-16.
Winklhofer, H. (2002) ‘A case for Soft Systems Methodology, Information Analysis and Information Systems Evaluation during Organizational change’, European Conference on
Information Systems, [online], Available at: http://is2.lse.ac.uk/asp/aspecis/20020045.pdf, Accessed on: 3/09/2010
Wang, E., Triantaphyllou, E. (2006) ‘Ranking irregularities when evaluating alternatives by using some ELECTRE methods’, Omega, Vol. 35, pp 45-63
Wheelen, L. T., and Hunger, J. D. (1998) ‘Strategic Management and Business Policy’, 5th Ed. Addison, Reading: Wesley, MA.