Evaluation of UAE PPP from Developers Perceptions with Global PPP
Comparisons
Emran AlOtaibi
1Mohammed Refai
2Anas Naqawa
31,2,3
University of Sharjah, Sharjah, United Arab Emirates
Abstract— The projects between the private and public sectors is becoming more important nowadays. The regulations that controls such partnership called Private-Public-Partnership or PPP, each country has its own regulations in that interest. However, some of them are considered the best among the world PPPs, and some are less preferable. This paper will illustrate, an evaluation of the public private partnership in UAE guidelines by stakeholders who have experience in that regard, and then will introduce the Plus-Delta method, to compare between the best practices of PPP in the near regions (in Asia it is Australia, and South Africa), and discuss their negative and positive points. Moreover, analysis was made also to find what and how countries’ characteristics, affects the ranking or evaluation of PPP around the world.
Key words: Private-Public-Partnership, Plus-Delta Method, Stakeholders
I. INTRODUCTION
Private Finance Initiative (PFI) and Public Private Partnerships (PPP) are forms of liberalization from conventional project procurement forms where public services and facilities are produced and delivered through a partnership over a long-term contractual relationship between both public and private sectors and targeting planning,
designing, financing, implementing, and operating
infrastructure facilities and services that were traditionally provided by the public sector only (Jamali, 2004).
Developing national capital markets is a long-term undertaking by governments and progress is generally incremental. A number of multilateral bond markets and project finance markets have been implemented in the region in recent years and there is an important role for national currency debt markets to facilitate small and medium size PPP projects and encourage the participation of local investors and contracting firms.
The main objectives of this paper are:
Evaluate the PPP in United Arab Emirates by evaluating
the Stake holder's perception and experience with it.
To compare PPP in United Arab Emirates, with the best
practices in the near regions.
To find any available relation between the change in the evaluation points and countries’ dependent variables.
II. LITERATURE REVIEW
There has been significant growth in the PPP model throughout the world. In fact, it is estimated that there has been an increase of 60% in the use of PPPs worldwide and this growth is rapidly embracing the UAE (Foo, 2010). According to Jamali (2004), the growing appreciation of the importance of the market mechanism, coupled with the success of a privatization approach in various countries has increased interest in the continuously emerging PPP phenomenon. Several factors served to increase the interest
and popularity of PPPs approach in different countries. The demand of PPPs can be generally explained in terms of their expected benefits, including access to private finance for expanding services, clearer objectives, new ideas, and flexibility, better planning, and improved incentives for competitive tendering, and finally greater value for money for public projects (Jamali, 2004).
PPP is also becoming popular in Australia. New South Wales (NSW), like other states of Australia, has faced increasing demands for infrastructure of all types. Meeting these demands has been difficult due to budgetary restraints. Raneberg (1994) has described the four key reform objectives of the NST Government as the optimal allocation of scarce public sector resources, efficiency, better service, and accountability for performance. A range of market-orientated initiatives have been employed to secure these objectives. These include measures ranging from wholesale privatization to contracting out in-house service needs, as well as private sector participation in infrastructure projects.
Laurie (2000) described the Melbourne City Link project which was financed by the private sector as a BOOT scheme with a concession period of 34 years. The Concession Deed is the primary contract between the State and the City Link developer Trans urban City Link Limited. City Link is a $2 billion ($US1.2 billion) privately funded electronic toll road in the heart of Melbourne. The project joins together three of the city’s freeways, creating a 22-km expressway linking the major routes between Melbourne Airport, the port and industrial centers in the Southeast.
According to an NSW Government report (1993), contracting out services from road maintenance to hospital catering achieved average savings of 20%. At least 34 major projects of privately provided infrastructure have either been completed or are planned in NSW. The total cost of these amounts to over a$13 billion. Virtually all these projects are BOO, BOT or BOOT models.
PPP is very much a buzzword in South Africa today, where the prison sector in particular has become an area for PPP (Ball, 1999). PPP agreements need prior written approval by the national treasury or the relevant provincial treasury (Government Gazette, 2000) (viewed on 8 September 2000). A build-operate-train-transfer (BOTT) program has been implemented in a water system in South Africa. However, according to Gentry and Fernandez (199Z), this kind of PPP has not yet been widely applied worldwide.
facilities, ranging from bridges, tunnels and roads, to schools, hospitals, and even defense facilities.
PFI is moving intense notice in Japan where it is maintained by an Act of Parliament. The most important measure of that Act is the exemption of PFIs from the five-year limitation on central government. Nakamura (2000) noted that local governments are enthusiastic about PFI because of their severe financial difficulties. According to Ball (1999), the initiative is believed appropriate for a multiplicity of sectors within the Japanese economy, containing health, transport and waste disposal.
The famous term of the PPP contractual relationship is the Build, Operate, and Transfer (BOT) and Build, Own, Operate, and Transfer (BOOT). As indicated by Merna (2008), the BOOT projects, some of the time mentioned to as a concession contract, can be characterized as a venture in view of the giving of a concession by a principal, as a rule a government, to a promoter, at times known as the concessionaire, who is in charge of the development, financing, operation, and maintenance of an facility over the time of the concession before at last exchanging, at no cost to the important, as a completely operational facility. Amid the concession time frame, the promoter possesses and works the office and gathers revenues keeping in mind the end goal to refund the financing and investment cost, keep up and work the facility, and influence an edge to benefit (Merna, 2008).
Three main causes for using the PPP approach were proposed by Walker et al (1995). First, better mobility provided by the private sector that contributes in cost saving, avoidance of bureaucracy, and reduction of administrative burden. Second, the private sector can give enhanced support of the public sector and shape a decent public-private partnership with the goal that an adjust chance return structure can be saved. Third, the private sector cooperation can likewise alleviate the government's financial burden as the government does not have the capacity of raising assets for extensive scale infrastructure projects.
Nevertheless, as indicated by Levy (1996), different issues have been accounted for on PPP activities around the globe that have in the long run prompted project failure. Public resistance because of different variables has been accounted for as the principle explanations behind failure in a few examples. Major PPP transportation initiatives in the United States have reportedly failed due to stakeholder opposition. These failures were mainly due to the fact that public was (a) unware of the concept of PPP, (b) not sufficiently educated about PPP, and (c) denied access to detailed information contained i n the consortium’s PPP proposals (Levy, 1996). In addition, the multiplicity of parties and their interrelated contractual relationships give rise to complex and time consuming negotiations. Furthermore, the lack of expertise in putting together a B OT project, particularly within governments, acts as a hindrance in the negotiating process (Kagiannas et al., 2003).
In general, the different parties involved in the PPP scheme are either individuals or organizations which are affected by or affect the development of the project. Therefore, it is important to capture their input to determine their views and concerns to better facilitate the development of a project that will meet the needs of those different parties
III. METHODOLOGY
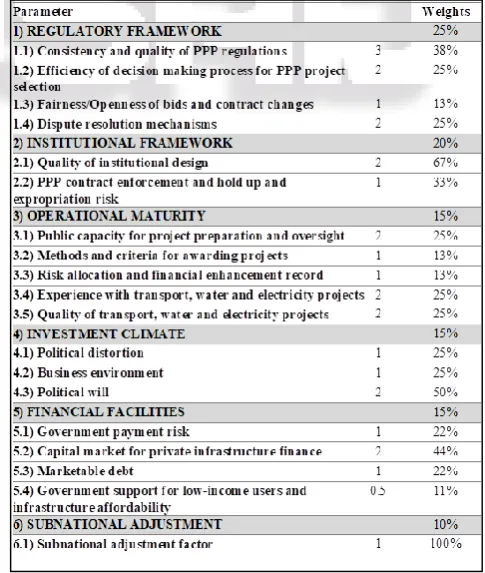
The methodology first followed qualitative analysis, to evaluate the current UAE PPP, from the internal community that had experience in such partnership, as it will more representative than just assuming. However, there is no data available online, for this evaluation, the World Bank guidelines for ranking the PPP all around the world uses the following parameters and weights:
Parameter Category weights
within the index
Weights (100%) 1) Regulatory
framework 1.5 25.00%
2) Institutional
framework 1.2 20.00%
3) Operational
maturity 0.9 15.00%
4) Investment
climate 0.9 15.00%
5) Financial
facilities 0.9 15.00%
6) Subnational
[image:2.595.305.548.410.697.2]adjustment 0.6 10.00%
Table 1: Parameter Wieghts according to World Bank PPP And also those categories of ranking, were divided depending on the concern points in the PPP evaluation in general, then the weights of each of those points were assigned according to its effect on the implementation of the PPP, and each point should be graded from 0 to 4 (4 is best, 0 worst), the parameters and their weights were as follows:
have been also done in the same procedure as mentioned above. The comparison will lead to the Plus-Delta Analysis, which in other words, will clarify where are the negative points that should be improved (Delta) and the positive points (Plus).
Another comparison will be introduced, that will include dependent parameters, which are the countries’ economic or general characteristics that are expected to have correlations with the World Bank Guidelines for ranking. This method will justify what can increase the ranking or effect it negatively.
Massive data collection was done for the collection of dependent parameters for the UAE, Australia and South Africa, such as: Industry/GDP, Urban population individually and as percentage from the total population…etc.
IV. DATA COLLECTED
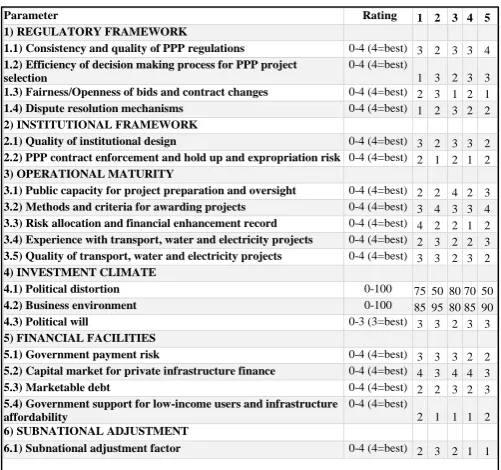
[image:3.595.307.558.65.300.2]The collected data for the PPP in UAE was from 5 different stakeholders in different cities in UAE, the ranking was sent and the following response was received:
Table 2: Data Obtained from Stakeholders
As previously explained, further data collection was done for countries’ parameters:
DEPENDENT VARIABLES Units Number Number Number
BG1) Real GDP (PPP US$ at 2005 prices) bil USD 600.0 883.2 589.6
BG2) Real GDP (US$ at 2005 prices) bil USD 318.6 936.5 360
BG3) Real gross fixed investment (US$ at 2005 prices) bil USD 66.5 288.3 75
BG4) Real exports of G&S (US$ at 2005 prices) bil USD 80.3 196.9 391.38
BG5) Real imports of G&S (US$ at 2005 prices) bil USD 105.4 250.2 353.76
BG6) Real domestic demand (US$ at 2005 prices) bil USD 346.1 985.3 245.0913
BG7) Nominal private consumption bil USD 207.4 801.4 203.99
BG8) Nominal government consumption bil USD 76.3 256.2 48.922
[image:3.595.55.541.332.747.2]BG9) Nominal gross fixed investment bil USD 72.6 383.7 82.46
Table 3: Data for Different Properties of Countries, Sources in References
DEPENDENT VARIABLES Units Number Number Number
BG10) Nominal domestic demand bil USD 356.8 1441.9 362.5
BG11) Deposit interest rate (%) % 5.5 2.904 3.6
BG12) Money market interest rate (%) % 5.3 2.5 2
BG13) Long-term bond yield (%) % 8.2 3.657 4
BG14) Population (% change pa) % 0.7 1.2 0.7
BG15) Labour force, m million 20.2 12.32 6.302
BG16) EIU overall business environment rating (10=high) R 6.0 8.2 7.22
BG17) Industry/GDP % 30.9 28.6 55.06
BG18) Industry (% real change pa) % 2.0 4.1 4.289
BG19) Services/GDP % 65.9 67.6 44.2
BG20) Services (% real change pa) % 1.5 2.3 3.04
BG21) Urban population thousand 33,650.0 21080 7854
BG22) Urban population (% of total pop) % 63.3 89.3 85.8
BG23) EIU infrastructure rating (10=good) R 6.9 8.6 7.3
BG24) EIU policy towards private enterprise rating (10=good) R 5.2 9 5.8
BG25) EIU policy environment for foreign investment rating (10=good) R 6.0 8.7 6.9
BG26) Access to electricity (% of population) % 82.7 100 100
BG27) Electricity production (MWh) KWh 2.6E+11 2.5E+11 1.2E+11
BG28) Improved sanitation facilities (% of population with access) % 74.4 100 98
BG29) Improved water source (% of population with access) % 95.1 100 100
BG30) Ease of doing business index (1=easiest to 183=most difficult) Rank 43 10 21
Table 5:
Parameter Rating 1 2 3 4 5
1) REGULATORY FRAMEWORK
1.1) Consistency and quality of PPP regulations 0-4 (4=best) 3 2 3 3 4 1.2) Efficiency of decision making process for PPP project
selection
0-4 (4=best)
1 3 2 3 3 1.3) Fairness/Openness of bids and contract changes 0-4 (4=best) 2 3 1 2 1 1.4) Dispute resolution mechanisms 0-4 (4=best) 1 2 3 2 2
2) INSTITUTIONAL FRAMEWORK
2.1) Quality of institutional design 0-4 (4=best) 3 2 3 3 2 2.2) PPP contract enforcement and hold up and expropriation risk 0-4 (4=best) 2 1 2 1 2
3) OPERATIONAL MATURITY
3.1) Public capacity for project preparation and oversight 0-4 (4=best) 2 2 4 2 3 3.2) Methods and criteria for awarding projects 0-4 (4=best) 3 4 3 3 4 3.3) Risk allocation and financial enhancement record 0-4 (4=best) 4 2 2 1 2 3.4) Experience with transport, water and electricity projects 0-4 (4=best) 2 3 2 2 3 3.5) Quality of transport, water and electricity projects 0-4 (4=best) 3 3 2 3 2
4) INVESTMENT CLIMATE
4.1) Political distortion 0-100 75 50 80 70 50 4.2) Business environment 0-100 85 95 80 85 90
4.3) Political will 0-3 (3=best) 3 3 2 3 3
5) FINANCIAL FACILITIES
5.1) Government payment risk 0-4 (4=best) 3 3 3 2 2 5.2) Capital market for private infrastructure finance 0-4 (4=best) 4 3 4 4 3 5.3) Marketable debt 0-4 (4=best) 2 2 3 2 3 5.4) Government support for low-income users and infrastructure
affordability
0-4 (4=best)
2 1 1 1 2
6) SUBNATIONAL ADJUSTMENT
[image:3.595.63.539.335.743.2]V. RESULTS
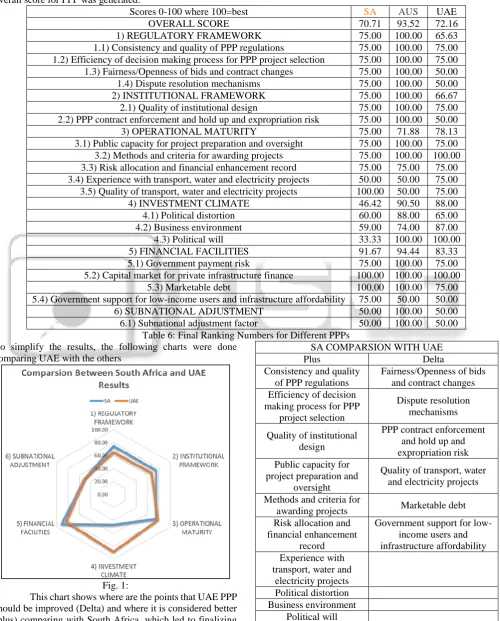
After calculating the weights of each given rank for all countries and sum them for each category the following final overall score for PPP was generated:
Scores 0-100 where 100=best SA AUS UAE
OVERALL SCORE 70.71 93.52 72.16
1) REGULATORY FRAMEWORK 75.00 100.00 65.63
1.1) Consistency and quality of PPP regulations 75.00 100.00 75.00
1.2) Efficiency of decision making process for PPP project selection 75.00 100.00 75.00
1.3) Fairness/Openness of bids and contract changes 75.00 100.00 50.00
1.4) Dispute resolution mechanisms 75.00 100.00 50.00
2) INSTITUTIONAL FRAMEWORK 75.00 100.00 66.67
2.1) Quality of institutional design 75.00 100.00 75.00
2.2) PPP contract enforcement and hold up and expropriation risk 75.00 100.00 50.00
3) OPERATIONAL MATURITY 75.00 71.88 78.13
3.1) Public capacity for project preparation and oversight 75.00 100.00 75.00
3.2) Methods and criteria for awarding projects 75.00 100.00 100.00
3.3) Risk allocation and financial enhancement record 75.00 75.00 75.00
3.4) Experience with transport, water and electricity projects 50.00 50.00 75.00
3.5) Quality of transport, water and electricity projects 100.00 50.00 75.00
4) INVESTMENT CLIMATE 46.42 90.50 88.00
4.1) Political distortion 60.00 88.00 65.00
4.2) Business environment 59.00 74.00 87.00
4.3) Political will 33.33 100.00 100.00
5) FINANCIAL FACILITIES 91.67 94.44 83.33
5.1) Government payment risk 75.00 100.00 75.00
5.2) Capital market for private infrastructure finance 100.00 100.00 100.00
5.3) Marketable debt 100.00 100.00 75.00
5.4) Government support for low-income users and infrastructure affordability 75.00 50.00 50.00
6) SUBNATIONAL ADJUSTMENT 50.00 100.00 50.00
[image:4.595.51.552.124.746.2]6.1) Subnational adjustment factor 50.00 100.00 50.00
Table 6: Final Ranking Numbers for Different PPPs To simplify the results, the following charts were done
[image:4.595.51.289.485.717.2]comparing UAE with the others
Fig. 1:
This chart shows where are the points that UAE PPP should be improved (Delta) and where it is considered better (plus) comparing with South Africa, which led to finalizing
SA COMPARSION WITH UAE
Plus Delta
Consistency and quality of PPP regulations
Fairness/Openness of bids and contract changes Efficiency of decision
making process for PPP project selection
Dispute resolution mechanisms
Quality of institutional design
PPP contract enforcement and hold up and expropriation risk Public capacity for
project preparation and oversight
Quality of transport, water and electricity projects
Methods and criteria for
awarding projects Marketable debt
Risk allocation and financial enhancement
record
Government support for low-income users and infrastructure affordability Experience with
transport, water and electricity projects Political distortion Business environment
Government payment risk
Capital market for private infrastructure
finance Subnational adjustment
[image:5.595.48.287.61.347.2]factor
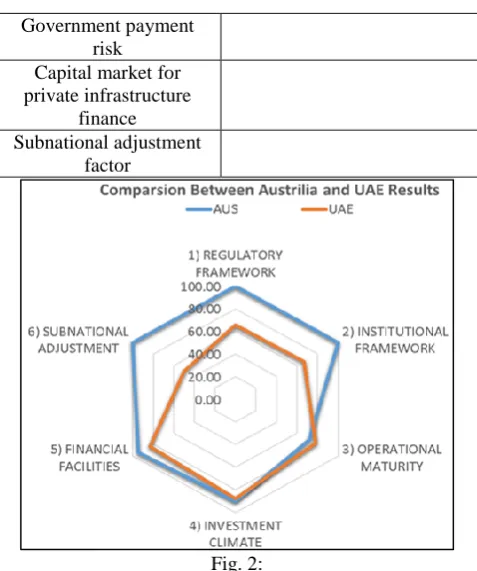
Fig. 2:
While this chart shows where are the points that UAE PPP should be improved (Delta) and where it is considered better (plus) comparing with Australia, which also led to finalizing the below shown table:
Australia
Plus Delta
Methods and criteria for awarding projects
Consistency and quality of PPP regulations
Risk allocation and financial enhancement record
Efficiency of decision making process for PPP
project selection
Experience with transport, water and electricity projects
Fairness/Openness of bids and contract
changes Quality of transport, water
and electricity projects
Dispute resolution mechanisms
Business environment Quality of institutional
design
Political will
PPP contract enforcement and hold up
and expropriation risk
Capital market for private infrastructure finance
Public capacity for project preparation and
oversight Government support for
low-income users and infrastructure affordability
Political distortion
Government payment risk
Marketable debt Subnational adjustment
factor
After the analysis of the guidelines, the Plus Delta Comparative analysis were used. The analysis made for UAE and two benchmark were used SA (South Africa) and AUS (Australia). The Plus and Delta were identified for each one
according to the check list of the World Bank. The above tables show the plus and delta in UAE PPP guidelines not the parameter of guideline but the point of concern in each parameter. The results from analysis show that the guidelines of UAE are better than the SA guidelines but that does not eliminate the negative element in the guideline that should be improved. However, the Delta from analysis with AUS guidelines are more than the Plus and the delta from SA analysis is same from AUS. That confirm the result and should be improved in the UAE guidelines.
VI. DISCUSSION
The first comparison chart shows the result of the analysis of each parameter from the PPP guideline. It is used to find the Plus and Delta. It shows that UAE has Plus only operational maturity, almost similar to AUS in the investment climate and other parameter are Delta. Which mean that all the Delta should be improved in UAE PPP.
While second one chart shows the comparison between SA (South Africa) and UAE.it shown clearly that UAE is better than SA in couple of parameter which are operational maturity and investment climate. The other parameters are considered as Delta.
[image:5.595.306.547.361.523.2]And after plotting the obtained values with the countries parameters, the following graphs were generated:
Fig. 3:
Regulatory framework means the presence of the important infrastructure that enhance the implementation and the direction of a proposed law or principle, this framework ranking increases with the increase of the private consumption.
Fig. 4:
[image:5.595.310.546.581.737.2]Fig. 5:
[image:6.595.311.546.67.221.2]The Gross domestic product has a positive effect on the regulatory framework which means the increase of the GDP enhances the regulatory framework ranking. GDP includes all consumer from private and public, investments, foreign balance of trade and …etc., so it will affect the regulatory framework.
Fig. 6:
The investment climate is positively affected by the EIU infrastructure ranking, the higher EIU ranking encourage the investment in the infrastructure market. There are many factors affecting the investment climate like crime, national security, political instability, regime uncertainty, taxes, rule of law and government transparency. The EIU infrastructure ranking takes into consideration these factors.
Fig. 7:
[image:6.595.309.547.260.419.2]The increase of the investment climate ranking will have a positive effect of the industry and the percentage change in the industry per annum will be positive. The positive effect due to multiple of factors affecting the investment climate such as: national security, taxes and political instability
Fig. 8:
A high interest rate of the projects will result into a low ranking of for the investment climate because the risk will be high for the investors and the profits will not be encouraging.
Fig. 9:
The positive percentage change in the infrastructure industry will lead to a higher ranking of the financial facilities in the country.
Fig. 10:
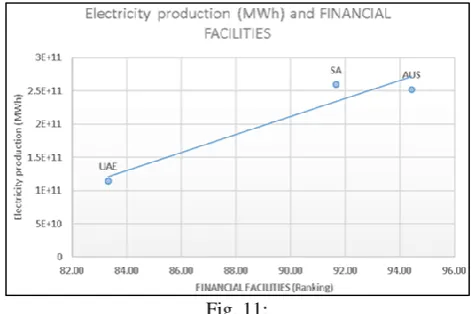
[image:6.595.47.287.289.450.2] [image:6.595.309.547.449.613.2] [image:6.595.51.283.517.671.2]Fig. 11:
The higher financial facilities ranking in a country will lead to higher production rates of electricity in order to cover the demand of that developed facilities.
VII. LIMITATIONS & CONSIDERATIONS
The ranking was mostly qualitative, which may need to be improved to get more accurate scores, and the comparison between only three PPPS may be not sufficient for confirming the whole colorations, so ore further comparisons should be done in that regard
VIII. CONCLUSION
The aim of the paper was to find the positives and the negatives of the PPP in UAE by comparing it to the best countries in the world. As a result of the comparison, UAE had better operational maturity than Australia but in terms of the other factors, Australia was better. The results of the comparison between UAE and South Africa were slightly different as UAE was better in operational maturity and investment climate, the subnational adjustment was almost the same between the two countries but South Africa was better in the rest of the factors. As a conclusion, UAE needs to improve its PPP regulations in order to make it more effective and to attract more foreign investment to help develop the country. This can only be done by implementing new policies and improving the existing ones to reach an international attractive standard.
The computed ranks were also compared with the properties of countries, and some colorations were obtained such as increasing the electricity production would increase th financial facilities.
REFERENCES
[1] http://www.iea.org/publications/freepublications/public ation/KeyWorld2017.pdf. Retrieved 4 – December - 2017
[2] http://www.iea.org/publications/freepublications/public ation/KeyWorld2017.pdf. 4 – December - 2017
[3] https://data.worldbank.org/indicator/NV.IND.TOTL.ZS
?locations=AE. 4 – December - 2017
[4]
https://www.indexmundi.com/facts/united-arab-emirates/exports-of-goods-and-service. 4 – December - 2017
[5]
https://tradingeconomics.com/united-arab-emirates/imports-of-goods-and-services-us- . 4 –
December - 2017
[6] dollar-wb-data.html. . 4 – December - 2017 [7]
https://www.ceicdata.com/en/indicator/united-arab-emirates/nominal-gdp 4 – December - 2017
[8]
https://www.ceicdata.com/indicator/united-arab-emirates/private-consumption--of-nominal-gdp 4 –
December - 2017
[9]
https://tradingeconomics.com/united-arab- emirates/general-government-final-consumption-expenditure-percent-of-gdp-wb-data.html 4 – December - 2017
[10] https://www.ceicdata.com/indicator/united-arab-emirates/gross-fixed-capital-formation 4 – December - 2017
[11] https://www.ceicdata.com/en/indicator/united-arab-emirates/nominal-gdp 4 – December - 2017 [12]
https://tradingeconomics.com/united-arab-emirates/deposit-interest-rate-percent-wb-data.html 4 – December - 2017
[13] https://tradingeconomics.com/united-arab-emirates/interest-rate 4 – December - 2017
[14]http://www.uaeinteract.com/news/default3.asp?ID=353
#45852 4 – December - 2017
[15]https://www.google.ae/publicdata/explore?ds=d5bncppj
of8f9_&met_y=sp_pop_grow&hl=ar&dl=ar 4 –
December - 2017
[16] https://government.ae/en/information-and-services/jobs/uae-workforce 4 – December - 2017 [17]http://www.iberglobal.com/files/business_climate_eiu.p
df 4 – December - 2017
[18]https://data.worldbank.org/indicator/NV.IND.TOTL.ZS
?locations=AE 4 – December - 2017
[19]https://data.worldbank.org/indicator/NV.IND.TOTL.K
D.ZG?locations=AE 4 – December - 2017
[20]https://data.worldbank.org/indicator/NV.SRV.TETC.ZS
?locations=AE 4 – December - 2017
[21]https://data.worldbank.org/indicator/NV.SRV.TETC.K
D.ZG?locations=AE 4 – December - 2017
[22]https://data.worldbank.org/indicator/SP.URB.TOTL?loc
ations=AE 4 – December - 2017
[23]https://data.worldbank.org/indicator/SP.URB.TOTL.IN.
ZS 4 – December - 2017
[24]http://country.eiu.com/article.aspx?articleid=154560273 8&Country=United%20Arab%20Emirates&topic=Busi ness&subtopic=Business+environment&subsubtopic=I nfrastructure&aid=1&oid=226132406 4 – December - 2017
[25]http://country.eiu.com/article.aspx?articleid=128560271 2&Country=United%20Arab%20Emirates&topic=Busi ness&subtopic=Business+environment&subsubtopic=B usiness+environment+rankings&aid=1&oid=22613240 6 4 – December - 2017
[26]http://country.eiu.com/article.aspx?articleid=128560271 2&Country=United%20Arab%20Emirates&topic=Busi ness&subtopic=Business+environment&subsubtopic=B usiness+environment+rankings&aid=1&oid=22613240 6 4 – December - 2017
[27]https://data.worldbank.org/indicator/EG.ELC.ACCS.ZS
[28]http://www.iea.org/publications/freepublications/public ation/KeyWorld2017.pdf4 – December - 2017
[29]https://data.worldbank.org/indicator/SH.STA.ACSN 4 –
December - 2017
[30]https://data.worldbank.org/indicator/SH.H2O.SAFE.UR
.ZS?end=2015&start=1990 4 – December – 2017
[31]http://www.doingbusiness.org/data/exploreeconomies/u