An Efficient System For Preprocessing Confocal
Corneal Images For Subsequent Analysis
Mhd Saeed Sharif a, Rami Qahwaji a, Sofyan Hayajneh b, Stan Ipson a, Rania Alzubaidi a, Arun Brahma c a School of Electrical Engineering and Computer Science, University of Bradford, Bradford, UK.
b Isra University, Engineering Faculty, Amman, Jordan.
c Manchester Royal Eye Hospital, Central Manchester University Hospitals NHS Foundation Trust, Manchester Academic Health
Science Centre, Manchester, M13 9WL, UK.
Abstract— A confocal microscope provides a sequence of images of the various corneal layers and structures at different depths from which medical clinicians can extract clinical information on the state of health of the patient’s cornea. Preprocessing the confocal corneal images to make them suitable for analysis is very challenging due the nature of these images and the amount of the noise present in them. This paper presents an efficient preprocessing approach for confocal corneal images consisting of three main steps including enhancement, binarisation and refinement. Improved visualisation, cell counts and measurements of cell properties have been achieved through this system and an interactive graphical user interface has been developed.
Keywords—Confocal microscope; Cornea; Preprocessing.
I. INTRODUCTION
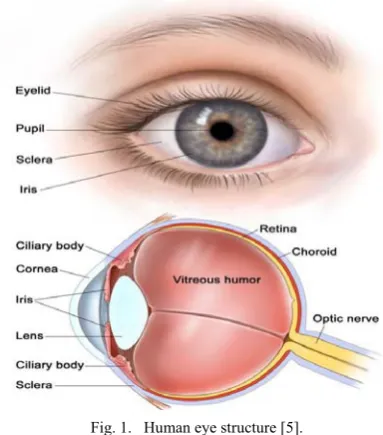
The cornea is the transparent surface component of the eye covering important internal structures including the iris, lens, and anterior chamber. The structure of the human eye is illustrated in Fig. 1. Damage to the cornea caused by disease or injury can critically affect the quality of vision. The cornea comprises of proteins, fibrils and various cells in a highly organised structure [1]. The fixed focusing power provided by the air to cornea surface is one of the cornea’s major functions, which together with the contribution provided by the adjustable internal lens causes the light rays passing through to produce a sharp image on the retina. Another function of the cornea is to protect the retina by filtering dangerous ultraviolet light waves. The cornea also works as a shield to protect the internal structures from attack by microorganisms.
The cornea joins smoothly with the non-transparent conjunctiva and has lateral dimensions of around 12.6 mm in the horizontal direction and 11.7 mm in the vertical direction. The thickness of cornea is non-uniform and ranges from about 520 μm at the centre to about 650 μm at the periphery [1, 2]. The cornea has a tear film on its front surface and three main internal layers separated by two thin membranes. The corneal layers are the outermost epithelium layer, separated by Bowman’s membrane from the central stroma layer, which is separated in turn by Decement’s membrane from the innermost endothelium layer. The corneal structure is shown in Fig. 2.
Confocal microscopy of the cornea offers several advantages. It provides images showing the cell structures in the different corneal layers, which can be obtained with typical minimum depth separation of about 5 μm, and they can be immediately viewed and used for diagnostic purposes. During a typical Confoscan 4 scan, the microscope locates the rear of the cornea (no signal back from vitreous humour) and steps forward by the increment specified until it reaches the anterior surface of the cornea (no signal back from the tear layer). This cycle is repeated 3 times during a 20 seconds scan providing around 350 images. The acquired two-dimensional images are useful to extract important clinical information on the corneal state of health and to analyse corneal structures in the whole volume of the cornea, not only in a layer at a specific depth. Because of the spherical shape of corneal layers, which causes a non-uniform reflection of illumination light in the different corneal areas, and the different attenuation of light along the various illumination paths; acquired images do not usually have a uniform luminosity and contrast, exhibiting darker areas in the peripheral regions of the image [3].
Confocal microscopy offers clinicians one of the most detailed views of corneal structures and pathologies. It helps to differentiate bacterial, viral, parasitic and fungal infections and can also give cell counting information. This is usually done manually or semi-automatically. It provides very sharp images of each layer of the cornea [3]. Examples of corneal images for stroma and endothelium layers are presented in Fig. 3(a) and Fig. 3(b) respectively.
Injuries, infections, dystrophies and ocular diseases (such as lattice dystrophy), refractive errors, dry eye, genetic conditions and changes due to ageing can all reduce the ability to see clearly, sometimes causing pain and discomfort as well. Some of these corneal conditions are possible to see developing, while others are difficult to monitor. Treatments can involve eye drops, other medications, contact lenses, surgery (such as corneal graft operations), etc. Small changes in the cornea can significantly affect its visual performance [4].
Fig. 1. Human eye structure [5].
[image:2.595.39.290.362.542.2]This paper is organised as follows. Section II presents the current corneal state of the art including the technical and clinical related corneal research work. The proposed approach including the employed data sets and the preprocessing system is presented in Section III, while the conclusions are presented in Section IV.
Fig. 2. Cornea structure.
a b
Fig. 3. Confocal cornea examples: (a) Stroma layer, (b) Endothelium layer.
II. STATE OF THE ART
A. Current Technical Cornea Related Research Work
The existing literature on confocal microscope related corneal image processing and classification is very limited but includes the following examples.
The work presented in [6] addresses the problem of obtaining a 3-dimensional (3D) reconstruction of the cornea starting from endothelium to epithelium, from a sequence of confocal microscope images. The pre-processing phase in [6] was introduced to reduce the blurring presented in the image. The authors applied to each image a high-pass frequency filter, and the intensity was then adjusted using a sinusoidal transformation curve. Movements of the cornea cause misalignments and shifts in the x-y plane. Usually, these shifts are just a few pixels (from 0 to 3 μm), but larger shifts (more than 10 μm) are sometimes present. To compensate for these movements, the authors apply a registration procedure between each pair of images in the sequence consisting of the following steps. The first is the identification of two regions of interest (ROIs) in the first image, having the highest brightness and contrast. The purpose is to the select two ROIs that may lead to a good match in the next image. Second, a normalised correlation method is used to calculate the shifts required along x- and y-axis to obtain the position of the best match of the two ROIs in the second image. The two ROIs are registered separately. Third, the two registrations obtained for the two ROIs are compared and if x and y shifts calculated for the first ROI are not the same of those calculated for the second ROI (with a tolerance of one pixel), then the registration is considered a failure. In this case, x and y shifts are set to 0 and the user is informed.
The work presented in [6] has also considered a 3D stack reconstruction by taking into account shifts along x, y and z directions. Shifts along x and y directions come from the registration process, shift along z direction comes from the use of a Z-ring sensor. The stack is used to generate the 3D reconstructions and to visualise 2D images from any x, y and z directions, taking a line from each image.
The work presented in [7] has developed software that achieves auto-segmentation and tissue characterization. The presented algorithm was designed and developed for analysis of medical images based on hybridization of syntactic and statistical approaches, using artificial neural network (ANN). The analysis of medical image is directly based on the following four steps: 1) image filtering, 2) segmentation, 3) feature extraction, and 4) analysis of extracted features by a pattern recognition system or classifier. The presented approach directly combines second, third, and fourth steps into one algorithm. This is a semi-supervised approach in which supervision is involved only at the level of defining texture-primitive cell; afterwards, the algorithm scans the whole image and performs the segmentation and classification in an unsupervised manner.
[image:2.595.37.289.574.685.2]into two classes: I) including a) amplitude segmentation methods based on histogram features, b) edge-based segmentation, c) region-based segmentation, and II) based on textural feature.
The problem of feature extraction and classification has been broadly dealt with under the subject area of pattern recognition. Whose main aim is to identify patterns and sub-patterns in an image or scene. A pattern recognition system consists of three subsystems: 1) a subsystem to define a pattern/texture class, 2) a subsystem to extract selected features, and 3) a subsystem for classification known as a classifier. The pattern classes are normally defined in supervised mode; after this, the desired features are extracted by feature-extracting subsystem, and finally classification is done on the basis of extracted features by the classifier. The three main approaches of pattern recognition for feature extraction and classification based on the type of features are: 1) statistical approaches, 2) syntactic or structural approaches, and 3) spectral approaches.
The modified bidirectional associative memory (BAM) -type ANN-based algorithm has several features which are: 1) supervision is required only for selecting texture primitives, 2) it does not require training, and 3) it is able to provide results, particularly in the presence of noise and distortion [7].
The work presented in [8] established and discussed the main approaches to prepare the confocal microscope corneal images for subsequent analysis. It addressed the problems associated with capturing and processing these images including blurring, non-uniform illumination and noise, as well as the displacement of images laterally and in the anterior– posterior direction caused by subject movement due to respiration, cardiac pulse, or other factors. The latter may cause some of the captured images to be out of sequence in x, y, and z directions. Classification, reordering, registration and segmentation approaches have been discussed and evaluated. The successful implementation of these algorithms could open the door for another interesting development to efficiently preprocess the confocal corneal data sets and enable a complete corneal analysis system with 3D modelling.
The work shown in [9] established an approach to precisely obtain the boundaries of five primary corneal layers. The proposed method facilitates robust boundary extraction in the presence of noise and artifacts. It has three phases: the first phase applies morphological operators to enhance the prominent structural features of the cornea; the second phase uses a semi-automated segmentation algorithm to extract the upper and lower boundaries of the cornea which are used to register the corneal images; the third phase extracts all five boundaries using a global optimisation method exploiting the medial correspondence relationship between each layer.
The thickness of the adult cornea is only about 0.5 mm and is comprised of five layers as mentioned in the introduction. It is essential for the analysis of corneal swelling, acidosis, and altered corneal oxygen consumption to precisely measure the thickness of all corneal layers. It might be thought that existing methods such as active contour intelligent scissors, enhanced intelligent scissor, and edge relaxation and linking techniques could be adapted for segmentation of the layers of the cornea.
On the other hand, active contours or deformable models based, fully-automatic segmentation approaches are not suitable for corneal layer extraction because the layers of the cornea are characterised by low signal-to-noise ratios. In the intelligent scissors (IS) approach, a semi-automatic segmentation algorithm, the user selects seed points on the boundary and, as the mouse moves along the boundary, the optimal boundary path between the starting point and the current point is obtained. The main advantages of this approach is that the segmentation is accomplished, in principle, in the users real-time; which means that rapid image segmentation is achieved, and that the boundary accuracy resulting from this type of method is generally higher than from fully automatic methods because user knowledge is utilised throughout this process. However, existing IS-based methods for precise measurement of cornea thickness suffer from several problems. First, the boundary definition for existing IS methods rely on image gradients, which makes the algorithm sensitive to contrast non-uniformities resulting from low signal-to-noise ratios associated with OCT corneal images. Second, clinicians perform relatively accurate manual tracing along the region boundary because existing IS methods, particularly for complex regions of interest, can be laborious and time-consuming and laborious. To overcome some of the problems associated with IS, enhanced intelligent scissors (EIS) was proposed. It uses a phase-based representation of the image as the external local cost, instead of the image gradient. However, for the extraction of the layers of the cornea, the EIS approach alone is not suitable.
The semi-automatic model-based segmentation method proposed in [9] was designed to minimise user input to precisely locate the layers of the cornea. First, the algorithm using an enhanced intelligent scissor (EIS), which is a user-interactive semi-supervised segmentation method, to identify the epithelium (upper) and the endothelium (lower) layer of the cornea. Second, a correspondence model using the medial axis transform (MAT) is established between the upper and lower layer of the cornea. Finally, using the correspondence between layers extracted using the medial axis transform relationship, the boundaries are determined from discrete optimisation followed by parameter estimation.
B. Clinical Cornea Related Research work
rather difficult to see under normal circumstances, is an acellular layer of moderate reflectivity. However, no nerve plexus is found in this region. The endothelial cells, which area located immediately posterior to Descemet’s membrane, are characterised by regular hexagonal hyper-reflective shape surrounded by hypo-reflective borders with no evidence of any nuclei reflection. No vessels or nerves are present at this level.
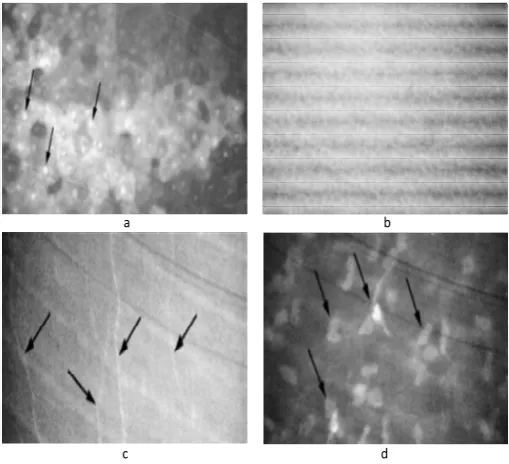
The work presented in [10] also shows different diseases affecting the epithelium layer, such as amiodarone-induced keratopathy, which is characterised by high reflective bright intracellular inclusions in the corneal epithelial cells. Moreover, other corneal layers may be involved. Bright microdots are found within the anterior and posterior stroma, and on the endothelial cell layer in more advanced cases. Keratocyte density reduces in the anterior stroma, and a markedly irregular aspect of the stromal nerve fibers with claw-shaped appearance of the nerve trunks.
a b
[image:4.595.37.292.251.483.2]c d
Fig. 4. Corneal abnormal cases: (a) Hyper-reflective nuclei, (b) Basal
epithelial cells, (c) Subepithelial nerve, (d) Hyper-reflective keratocyte nuclei.
The corneal amyloidosis is presented as subepithelial and anterior stromal gray white deposits. The confocal microscope shows these deposits as extracellular, hyper-reflective, cotton candy-like material, while ciprofloxacin corneal deposits are presented as highly reflective deposits in areas devoid of epithelium. The advancing wave-like epitheliopathy disease, at the level of the corneal epithelium, is characterised by the presence of atypical elongated cells with centripetally oriented long axis and hyper-reflective nuclei.
The work presented in [10] has also shown the following stromal Abnormalities. Lattice dystrophy has linear and branching hyper-reflective structures with changing reflectivity and poorly demarcated margins, which are visible in the stroma as shown in Fig. 5(a) (white arrows indicate some hyper-reflective keratocytes). Fleck dystrophy may be seen throughout the stroma as intracellular hyper-reflective dots of
various shapes. They consisted of spherical matter with a diameter of 3 to 5 µm and are sometimes enclosed in cyst-like structures (Fig. 5(b)). Reis-Buckler dystrophy is an opacity which may extend into the anterior stroma (Fig. 5(c)). Granular dystrophy is disease deposits in the stroma found as extracellular highly reflective material separated by areas of normal tissue, while in Schnyder crystalline corneal dystrophy an accumulation of reflective crystalline material is observed in the anterior stromal keratocytes and in association with prominent subepithelial nerves, as seen in Fig. 5(d).
Endothelial Pathologies are also presented in [10]. These include cornea guttata, which appears as roundish hypo-reflective images with an occasional central highlight at the level of the endothelium. Iridocorneal endothelial syndrome has areas of highly abnormal cells characterised by marked epithelial-like appearance and loss of regularity in size and shape were found. Posterior polymorphous dystrophy happens at the level of Descemet’s membrane and roundish hypo-reflective images are found within patchy hyper-hypo-reflective areas.
a b
[image:4.595.306.558.285.519.2]c d
Fig. 5. Corneal abnormal cases: (a) Lattice dystrophy, (b) Fleck dystrophy,
(c) Reis-Buckler dystrophy, (d) Schnyder crystalline corneal dystrophy.
This work, [10], explored other abnormalities and diseases that appear in the different corneal layers. For example, Thygeson epithelial keratitis, recurrent erosion syndrome, Meesman dystrophy, dry eyes, and Salzmann nodular degeneration are documented at the epithelial level. Also, Central cloudy dystrophy of Francois, Tangier disease, Maroteaux-Lamy syndrome, Scheie syndrome, Marfan disease, and cornea farinata are documented at the stromal level. Brown-McLean syndrome can be identified at endothelial level. The cornea can be also affected by diabetes and contact lens wear.
nucleus, surrounded by a dark halo. They are 40-50 µm in size. The wing cells are identified by their bright cell borders and a bright cell nucleus, and unlike superficial epithelial cells, have no dark oval ring around the nucleus. Basal epithelial cells appear as a regular mosaic of dark cell bodies with light, narrow inter-cellular borders and they have a smaller diameter which is 8-10 µm. The sub-basal nerve plexus, which runs parallel to the corneal surface, appears as bright, well-defined linear structures, frequently demonstrating branches or anastomoses. Bowman's layer appears as an amorphous layer when viewed with confocal microscopy [11]. The normal Descemet's membrane appears as an acellular layer between the posterior stroma and the endothelium and may be indiscernible by confocal microscopy, particularly in younger subjects. The endothelial layer reveals regular hexagonal cells with a honeycomb appearance; it is easy to recognise this layer because of its clearly identifiable structure [11].
The work presented in [11] shows several corneal abnormalities. Keratoconus is a non-inflammatory ectasia of the cornea, in which the cornea has a conical shape. Map-dot-fingerprint (MDF) dystrophy is observed as abnormal epithelial basement membrane folds, it is illustrated in Fig. 6(a). Meesmann's corneal dystrophy has also been imaged with multiple cyst-like changes that are seen at the level of the basal epithelium (Fig. 6(b)). In granular corneal dystrophy, hyper-reflective breadcrumb-like deposits measuring approximately 50 µm in diameter are observed in the epithelium and stroma. The central cloudy dystrophy of François presents small hyper-reflective granules in the anterior stroma, with opacity and dark striae in the posterior stroma. Fuchs' endothelial dystrophy demonstrates corneal guttae which appear as bright spots surrounded by a dark halo (Fig. 6(c)). In posterior polymorphous corneal dystrophy (PPCD), vesicles are observed in PPCD that demonstrate round lesions containing endothelial cells with surrounding haze (Fig. 6(d)).
a b
[image:5.595.307.552.410.632.2]c d
Fig. 6. Corneal abnormal cases: (a) Map-dot-fingerprint, (b) Meesmann's
corneal dystrophy, (c) Fuchs' dystrophy, (d) Posterior polymorphous corneal dystrophy.
III. THE PROPOSED APPROACH
A. The Data Sets
A number of different data sets have been employed in this study. The image acquisition instrument was a ConfoScan 4 confocal microscope (Nidek Technologies, Padova, Italy). Generally, the corneal layers, epithelium (thickness of 50 µm), stroma (thickness of 400 µm), and endothelium (thickness 30 µm), are clearly visible using this microscope. The stroma’s full thickness represents 80% - 90% of the cornea.
[image:5.595.38.284.451.667.2]These data sets consist of 3 sequences of respectively 85, 127, and 144 images from epithelium layer to endothelium taken from 3 patients by the confocal microscope. All these images were acquired with a Z ring was installed, so they are in the right order [12, 13]. The inspected field is of 460x345 μm at 40X magnification. The acquired images are in JPEG compressed format, monochrome, and of size 768x576 pixel [6, 14].
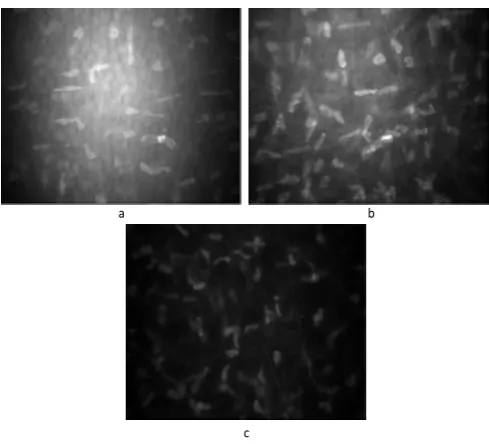
The keratocytes nuclei of the stroma cells are usually brighter than the dark background of the surrounding extracellular tissue, but it is usually difficult to identify them consistently over the whole acquired image. This is because these images are subject to non-uniform illumination and additional noise in peripheral regions which suffer a darkening effect. Fig. 7 shows samples of corneal images acquired by confocal microscopy during the same scan, with different level of darkness. The non-uniformity is due to many factors, including the non-uniform reflection and attenuation of illumination light in the different corneal areas along the various illumination paths of the spherical shape corneal layers [15].
a b
c
Fig. 7. Confocal stroma images: The darkness and the blurred low contrast
features vary from (a) to (c).
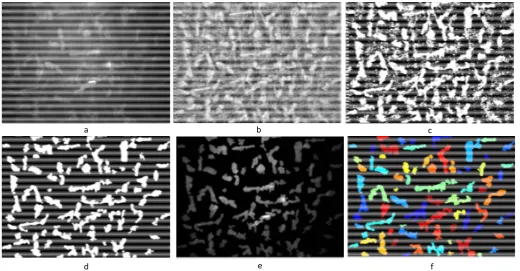
show high contrast and sharp edges can be consistently identified, but those with low contrast and blurred edges will be inconsistently recognised. Such a problem must be carefully treated in the design of keratocytes detection approaches. The preprocessing approach deployed in [15] is based on an equalisation procedure followed by median filter to reduce the artifacts developed. In the work presented in [6] a high-pass frequency filter was applied, followed by intensity adjustment using a sinusoidal transformation curve, an example of the preprocessed image is presented in Fig. 8 (b). The work presented in [16] used DCT approach and fuzzy enhancement for preprocessing of the corneal images, and the outputs of these two approaches are shown in Fig. 9 (a) and Fig. 9 (b) respectively. However the developed preprocessing approach presented in this paper shows better results in comparison with the previously mentioned methods. A subjective evaluation has been carried out for this comparison. The stromal keratocytes have been clearly detected without any noise in the displayed images using this approach (Fig. 11). The preprocessed corneal images can be obtained automatically through the developed GUI with the ability to display the relevant statistical information at the same time as selecting the required image. Also, the preprocessing procedure is implemented on the whole corneal image, not on a selected area of the original image as in some earlier work. The details of this approach and the GUI are presented in the following sections.
[image:6.595.36.291.344.452.2]a b
Fig. 8. The original (a) and preprocessed (b) images presented in [6].
a b
Fig. 9. The preprocessed images presented in [16], a: using DCT approach,
b: using fuzzy enhancement approach.
B. The Preprocessing Approach
The proposed preprocessing approach is presented in Fig. 10. The first stage in the proposed approach is applying an enhancement process to compensate for the non-uniformity over the image field. After that an adaptive thresholding strategy is employed followed by a series of morphological
operations to refine the detected cells and statistics-based measurements for the final candidates’ selection and counting.
The aim of the image enhancement (adaptive contrast enhancement) is to improve the illumination uniformity of the original image using modified histogram equalisation where 18x18 windows of the original image are processed individually to match a Rayleigh histogram distribution. The processed sub-images are then combined using bilinear interpolation to compensate for the possible induced boundaries between these processed portions. A contrast stretching transform over 95% of the image histogram is applied to increase the overall contrast. A 3 x 3 median filter is finally applied to compensate for the increase in the noise amplitude which comes as a result of the above enhancement steps [17].
An adaptive binarisation step is performed locally. The enhanced image from the previous step is divided into square blocks of size 64x64 pixels, and Otsu’s [18] thresholding approach is applied on each block. The resulting binary blocks are then combined to form the whole segmented binary image.
Morphological operations are performed in the third step. A series of morphological opening (using disk shaped structure elements of 2, 3, 4 pixels radii) are performed on the resulting binary image to refine the shapes of the detected objects, followed by a morphological filling operation to fill the small holes inside the closed objects in the binary image. A candidates’ selection procedure is employed after that. The properties of connected objects in the output image is calculated and recorded. Objects that have a total area of less than 250 pixels are excluded. The remaining objects are then counted to calculate the cells density in the stroma layer.
Confocal Microscope Enhancement Binarisation
[image:6.595.308.556.416.545.2]Refinment Output Images Candidate Selection
Fig. 10.The proposed confocal corneal preprocessing approach.
[image:6.595.39.292.489.595.2]C. The Graphical User Interface
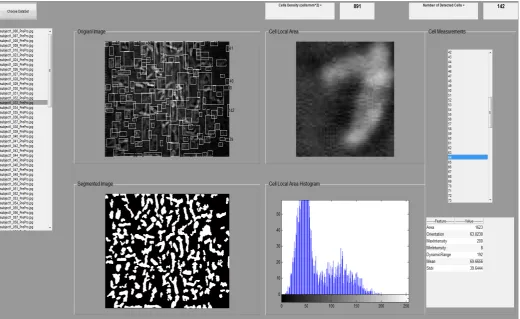
An interactive graphical user interface (GUI) has been developed. This GUI allows the user to select the data set and then all the associated images are displayed. The user has the ability to choose a certain image from the displayed list, and then the selected image is displayed with the preprocessed image in real time. Further analysis for a specific ROI in that image can be also performed. The stroma cell density, as well as the number of detected cells is displayed. This GUI detects the stroma cells and displays their indices for further cell measurement. The GUI has a section for the cell analysis, which contains a list of all the detected cells labels and the ability to display a certain selected cell. The local area histogram of that selected cell is also displayed. The GUI displays the following statistical information at the same time for the selected image: the area, orientation, maximum intensity, minimum intensity, dynamic range, mean and standard deviation. Fig. 12 shows the developed GUI including all the display options.
IV. CONCLUSIONS
The confocal microscope provides a sequence of images at different depths of the various corneal layers (Epithelium, Bowman’s membrane, Stroma, Decement’s membrane and Endothelium) and structures. The data sets employed in this study consist of 3 sequences of respectively 85, 127, and 144 images from epithelium layer to endothelium taken from 3 patients by a confocal microscope. An efficient preprocessing approach for confocal corneal images consisting of three main steps including enhancement, binarisation and refinement with
morphological operations has been developed and presented in this paper. The developed approach has improved the visual appearance of the original images by reducing the variation of illumination both within individual images and between images. The approach also detects individual cells in the resulting enhanced images so they can be counted and have their individual properties and density measured. A subjective based comparison has been carried out with the other preprocessing methods presented in the literature to evaluate the outputs of the developed approach. The developed approach has enhanced the visual appearance of the confocal corneal images to be used for subsequent analysis and classification. A useful interactive graphical user interface has been also developed to give the user the opportunity to visualise different corneal data sets, display a certain region of interest or cell, display useful statistical information about the processed cell and show the cell count and density in the processed stroma image. All these steps can be obtained in the real time from choosing the original image. The developed approach forms the first stage of a complete intelligent system which employs artificial neural network as well as adaptive neuro-fuzzy inference system to analyse and classify confocal microscope corneal images. The next future step includes the development of a complete intelligent corneal processing and analysis system with the consideration of different abnormal corneal confocal data sets.
ACKNOWLEDGEMENTS
The authors would like to thank the NHS National Innovation Centre and the University of Bradford for funding the project. Sofyan Hayajneh would like to thank Isra University for their support.
a b c
[image:7.595.39.560.424.695.2]d e f
Fig. 11.Confocal corneal system outputs: (a) Original stroma image, (b) Enhanced image, (c) Combined thresholded image, (d) Image after the morphological
Fig. 12.The developed GUI including all the displaying features.
REFERENCES
[1] M. D. Paul and A. Sieving. Facts About The Cornea and Corneal
Disease. National Eye Institute, National Institutes of Health.
http://www.nei.nih.gov/health/cornealdisease/, 2014
[2] G. K. Klintworth, and J. A. C. Wadsworth. Corneal dystrophy
foundation. http://www.cornealdystrophyfoundation.org/, 2014.
[3] W. Paddock, T. J. Fellers, and M. W. Davidson. Confocal Microscopy
Basic Concepts. http://www.microscopyu.com/articles/confocal/, 2014.
[4] Eyecare medical Group.
http://www.eyecaremed.com/cornea-disease-infection-maine.html, 2013.
[5] http://www.teresewinslow.com, 2014.
[6] F. Scarpa, D. Fiorin, and A. Ruggeri. In Vivo Three-Dimensional
Reconstruction of the Cornea from Confocal Microscopy Images. Engineering in Medicine and Biology Society, 2007. EMBS
2007. 29th Annual International Conference of the IEEE, vol., no.,
pp.747-750, doi: 10.1109/IEMBS.2007.4352398, Aug, 2007.
[7] N. Sharma, et al. Segmentation and classification of medical images
using texture-primitive features: Application of BAM-type artificial neural network. Journal of medical physics, Association of Medical Physicists of India 33(3): 119-126, 2008.
[8] A. Elbita, R. Qahwaji, S. Ipson, M. S. Sharif, F. Ghanchi, Preparation of
2D Sequences of Corneal Images for 3D Model Building, Computer Methods and Programs in Biomedicine, 114(2):194-205, ISSN 0169-2607, 2014.
[9] J. A. Eichel, A. K. Mishra, P. W. Fieguth, D. A. Clausi, and K. K.
Bizheva. A Novel Algorithm for Extraction of the Layers of the
Cornea. Canadian Conference on Computer and Robot Vision, vol., no., pp.313,320, 25-27 May, 2009.
[10] A. G. Y. Chiou, et al. Clinical Corneal Confocal Microscopy. Survey of
Ophthalmology, 51 (5), 482-500, 2006.
[11] R. L. Niederer and C. N. J. Mcghee. Clinical in vivo confocal
microscopy of the human cornea in health and disease. Progress in Retinal and Eye Research, 29 (1), 30-58, 2010.
[12] S. V. Patel, J. W. McLaren, C. J. Jon, N. R. Leif, and B. M. William.
Automated quantification of keratocyte density by using confocal microscopy in vivo. Investigative ophthalmology & visual science 40, no. 2: 320-326, 1999.
[13] J. C. Erie, S. V. Patel, J. W. McLaren, D. O. Hodge, and B. M. William.
Corneal keratocyte deficits after photorefractive keratectomy and laser in situ keratomileusis. American journal of ophthalmology 141, no. 5: 799-809, 2006.
[14] NIDEK TECHNOLOGIES Srl, Eye & Health Care. http://www.nidek
technologies.it/ProductsCS4All.htm, 2014.
[15] F. Scarpa, E. Grisan, and A. Ruggeri. Automatic recognition of corneal
nerve structures in images from confocal microscopy. Investigative ophthalmology & visual science 49, no. 11: 4801-4807, 2008.
[16] A. Elbita, R. Qahwaji, S. Ipson, T. Ahmed, K. Ramaesh, T. Colak.
Recent Advances in Corneal Imaging. Applied Signal and Image Processing: Multidisciplinary Advancements. DOI: 10.4018/978-1-60960-477-6.ch016, 2011.
[17] R. C. Gonzalez and R. E. Woods, Digital Image Processing, 2nd ed.
Prentice Hall, 2002.
[18] N. Otsu. A threshold selection method from gray-level histograms, IEEE
![Fig. 8. The original (a) and preprocessed (b) images presented in [6].](https://thumb-us.123doks.com/thumbv2/123dok_us/435438.1043087/6.595.308.556.416.545/fig-original-preprocessed-b-images-presented.webp)